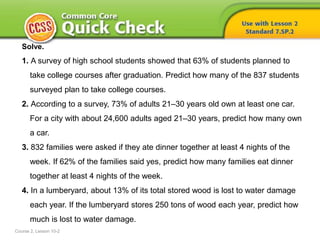
SlideShare a Scribd company logo
1 of 18
Solve.
1. A survey of high school students showed that 63% of students planned to
take college courses after graduation. Predict how many of the 837 students
surveyed plan to take college courses.
2. According to a survey, 73% of adults 21–30 years old own at least one car.
For a city with about 24,600 adults aged 21–30 years, predict how many own
a car.
3. 832 families were asked if they ate dinner together at least 4 nights of the
week. If 62% of the families said yes, predict how many families eat dinner
together at least 4 nights of the week.
4. In a lumberyard, about 13% of its total stored wood is lost to water damage
each year. If the lumberyard stores 250 tons of wood each year, predict how
much is lost to water damage.
Course 2, Lesson 10-2
ANSWERS
1. 527
2. 17,958
3. 516
4. 32.5 tons
HOW do you know
which type of graph to use
when displaying data?
Statistics and Probability
Course 2, Lesson 10-2
Course 2, Lesson 10-2 Common Core State Standards © Copyright 2010. National Governors Association Center for Best Practices and
Council of Chief State School Officers. All rights reserved.
Statistics and Probability
• 7.SP.1
Understand that statistics can be used to gain information about a
population by examining a sample of the population;
generalizations about a population from a sample are valid only if
the sample is representative of that population. Understand that
random sampling tends to produce representative samples and
support valid inferences.
• 7.SP.2
Use data from a random sample to draw inferences about a
population with an unknown characteristic of interest. Generate
multiple samples (or simulated samples) of the same size to gauge
the variation in estimates or predictions.
Course 2, Lesson 10-2 Common Core State Standards © Copyright 2010. National Governors Association Center for Best Practices and
Council of Chief State School Officers. All rights reserved.
Statistics and Probability
Mathematical Practices
1 Make sense of problems and persevere in solving them.
3 Construct viable arguments and critique the reasoning of others.
4 Model with mathematics.
5 Use appropriate tools strategically.
• To determine if a sample is
biased or unbiased
• To use sampling to make a
prediction
Course 2, Lesson 10-2
Statistics and Probability
Course 2, Lesson 10-2
Statistics and Probability
• unbiased sample
• simple random sample
• systematic random sample
• biased sample
• convenience sample
• voluntary response sample
1
Need Another Example?
Step-by-Step Example
1. A random sample of students at a middle school shows
that 10 students prefer listening to rock, 15 students prefer
listening to hip hop, and 25 students prefer no music while
they exercise. It can be concluded that half the students
prefer no music while they exercise.
This is a simple random sample. So, the sample is unbiased and the
conclusion is valid.
Determine whether the conclusion is valid.
Justify your answer.
Answer
Need Another Example?
One classroom of students is surveyed to determine
the theme for the spring dance. Out of 25 students,
15 chose Blast from the Past. The dance committee
concluded that 60% of the students like this theme
best. Is the sample method valid? Justify your
answer.
The conclusion is not valid. This is a
biased convenience sample since only
one classroom is surveyed.
1
Need Another Example?
Step-by-Step Example
2. Every tenth person who walks into a department store is surveyed to
determine his or her music preference. Out of 150 customers, 70
stated that they prefer rock music. The manager concludes that about
half of all customers prefer rock music.
Since the population is every tenth customer of a department store,
the sample is an unbiased, systematic random sample. The
conclusion is valid.
Determine whether the conclusion is valid.
Justify your answer.
Answer
Need Another Example?
Every tenth student who walked into the cafeteria
was surveyed to determine his or her favorite
lunch. Out of 40 students, 19 students stated that
they liked the burgers best. The staff concluded
that about 50% of the students like burgers best.
Is the sample method valid? Justify your answer.
The conclusion is valid. This is an unbiased
systematic random sample.
1
Need Another Example?
Step-by-Step Example
3. The customers of a music
store are surveyed to
determine their
favorite leisure
time activity. The
results are shown
in the graph. The store
manager concludes that
most people prefer to listen
to music in their leisure time.
The customers of a music store probably like to listen to music in their
leisure time. The sample is a biased, convenience sample since all of
the people surveyed are in one specific location. The conclusion is
not valid.
Determine whether the conclusion is valid.
Justify your answer.
Answer
Need Another Example?
Janet surveyed the athletes on the girls’ field
hockey team to determine which sports
teenagers like best. Of these, 65% said that
they like field hockey best. Janet concluded
that over half of teenagers like field hockey
best. Is the sample method valid? Justify your
answer.
The conclusion is not valid. This is a
biased sample because Janet used a
convenience sample.
1
Need Another Example?
2
3
Step-by-Step Example
4. A store sells 3 types of pants:
jeans, capris, and cargos. The
store workers survey 50
customers at random about their
favorite type of pants. The survey
responses are indicated at the
right. If 450 pairs of pants are
ordered, how many should be
jeans?
First, determine whether the sample method is valid. The sample is a
simple random sample since customers were randomly selected.
Thus, the sample method is valid.
or 50% of the customers prefer jeans.
So, find 50% of 450.
0.5 × 450 = 225, so about 225 pairs of jeans should be ordered.
Answer
Need Another Example?
The library is trying to decide what types of books to sell at its book
fair. It surveyed 40 students at random. The results are in the table.
If 220 books are to be sold at the book fair, how many should be
mysteries?
66 books
How did what you learned
today help you answer the
HOW do you know
which type of graph to use
when displaying data?
Course 2, Lesson 10-2
GeometryStatistics and Probability
How did what you learned
today help you answer the
HOW do you know
which type of graph to use
when displaying data?
Course 2, Lesson 10-2
GeometryStatistics and Probability
Sample answers:
• When determining if a conclusion is valid based upon
the sampling method used
• When using a valid sampling to make a prediction in a
real-world context
Name one type of biased
sample and explain the bias.
Course 2, Lesson 10-2
Ratios and Proportional RelationshipsFunctionsStatistics and Probability

More Related Content

Similar to (7) Lesson 10.2

Sample and population
Sample and populationSample and population
Sample and populationMs. Jones
 
COT INQUIRIES Population and sampling.pptx
COT INQUIRIES Population and sampling.pptxCOT INQUIRIES Population and sampling.pptx
COT INQUIRIES Population and sampling.pptxFlorissaConise3
 
Exercise 7-1 Q # 10 Number of faculty. the numbers of faculty .docx
Exercise 7-1 Q # 10 Number of faculty. the numbers of faculty .docxExercise 7-1 Q # 10 Number of faculty. the numbers of faculty .docx
Exercise 7-1 Q # 10 Number of faculty. the numbers of faculty .docxgitagrimston
 
Learning Objectives.docx
Learning Objectives.docxLearning Objectives.docx
Learning Objectives.docxbozo18
 
Communication jarmilas presentation
Communication jarmilas presentationCommunication jarmilas presentation
Communication jarmilas presentationIuliana Filfanescu
 
Lesson 6 - Primary Research Methods 2
Lesson 6  - Primary Research Methods 2Lesson 6  - Primary Research Methods 2
Lesson 6 - Primary Research Methods 2Kavita Parwani
 
Sample surveys
Sample surveysSample surveys
Sample surveyswinnsara
 
Singapore presentation copy
Singapore presentation   copySingapore presentation   copy
Singapore presentation copylorawallenstein
 
Q3-M7_3Is_Population-and-Sampling-Methods (1).pdf
Q3-M7_3Is_Population-and-Sampling-Methods (1).pdfQ3-M7_3Is_Population-and-Sampling-Methods (1).pdf
Q3-M7_3Is_Population-and-Sampling-Methods (1).pdfjaysonflores25
 
Q3-M7_3Is_Population-and-Sampling-Methods.pdf
Q3-M7_3Is_Population-and-Sampling-Methods.pdfQ3-M7_3Is_Population-and-Sampling-Methods.pdf
Q3-M7_3Is_Population-and-Sampling-Methods.pdfMAEANNTOLENTINO2
 
Students and Faculty of UMD Library Services
Students and Faculty of UMD Library ServicesStudents and Faculty of UMD Library Services
Students and Faculty of UMD Library ServicesStephanie Garberick
 
Mr course module 02 b
Mr course module 02 bMr course module 02 b
Mr course module 02 bMROC Japan
 
Normaldistribution questions
Normaldistribution questionsNormaldistribution questions
Normaldistribution questionsIIUM
 
L3 quantitative vs. qualitative
L3 quantitative vs. qualitativeL3 quantitative vs. qualitative
L3 quantitative vs. qualitativeTeacherMariza
 
powerpoint presentation on our researches
powerpoint presentation on our researchespowerpoint presentation on our researches
powerpoint presentation on our researchesLovelyVeniaJoven2
 

Similar to (7) Lesson 10.2 (20)

Sample and population
Sample and populationSample and population
Sample and population
 
COT INQUIRIES Population and sampling.pptx
COT INQUIRIES Population and sampling.pptxCOT INQUIRIES Population and sampling.pptx
COT INQUIRIES Population and sampling.pptx
 
Exercise 7-1 Q # 10 Number of faculty. the numbers of faculty .docx
Exercise 7-1 Q # 10 Number of faculty. the numbers of faculty .docxExercise 7-1 Q # 10 Number of faculty. the numbers of faculty .docx
Exercise 7-1 Q # 10 Number of faculty. the numbers of faculty .docx
 
Sample Surveys
Sample SurveysSample Surveys
Sample Surveys
 
Learning Objectives.docx
Learning Objectives.docxLearning Objectives.docx
Learning Objectives.docx
 
Communication jarmilas presentation
Communication jarmilas presentationCommunication jarmilas presentation
Communication jarmilas presentation
 
Lesson 6 - Primary Research Methods 2
Lesson 6  - Primary Research Methods 2Lesson 6  - Primary Research Methods 2
Lesson 6 - Primary Research Methods 2
 
Sample surveys
Sample surveysSample surveys
Sample surveys
 
Singapore presentation copy
Singapore presentation   copySingapore presentation   copy
Singapore presentation copy
 
Q3-M7_3Is_Population-and-Sampling-Methods (1).pdf
Q3-M7_3Is_Population-and-Sampling-Methods (1).pdfQ3-M7_3Is_Population-and-Sampling-Methods (1).pdf
Q3-M7_3Is_Population-and-Sampling-Methods (1).pdf
 
Q3-M7_3Is_Population-and-Sampling-Methods.pdf
Q3-M7_3Is_Population-and-Sampling-Methods.pdfQ3-M7_3Is_Population-and-Sampling-Methods.pdf
Q3-M7_3Is_Population-and-Sampling-Methods.pdf
 
Students and Faculty of UMD Library Services
Students and Faculty of UMD Library ServicesStudents and Faculty of UMD Library Services
Students and Faculty of UMD Library Services
 
Mr course module 02 b
Mr course module 02 bMr course module 02 b
Mr course module 02 b
 
Normaldistribution questions
Normaldistribution questionsNormaldistribution questions
Normaldistribution questions
 
Sampling
SamplingSampling
Sampling
 
Sample Surveys
Sample SurveysSample Surveys
Sample Surveys
 
Sample Surveys
Sample SurveysSample Surveys
Sample Surveys
 
Sampling methods
Sampling methodsSampling methods
Sampling methods
 
L3 quantitative vs. qualitative
L3 quantitative vs. qualitativeL3 quantitative vs. qualitative
L3 quantitative vs. qualitative
 
powerpoint presentation on our researches
powerpoint presentation on our researchespowerpoint presentation on our researches
powerpoint presentation on our researches
 

More from wzuri

Chapter 3
Chapter 3Chapter 3
Chapter 3wzuri
 
Chapter 2 inquiry_lab_presentation_course_3 (1)
Chapter 2 inquiry_lab_presentation_course_3 (1)Chapter 2 inquiry_lab_presentation_course_3 (1)
Chapter 2 inquiry_lab_presentation_course_3 (1)wzuri
 
Chapter 2 Review
Chapter 2 ReviewChapter 2 Review
Chapter 2 Reviewwzuri
 
Chapter 2 lesson_4_presentation_course_3
Chapter 2 lesson_4_presentation_course_3Chapter 2 lesson_4_presentation_course_3
Chapter 2 lesson_4_presentation_course_3wzuri
 
Chapter 5
Chapter 5Chapter 5
Chapter 5wzuri
 
Lesson 5.1
Lesson 5.1Lesson 5.1
Lesson 5.1wzuri
 
Lesson 1.8 grade 8
Lesson 1.8   grade 8Lesson 1.8   grade 8
Lesson 1.8 grade 8wzuri
 
Chapter 7
Chapter 7Chapter 7
Chapter 7wzuri
 
Lesson 7.4
Lesson 7.4Lesson 7.4
Lesson 7.4wzuri
 
Lesson 7.3 (8)
Lesson 7.3 (8)Lesson 7.3 (8)
Lesson 7.3 (8)wzuri
 
Lesson 7.2
Lesson 7.2Lesson 7.2
Lesson 7.2wzuri
 
Pat05 ppt 0201
Pat05 ppt 0201Pat05 ppt 0201
Pat05 ppt 0201wzuri
 
Chapter 6
Chapter 6Chapter 6
Chapter 6wzuri
 
Pat05 ppt 0106
Pat05 ppt 0106Pat05 ppt 0106
Pat05 ppt 0106wzuri
 
Pat05 ppt 0105
Pat05 ppt 0105Pat05 ppt 0105
Pat05 ppt 0105wzuri
 
Chapter 1 Review
Chapter 1 ReviewChapter 1 Review
Chapter 1 Reviewwzuri
 
Lesson 1.10 grade 8
Lesson 1.10   grade 8Lesson 1.10   grade 8
Lesson 1.10 grade 8wzuri
 
Lesson 1.9 grade 8
Lesson 1.9   grade 8Lesson 1.9   grade 8
Lesson 1.9 grade 8wzuri
 
Lesson 1.7 grade 8
Lesson 1.7   grade 8Lesson 1.7   grade 8
Lesson 1.7 grade 8wzuri
 
Lesson 1.7 grade 8
Lesson 1.7   grade 8Lesson 1.7   grade 8
Lesson 1.7 grade 8wzuri
 

More from wzuri (20)

Chapter 3
Chapter 3Chapter 3
Chapter 3
 
Chapter 2 inquiry_lab_presentation_course_3 (1)
Chapter 2 inquiry_lab_presentation_course_3 (1)Chapter 2 inquiry_lab_presentation_course_3 (1)
Chapter 2 inquiry_lab_presentation_course_3 (1)
 
Chapter 2 Review
Chapter 2 ReviewChapter 2 Review
Chapter 2 Review
 
Chapter 2 lesson_4_presentation_course_3
Chapter 2 lesson_4_presentation_course_3Chapter 2 lesson_4_presentation_course_3
Chapter 2 lesson_4_presentation_course_3
 
Chapter 5
Chapter 5Chapter 5
Chapter 5
 
Lesson 5.1
Lesson 5.1Lesson 5.1
Lesson 5.1
 
Lesson 1.8 grade 8
Lesson 1.8   grade 8Lesson 1.8   grade 8
Lesson 1.8 grade 8
 
Chapter 7
Chapter 7Chapter 7
Chapter 7
 
Lesson 7.4
Lesson 7.4Lesson 7.4
Lesson 7.4
 
Lesson 7.3 (8)
Lesson 7.3 (8)Lesson 7.3 (8)
Lesson 7.3 (8)
 
Lesson 7.2
Lesson 7.2Lesson 7.2
Lesson 7.2
 
Pat05 ppt 0201
Pat05 ppt 0201Pat05 ppt 0201
Pat05 ppt 0201
 
Chapter 6
Chapter 6Chapter 6
Chapter 6
 
Pat05 ppt 0106
Pat05 ppt 0106Pat05 ppt 0106
Pat05 ppt 0106
 
Pat05 ppt 0105
Pat05 ppt 0105Pat05 ppt 0105
Pat05 ppt 0105
 
Chapter 1 Review
Chapter 1 ReviewChapter 1 Review
Chapter 1 Review
 
Lesson 1.10 grade 8
Lesson 1.10   grade 8Lesson 1.10   grade 8
Lesson 1.10 grade 8
 
Lesson 1.9 grade 8
Lesson 1.9   grade 8Lesson 1.9   grade 8
Lesson 1.9 grade 8
 
Lesson 1.7 grade 8
Lesson 1.7   grade 8Lesson 1.7   grade 8
Lesson 1.7 grade 8
 
Lesson 1.7 grade 8
Lesson 1.7   grade 8Lesson 1.7   grade 8
Lesson 1.7 grade 8
 

Recently uploaded

Arihant handbook biology for class 11 .pdf
Arihant handbook biology for class 11 .pdfArihant handbook biology for class 11 .pdf
Arihant handbook biology for class 11 .pdfchloefrazer622
 
18-04-UA_REPORT_MEDIALITERAСY_INDEX-DM_23-1-final-eng.pdf
18-04-UA_REPORT_MEDIALITERAСY_INDEX-DM_23-1-final-eng.pdf18-04-UA_REPORT_MEDIALITERAСY_INDEX-DM_23-1-final-eng.pdf
18-04-UA_REPORT_MEDIALITERAСY_INDEX-DM_23-1-final-eng.pdfssuser54595a
 
Q4-W6-Restating Informational Text Grade 3
Q4-W6-Restating Informational Text Grade 3Q4-W6-Restating Informational Text Grade 3
Q4-W6-Restating Informational Text Grade 3JemimahLaneBuaron
 
Introduction to AI in Higher Education_draft.pptx
Introduction to AI in Higher Education_draft.pptxIntroduction to AI in Higher Education_draft.pptx
Introduction to AI in Higher Education_draft.pptxpboyjonauth
 
Paris 2024 Olympic Geographies - an activity
Paris 2024 Olympic Geographies - an activityParis 2024 Olympic Geographies - an activity
Paris 2024 Olympic Geographies - an activityGeoBlogs
 
Mastering the Unannounced Regulatory Inspection
Mastering the Unannounced Regulatory InspectionMastering the Unannounced Regulatory Inspection
Mastering the Unannounced Regulatory InspectionSafetyChain Software
 
Science 7 - LAND and SEA BREEZE and its Characteristics
Science 7 - LAND and SEA BREEZE and its CharacteristicsScience 7 - LAND and SEA BREEZE and its Characteristics
Science 7 - LAND and SEA BREEZE and its CharacteristicsKarinaGenton
 
Contemporary philippine arts from the regions_PPT_Module_12 [Autosaved] (1).pptx
Contemporary philippine arts from the regions_PPT_Module_12 [Autosaved] (1).pptxContemporary philippine arts from the regions_PPT_Module_12 [Autosaved] (1).pptx
Contemporary philippine arts from the regions_PPT_Module_12 [Autosaved] (1).pptxRoyAbrique
 
Presentation by Andreas Schleicher Tackling the School Absenteeism Crisis 30 ...
Presentation by Andreas Schleicher Tackling the School Absenteeism Crisis 30 ...Presentation by Andreas Schleicher Tackling the School Absenteeism Crisis 30 ...
Presentation by Andreas Schleicher Tackling the School Absenteeism Crisis 30 ...EduSkills OECD
 
A Critique of the Proposed National Education Policy Reform
A Critique of the Proposed National Education Policy ReformA Critique of the Proposed National Education Policy Reform
A Critique of the Proposed National Education Policy ReformChameera Dedduwage
 
Measures of Central Tendency: Mean, Median and Mode
Measures of Central Tendency: Mean, Median and ModeMeasures of Central Tendency: Mean, Median and Mode
Measures of Central Tendency: Mean, Median and ModeThiyagu K
 
How to Make a Pirate ship Primary Education.pptx
How to Make a Pirate ship Primary Education.pptxHow to Make a Pirate ship Primary Education.pptx
How to Make a Pirate ship Primary Education.pptxmanuelaromero2013
 
Grant Readiness 101 TechSoup and Remy Consulting
Grant Readiness 101 TechSoup and Remy ConsultingGrant Readiness 101 TechSoup and Remy Consulting
Grant Readiness 101 TechSoup and Remy ConsultingTechSoup
 
Employee wellbeing at the workplace.pptx
Employee wellbeing at the workplace.pptxEmployee wellbeing at the workplace.pptx
Employee wellbeing at the workplace.pptxNirmalaLoungPoorunde1
 
Accessible design: Minimum effort, maximum impact
Accessible design: Minimum effort, maximum impactAccessible design: Minimum effort, maximum impact
Accessible design: Minimum effort, maximum impactdawncurless
 
Software Engineering Methodologies (overview)
Software Engineering Methodologies (overview)Software Engineering Methodologies (overview)
Software Engineering Methodologies (overview)eniolaolutunde
 
The basics of sentences session 2pptx copy.pptx
The basics of sentences session 2pptx copy.pptxThe basics of sentences session 2pptx copy.pptx
The basics of sentences session 2pptx copy.pptxheathfieldcps1
 

Recently uploaded (20)

Arihant handbook biology for class 11 .pdf
Arihant handbook biology for class 11 .pdfArihant handbook biology for class 11 .pdf
Arihant handbook biology for class 11 .pdf
 
18-04-UA_REPORT_MEDIALITERAСY_INDEX-DM_23-1-final-eng.pdf
18-04-UA_REPORT_MEDIALITERAСY_INDEX-DM_23-1-final-eng.pdf18-04-UA_REPORT_MEDIALITERAСY_INDEX-DM_23-1-final-eng.pdf
18-04-UA_REPORT_MEDIALITERAСY_INDEX-DM_23-1-final-eng.pdf
 
Q4-W6-Restating Informational Text Grade 3
Q4-W6-Restating Informational Text Grade 3Q4-W6-Restating Informational Text Grade 3
Q4-W6-Restating Informational Text Grade 3
 
Introduction to AI in Higher Education_draft.pptx
Introduction to AI in Higher Education_draft.pptxIntroduction to AI in Higher Education_draft.pptx
Introduction to AI in Higher Education_draft.pptx
 
Paris 2024 Olympic Geographies - an activity
Paris 2024 Olympic Geographies - an activityParis 2024 Olympic Geographies - an activity
Paris 2024 Olympic Geographies - an activity
 
Mastering the Unannounced Regulatory Inspection
Mastering the Unannounced Regulatory InspectionMastering the Unannounced Regulatory Inspection
Mastering the Unannounced Regulatory Inspection
 
Science 7 - LAND and SEA BREEZE and its Characteristics
Science 7 - LAND and SEA BREEZE and its CharacteristicsScience 7 - LAND and SEA BREEZE and its Characteristics
Science 7 - LAND and SEA BREEZE and its Characteristics
 
Contemporary philippine arts from the regions_PPT_Module_12 [Autosaved] (1).pptx
Contemporary philippine arts from the regions_PPT_Module_12 [Autosaved] (1).pptxContemporary philippine arts from the regions_PPT_Module_12 [Autosaved] (1).pptx
Contemporary philippine arts from the regions_PPT_Module_12 [Autosaved] (1).pptx
 
Presentation by Andreas Schleicher Tackling the School Absenteeism Crisis 30 ...
Presentation by Andreas Schleicher Tackling the School Absenteeism Crisis 30 ...Presentation by Andreas Schleicher Tackling the School Absenteeism Crisis 30 ...
Presentation by Andreas Schleicher Tackling the School Absenteeism Crisis 30 ...
 
TataKelola dan KamSiber Kecerdasan Buatan v022.pdf
TataKelola dan KamSiber Kecerdasan Buatan v022.pdfTataKelola dan KamSiber Kecerdasan Buatan v022.pdf
TataKelola dan KamSiber Kecerdasan Buatan v022.pdf
 
A Critique of the Proposed National Education Policy Reform
A Critique of the Proposed National Education Policy ReformA Critique of the Proposed National Education Policy Reform
A Critique of the Proposed National Education Policy Reform
 
Measures of Central Tendency: Mean, Median and Mode
Measures of Central Tendency: Mean, Median and ModeMeasures of Central Tendency: Mean, Median and Mode
Measures of Central Tendency: Mean, Median and Mode
 
How to Make a Pirate ship Primary Education.pptx
How to Make a Pirate ship Primary Education.pptxHow to Make a Pirate ship Primary Education.pptx
How to Make a Pirate ship Primary Education.pptx
 
Grant Readiness 101 TechSoup and Remy Consulting
Grant Readiness 101 TechSoup and Remy ConsultingGrant Readiness 101 TechSoup and Remy Consulting
Grant Readiness 101 TechSoup and Remy Consulting
 
Employee wellbeing at the workplace.pptx
Employee wellbeing at the workplace.pptxEmployee wellbeing at the workplace.pptx
Employee wellbeing at the workplace.pptx
 
Accessible design: Minimum effort, maximum impact
Accessible design: Minimum effort, maximum impactAccessible design: Minimum effort, maximum impact
Accessible design: Minimum effort, maximum impact
 
Model Call Girl in Tilak Nagar Delhi reach out to us at 🔝9953056974🔝
Model Call Girl in Tilak Nagar Delhi reach out to us at 🔝9953056974🔝Model Call Girl in Tilak Nagar Delhi reach out to us at 🔝9953056974🔝
Model Call Girl in Tilak Nagar Delhi reach out to us at 🔝9953056974🔝
 
Staff of Color (SOC) Retention Efforts DDSD
Staff of Color (SOC) Retention Efforts DDSDStaff of Color (SOC) Retention Efforts DDSD
Staff of Color (SOC) Retention Efforts DDSD
 
Software Engineering Methodologies (overview)
Software Engineering Methodologies (overview)Software Engineering Methodologies (overview)
Software Engineering Methodologies (overview)
 
The basics of sentences session 2pptx copy.pptx
The basics of sentences session 2pptx copy.pptxThe basics of sentences session 2pptx copy.pptx
The basics of sentences session 2pptx copy.pptx
 

(7) Lesson 10.2

  • 1. Solve. 1. A survey of high school students showed that 63% of students planned to take college courses after graduation. Predict how many of the 837 students surveyed plan to take college courses. 2. According to a survey, 73% of adults 21–30 years old own at least one car. For a city with about 24,600 adults aged 21–30 years, predict how many own a car. 3. 832 families were asked if they ate dinner together at least 4 nights of the week. If 62% of the families said yes, predict how many families eat dinner together at least 4 nights of the week. 4. In a lumberyard, about 13% of its total stored wood is lost to water damage each year. If the lumberyard stores 250 tons of wood each year, predict how much is lost to water damage. Course 2, Lesson 10-2
  • 2. Course 2, Lesson 10-2 ANSWERS 1. 527 2. 17,958 3. 516 4. 32.5 tons
  • 3. HOW do you know which type of graph to use when displaying data? Statistics and Probability Course 2, Lesson 10-2
  • 4. Course 2, Lesson 10-2 Common Core State Standards © Copyright 2010. National Governors Association Center for Best Practices and Council of Chief State School Officers. All rights reserved. Statistics and Probability • 7.SP.1 Understand that statistics can be used to gain information about a population by examining a sample of the population; generalizations about a population from a sample are valid only if the sample is representative of that population. Understand that random sampling tends to produce representative samples and support valid inferences. • 7.SP.2 Use data from a random sample to draw inferences about a population with an unknown characteristic of interest. Generate multiple samples (or simulated samples) of the same size to gauge the variation in estimates or predictions.
  • 5. Course 2, Lesson 10-2 Common Core State Standards © Copyright 2010. National Governors Association Center for Best Practices and Council of Chief State School Officers. All rights reserved. Statistics and Probability Mathematical Practices 1 Make sense of problems and persevere in solving them. 3 Construct viable arguments and critique the reasoning of others. 4 Model with mathematics. 5 Use appropriate tools strategically.
  • 6. • To determine if a sample is biased or unbiased • To use sampling to make a prediction Course 2, Lesson 10-2 Statistics and Probability
  • 7. Course 2, Lesson 10-2 Statistics and Probability • unbiased sample • simple random sample • systematic random sample • biased sample • convenience sample • voluntary response sample
  • 8. 1 Need Another Example? Step-by-Step Example 1. A random sample of students at a middle school shows that 10 students prefer listening to rock, 15 students prefer listening to hip hop, and 25 students prefer no music while they exercise. It can be concluded that half the students prefer no music while they exercise. This is a simple random sample. So, the sample is unbiased and the conclusion is valid. Determine whether the conclusion is valid. Justify your answer.
  • 9. Answer Need Another Example? One classroom of students is surveyed to determine the theme for the spring dance. Out of 25 students, 15 chose Blast from the Past. The dance committee concluded that 60% of the students like this theme best. Is the sample method valid? Justify your answer. The conclusion is not valid. This is a biased convenience sample since only one classroom is surveyed.
  • 10. 1 Need Another Example? Step-by-Step Example 2. Every tenth person who walks into a department store is surveyed to determine his or her music preference. Out of 150 customers, 70 stated that they prefer rock music. The manager concludes that about half of all customers prefer rock music. Since the population is every tenth customer of a department store, the sample is an unbiased, systematic random sample. The conclusion is valid. Determine whether the conclusion is valid. Justify your answer.
  • 11. Answer Need Another Example? Every tenth student who walked into the cafeteria was surveyed to determine his or her favorite lunch. Out of 40 students, 19 students stated that they liked the burgers best. The staff concluded that about 50% of the students like burgers best. Is the sample method valid? Justify your answer. The conclusion is valid. This is an unbiased systematic random sample.
  • 12. 1 Need Another Example? Step-by-Step Example 3. The customers of a music store are surveyed to determine their favorite leisure time activity. The results are shown in the graph. The store manager concludes that most people prefer to listen to music in their leisure time. The customers of a music store probably like to listen to music in their leisure time. The sample is a biased, convenience sample since all of the people surveyed are in one specific location. The conclusion is not valid. Determine whether the conclusion is valid. Justify your answer.
  • 13. Answer Need Another Example? Janet surveyed the athletes on the girls’ field hockey team to determine which sports teenagers like best. Of these, 65% said that they like field hockey best. Janet concluded that over half of teenagers like field hockey best. Is the sample method valid? Justify your answer. The conclusion is not valid. This is a biased sample because Janet used a convenience sample.
  • 14. 1 Need Another Example? 2 3 Step-by-Step Example 4. A store sells 3 types of pants: jeans, capris, and cargos. The store workers survey 50 customers at random about their favorite type of pants. The survey responses are indicated at the right. If 450 pairs of pants are ordered, how many should be jeans? First, determine whether the sample method is valid. The sample is a simple random sample since customers were randomly selected. Thus, the sample method is valid. or 50% of the customers prefer jeans. So, find 50% of 450. 0.5 × 450 = 225, so about 225 pairs of jeans should be ordered.
  • 15. Answer Need Another Example? The library is trying to decide what types of books to sell at its book fair. It surveyed 40 students at random. The results are in the table. If 220 books are to be sold at the book fair, how many should be mysteries? 66 books
  • 16. How did what you learned today help you answer the HOW do you know which type of graph to use when displaying data? Course 2, Lesson 10-2 GeometryStatistics and Probability
  • 17. How did what you learned today help you answer the HOW do you know which type of graph to use when displaying data? Course 2, Lesson 10-2 GeometryStatistics and Probability Sample answers: • When determining if a conclusion is valid based upon the sampling method used • When using a valid sampling to make a prediction in a real-world context
  • 18. Name one type of biased sample and explain the bias. Course 2, Lesson 10-2 Ratios and Proportional RelationshipsFunctionsStatistics and Probability