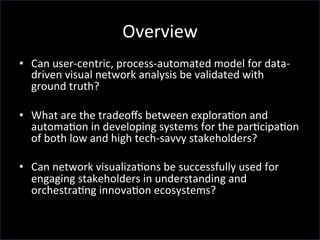
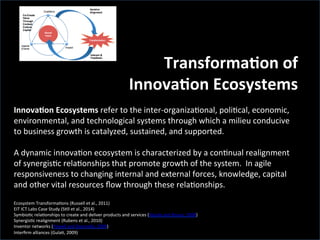
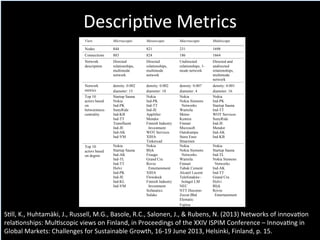
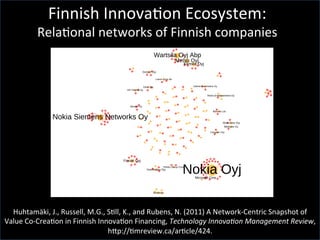
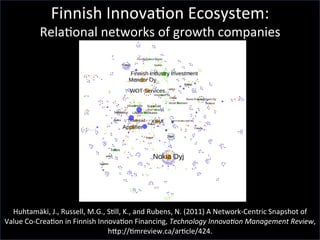
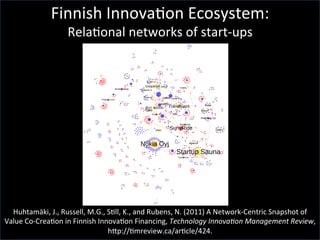
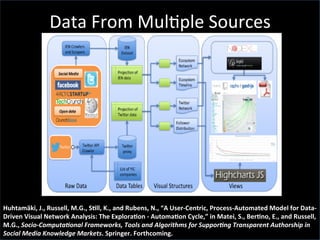
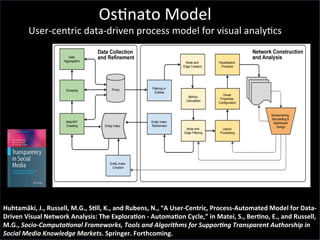
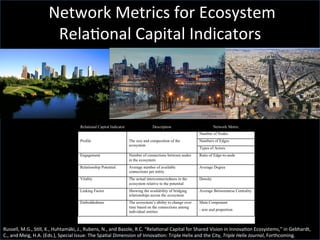
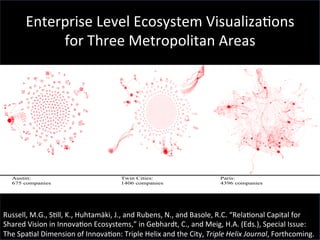
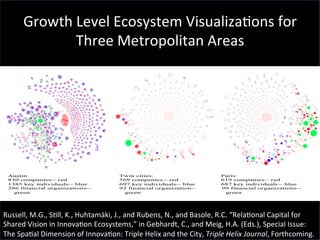
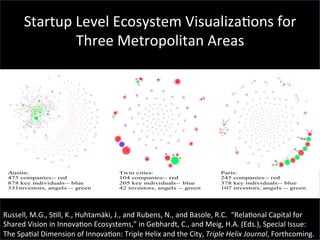
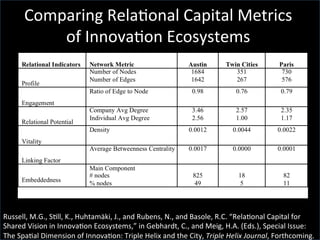
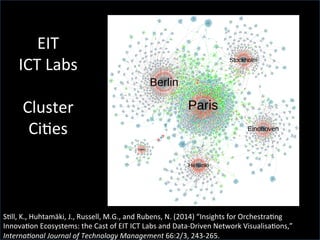
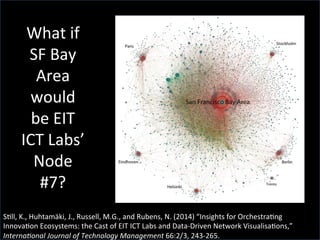
VISUALIZING	
  TRANSFORMATIVE	
  NETWORKS	
  
	
  IN	
  INNOVATION	
  ECOSYSTEMS	


Innova'on	
  Ecosystem	
  Network	


Interna'onal	
  Conference	
  on	
  Computa'onal	
  Social	
  Sciences	
  
June	
  8,	
  2015	
  
Martha	
  G	
  Russell	
  
Co-­‐Authors	
  
•  Martha	
  G	
  Russell	
  	
  
–  Stanford	
  University	
  
•  Jukka	
  Huhtamäki	
  	
  
–  Tampere	
  Univ	
  of	
  Technology	
  
•  Kaisa	
  SCll	
  	
  
–  VTT,	
  Finland	
  
•  Neil	
  Rubens	
  	
  
–  Univ	
  of	
  Electro-­‐communica'ons	
  
•  Jiafeng	
  Yu	
  	
  
–  VXPLO.com	
  
•  Rahul	
  C.	
  Basole	
  	
  
–  Georgia	
  Ins'tute	
  of	
  Technology	
  
Overview	
  
•  Can	
  user-­‐centric,	
  process-­‐automated	
  model	
  for	
  data-­‐
driven	
  visual	
  network	
  analysis	
  be	
  validated	
  with	
  
ground	
  truth?	
  	
  
•  What	
  are	
  the	
  tradeoffs	
  between	
  explora'on	
  and	
  
automa'on	
  in	
  developing	
  systems	
  for	
  the	
  par'cipa'on	
  
of	
  both	
  low	
  and	
  high	
  tech-­‐savvy	
  stakeholders?	
  
•  Can	
  network	
  visualiza'ons	
  be	
  successfully	
  used	
  for	
  
engaging	
  stakeholders	
  in	
  understanding	
  and	
  
orchestra'ng	
  innova'on	
  ecosystems?	


TransformaCon	
  of	


InnovaCon	
  Ecosystems	


InnovaCon	
  Ecosystems	
  refer	
  to	
  the	
  inter-­‐organiza'onal,	
  poli'cal,	
  economic,	
  
environmental,	
  and	
  technological	
  systems	
  through	
  which	
  a	
  milieu	
  conducive	
  
to	
  business	
  growth	
  is	
  catalyzed,	
  sustained,	
  and	
  supported.	


A	
  dynamic	
  innova'on	
  ecosystem	
  is	
  characterized	
  by	
  a	
  con'nual	
  realignment	
  
of	
  synergis'c	
  rela'onships	
  that	
  promote	
  growth	
  of	
  the	
  system.	
  	
  In	
  agile	
  
responsiveness	
  to	
  changing	
  internal	
  and	
  external	
  forces,	
  knowledge,	
  capital	
  
and	
  other	
  vital	
  resources	
  flow	
  through	
  these	
  rela'onships.	


Ecosystem	
  Transforma'ons	
  (Russell	
  et	
  al.,	
  2011)	
  
EIT	
  ICT	
  Labs	
  Case	
  Study	
  (S'll	
  et	
  al.,	
  2014)	
  
Symbio'c	
  rela'onships	
  to	
  create	
  and	
  deliver	
  products	
  and	
  services	
  (Basole	
  and	
  Rouse,	
  2008)	
  	
  
Synergis'c	
  realignment	
  (Rubens	
  et	
  al.,	
  2010)	
  
Inventor	
  networks	
  (Powell	
  and	
  Giannella,	
  2009)	
  	
  
Interfirm	
  alliances	
  (Gula',	
  2009)	
  
Agents
Events
Impact
Coalitions
Shared	
  
Vision	
  
Transforma'on	
  
Iterative
Alignment
Interact &
Feedback
Co-Create
Value
Through
Context,
Culture,
Capital
Shared Vision Transforms
Russell, M.G., Still, K., Huhtamäki, J., and Rubens, N., “Relational Capital for Shared Vision in Innovation Ecosystems,” in Gebhardt,
C., and Meig, H.A. (Eds.), Special Issue: The Spatial Dimension of Innovation: Triple Helix and the City, Triple Helix Journal,
Forthcoming.


S'll,	
  K.,	
  Huhtamäki,	
  J.,	
  Russell,	
  M.G.,	
  Basole,	
  R.C.,	
  Salonen,	
  J.,	
  &	
  Rubens,	
  N.	
  (2013)	
  Networks	
  of	
  innova'on	
  
rela'onships:	
  Mul'scopic	
  views	
  on	
  Finland,	
  in	
  Proceedings	
  of	
  the	
  XXIV	
  ISPIM	
  Conference	
  –	
  Innova'ng	
  in	
  
Global	
  Markets:	
  Challenges	
  for	
  Sustainable	
  Growth,	
  16-­‐19	
  June	
  2013,	
  Helsinki,	
  Finland,	
  p.	
  15.	
  
Descrip've	
  Metrics	
  
were identified (note: following the practices and guidelines related to privacy, in this
research we do not provide the names of individuals). Some actors were found to have
positions as key connecting nodes in more than one view, suggesting interlocking
relationships between the different levels. However, their roles were different.
Table 2 Descriptions of the multiscope of cumulative networks of case Finland
View Microscopic Mesoscopic Macroscopic Multiscope
Nodes 844 821 231 1698
Connections 883 824 186 1664
Network
description
Directed
relationships,
multimode
network
Directed
relationships,
multimode
network
Undirected
relationships, 1-
mode network
Directed and
undirected
relationships,
multimode
network
Network
metrics
density: 0.002
diameter: 15
density: 0.002
diameter: 18
density: 0.007
diameter: 4
density: 0.001
diameter: 16
Top 10
actors based
on
betweenness
centrality
Startup Sauna
Nokia
Ind-PK
SunyRide
Ind-KB
Ind-TT
Transfluent
Ind-JE
Ind-AK
Ind-VM
Nokia
Ind-PK
Ind-TT
Ind-JE
Applifier
Mendor
Finnish Industry
Investment
WOT Services
XIHA
Tinkercad
Nokia
Nokia Siemens
Networks
Wartsila
Metso
Kemira
Finnair
Microsoft
Outokumpu
Stora Enso
Ilmarinen
Nokia
Ind-PK
Startup Sauna
Ind-TT
WOT Services
SunyRide
Ind-JE
Mendor
Ind-AK
Ind-KB
Top 10
actors based
on degree
Nokia
Startup Sauna
Ind-AK
Ind-TL
Ind-TT
Holvi
Ind-PK
Ind-JE
Ind-KL
Ind-VM
Nokia
Blyk
Fruugo
Grand Cru
Rovio
Entertainment
XIHA
Flowdock
Finnish Industry
Investment
Sofanatics
Sulake
Nokia
Nokia Siemens
Networks
Wartsila
Finnair
Tabuk Cement
Alcatel Lucent
Telefonaktie–
bolaget LM
NEC
NTT Docomo
Zecon Bhd
Elematic
Fujitsu
Nokia
Startup Sauna
Ind-TL
Nokia Siemens
Networks
Ind-AK
Ind-TT
Grand Cru
Holvi
Blyk
Rovio
Entertainment


Huhtamäki,	
  J.,	
  Russell,	
  M.G.,	
  S'll,	
  K.,	
  and	
  Rubens,	
  N.	
  (2011)	
  A	
  Network-­‐Centric	
  Snapshot	
  of	
  
Value	
  Co-­‐Crea'on	
  in	
  Finnish	
  Innova'on	
  Financing,	
  Technology	
  Innova.on	
  Management	
  Review,	
  
hhp://'mreview.ca/ar'cle/424.	
  
Finnish	
  Innova'on	
  Ecosystem:	
  	
  
Rela'onal	
  networks	
  of	
  Finnish	
  companies	
  
including players from more traditional industries – Wartsila, Metso and Kemira –
indicates their connecting role both within Finland as well as globally. Interestingly,
Rovio Entertainment, which by many is still regarded more of a growth company than an
established company, is present in this view, due to its enterprise level relationships. Due
to the nature of the data, all of the actors in the top 10 based on betweenness are
companies, including Microsoft which is there due the its strategic alliance with Nokia.
Figure 2 Macroscopic view highlighting enterprise level relationships
The mesoscopic view highlighting growth companies (Figure 3) shows many Finnish
companies with relationships to 1-3 actors; it also introduces more complex, networked
relationships, showing a chain of nodes connecting key nodes. The key nodes that act as


Huhtamäki,	
  J.,	
  Russell,	
  M.G.,	
  S'll,	
  K.,	
  and	
  Rubens,	
  N.	
  (2011)	
  A	
  Network-­‐Centric	
  Snapshot	
  of	
  
Value	
  Co-­‐Crea'on	
  in	
  Finnish	
  Innova'on	
  Financing,	
  Technology	
  Innova.on	
  Management	
  Review,	
  
hhp://'mreview.ca/ar'cle/424.	
  
Finnish	
  Innova'on	
  Ecosystem:	
  
Rela'onal	
  networks	
  of	
  growth	
  companies	
  	
  
For Rovio Entertainment, this view indicates the connected individuals as well as
investors. Accordingly, three out of the top 10 actors based on betweenness are
individuals. However, as degree measures the number of connections, all top 10 actors
based on it are companies, including one financing organization.
Figure 3 Mesoscopic view of growth companies
The microscopic view highlighting startup companies (Figure 4) illustrates an intricate
web of connections within the Finnish ecosystem. In addition to start-ups, the key nodes
now include prominent individuals (in roles of founders, advisors and angels) as well as a
business incubator, Startup Sauna, reflecting this particular incubator’s role as active
advocate of start-up culture as well as home for start-ups, a place for building


Huhtamäki,	
  J.,	
  Russell,	
  M.G.,	
  S'll,	
  K.,	
  and	
  Rubens,	
  N.	
  (2011)	
  A	
  Network-­‐Centric	
  Snapshot	
  of	
  
Value	
  Co-­‐Crea'on	
  in	
  Finnish	
  Innova'on	
  Financing,	
  Technology	
  Innova.on	
  Management	
  Review,	
  
hhp://'mreview.ca/ar'cle/424.	
  
Finnish	
  Innova'on	
  Ecosystem:	
  
Rela'onal	
  networks	
  of	
  start-­‐ups	
  
Figure 4 Microscopic view of start-up companies
The aggregated network depicts an ecosystemic view of Finland (Figure 5) as it combines
the Finnish companies from the three separate datasets, and shows their direct
connections. Hence, for the first time, we can see in a single visualization the founders
and angels, executives and financing organizations, as well as companies from start-ups
to established enterprises. Overall, key actor of the ecosystem with the highest


Huhtamäki,	
  J.,	
  Russell,	
  M.G.,	
  SCll,	
  K.,	
  and	
  Rubens,	
  N.,	
  “A	
  User-­‐Centric,	
  Process-­‐Automated	
  Model	
  for	
  Data-­‐
Driven	
  Visual	
  Network	
  Analysis:	
  The	
  ExploraCon	
  -­‐	
  AutomaCon	
  Cycle,”	
  in	
  Matei,	
  S.,	
  BerCno,	
  E.,	
  and	
  Russell,	
  
M.G.,	
  Socio-­‐Computa,onal	
  Frameworks,	
  Tools	
  and	
  Algorithms	
  for	
  Suppor,ng	
  Transparent	
  Authorship	
  in	
  
Social	
  Media	
  Knowledge	
  Markets.	
  Springer.	
  Forthcoming.	
  
Data	
  From	
  Mul'ple	
  Sources	


Huhtamäki,	
  J.,	
  Russell,	
  M.G.,	
  SCll,	
  K.,	
  and	
  Rubens,	
  N.,	
  “A	
  User-­‐Centric,	
  Process-­‐Automated	
  Model	
  for	
  Data-­‐
Driven	
  Visual	
  Network	
  Analysis:	
  The	
  ExploraCon	
  -­‐	
  AutomaCon	
  Cycle,”	
  in	
  Matei,	
  S.,	
  BerCno,	
  E.,	
  and	
  Russell,	
  
M.G.,	
  Socio-­‐Computa,onal	
  Frameworks,	
  Tools	
  and	
  Algorithms	
  for	
  Suppor,ng	
  Transparent	
  Authorship	
  in	
  
Social	
  Media	
  Knowledge	
  Markets.	
  Springer.	
  Forthcoming.	
  
Os'nato	
  Model	
  
User-­‐centric	
  data-­‐driven	
  process	
  model	
  for	
  visual	
  analy'cs	
  
 Network	
  Metrics	
  for	
  Ecosystem	
  
Rela'onal	
  Capital	
  Indicators	
  	
  
Russell,	
  M.G.,	
  S'll,	
  K.,	
  Huhtamäki,	
  J.,	
  Rubens,	
  N.,	
  and	
  Basole,	
  R.C.	
  “Rela'onal	
  Capital	
  for	
  Shared	
  Vision	
  in	
  Innova'on	
  Ecosystems,”	
  in	
  Gebhardt,	
  
C.,	
  and	
  Meig,	
  H.A.	
  (Eds.),	
  Special	
  Issue:	
  The	
  Spa'al	
  Dimension	
  of	
  Innova'on:	
  Triple	
  Helix	
  and	
  the	
  City,	
  Triple	
  Helix	
  Journal,	
  Forthcoming.	


Enterprise	
  Level	
  Ecosystem	
  Visualiza'ons	
  
for	
  Three	
  Metropolitan	
  Areas	
  	
  
Russell,	
  M.G.,	
  S'll,	
  K.,	
  Huhtamäki,	
  J.,	
  and	
  Rubens,	
  N.,	
  and	
  Basole,	
  R.C.	
  “Rela'onal	
  Capital	
  for	
  
Shared	
  Vision	
  in	
  Innova'on	
  Ecosystems,”	
  in	
  Gebhardt,	
  C.,	
  and	
  Meig,	
  H.A.	
  (Eds.),	
  Special	
  Issue:	
  
The	
  Spa'al	
  Dimension	
  of	
  Innova'on:	
  Triple	
  Helix	
  and	
  the	
  City,	
  Triple	
  Helix	
  Journal,	
  Forthcoming.	


Growth	
  Level	
  Ecosystem	
  Visualiza'ons	
  for	
  
Three	
  Metropolitan	
  Areas	
  	
  
Russell,	
  M.G.,	
  S'll,	
  K.,	
  Huhtamäki,	
  J.,	
  and	
  Rubens,	
  N.,	
  and	
  Basole,	
  R.C.	
  “Rela'onal	
  Capital	
  for	
  
Shared	
  Vision	
  in	
  Innova'on	
  Ecosystems,”	
  in	
  Gebhardt,	
  C.,	
  and	
  Meig,	
  H.A.	
  (Eds.),	
  Special	
  Issue:	
  
The	
  Spa'al	
  Dimension	
  of	
  Innova'on:	
  Triple	
  Helix	
  and	
  the	
  City,	
  Triple	
  Helix	
  Journal,	
  Forthcoming.	


Startup	
  Level	
  Ecosystem	
  Visualiza'ons	
  for	
  
Three	
  Metropolitan	
  Areas	
  	
  
Russell,	
  M.G.,	
  S'll,	
  K.,	
  Huhtamäki,	
  J.,	
  and	
  Rubens,	
  N.,	
  and	
  Basole,	
  R.C.	
  	
  “Rela'onal	
  Capital	
  for	
  
Shared	
  Vision	
  in	
  Innova'on	
  Ecosystems,”	
  in	
  Gebhardt,	
  C.,	
  and	
  Meig,	
  H.A.	
  (Eds.),	
  Special	
  Issue:	
  
The	
  Spa'al	
  Dimension	
  of	
  Innova'on:	
  Triple	
  Helix	
  and	
  the	
  City,	
  Triple	
  Helix	
  Journal,	
  Forthcoming.	


Russell,	
  M.G.,	
  S'll,	
  K.,	
  Huhtamäki,	
  J.,	
  and	
  Rubens,	
  N.,	
  and	
  Basole,	
  R.C.	
  “Rela'onal	
  Capital	
  for	
  
Shared	
  Vision	
  in	
  Innova'on	
  Ecosystems,”	
  in	
  Gebhardt,	
  C.,	
  and	
  Meig,	
  H.A.	
  (Eds.),	
  Special	
  Issue:	
  
The	
  Spa'al	
  Dimension	
  of	
  Innova'on:	
  Triple	
  Helix	
  and	
  the	
  City,	
  Triple	
  Helix	
  Journal,	
  Forthcoming.	
  	
  
Comparing	
  Rela'onal	
  Capital	
  Metrics	
  
of	
  Innova'on	
  Ecosystems	


S'll,	
  K.,	
  Huhtamäki,	
  J.,	
  Russell,	
  M.G.,	
  and	
  Rubens,	
  N.	
  (2014)	
  “Insights	
  for	
  Orchestra'ng	
  
Innova'on	
  Ecosystems:	
  the	
  Cast	
  of	
  EIT	
  ICT	
  Labs	
  and	
  Data-­‐Driven	
  Network	
  Visualisa'ons,”	
  
Interna.onal	
  Journal	
  of	
  Technology	
  Management	
  66:2/3,	
  243-­‐265.	
  
EIT	
  	
  
ICT	
  Labs	


Cluster	
  
Ci'es	


S'll,	
  K.,	
  Huhtamäki,	
  J.,	
  Russell,	
  M.G.,	
  and	
  Rubens,	
  N.	
  (2014)	
  “Insights	
  for	
  Orchestra'ng	
  
Innova'on	
  Ecosystems:	
  the	
  Cast	
  of	
  EIT	
  ICT	
  Labs	
  and	
  Data-­‐Driven	
  Network	
  Visualisa'ons,”	
  
Interna.onal	
  Journal	
  of	
  Technology	
  Management	
  66:2/3,	
  243-­‐265.	
  
What	
  if	
  
SF	
  Bay	
  
Area	
  
would	
  
be	
  EIT	
  
ICT	
  Labs’	
  
Node	
  
#7?	
  
Homo	
  Narra've	
  
Sense-­‐Making	
  Mandate	
  
•  The	
  listener’s	
  
brain	
  
determines	
  
how	
  a	
  story	
  
is	
  heard	
  
•  Influence	
  by	
  
– framing	
  
– par'cipa'on	
  
Put	
  ME	
  in	
  the	
  Story	
  	
  
hhp://uphillwri'ng.org/wp-­‐content/uploads/2011/11/Reality-­‐Mirror.gif	
  
Sensemaking	
  and	
  Storytelling	
  
Agents
Events
Impact
Coalitions
Shared	
  
Vision	
  
Transforma'on	
  
Iterative
Alignment
Interact &
Feedback
Co-Create
Value
Through
Context,
Culture,
Capital
Shared Vision Transforms
Russell, M.G., Still, K., Huhtamäki, J., and Rubens, N., “Relational Capital for Shared Vision in Innovation Ecosystems,” in Gebhardt,
C., and Meig, H.A. (Eds.), Special Issue: The Spatial Dimension of Innovation: Triple Helix and the City, Triple Helix Journal,
Forthcoming.
In	
  Sum	
  
•  Our	
  results	
  demonstrate	
  that	
  network	
  visualiza'ons	
  can	
  be	
  
successfully	
  used	
  for	
  engaging	
  stakeholders	
  in	
  
understanding	
  and	
  orchestra'ng	
  innova'on	
  ecosystems,	
  by	
  
highligh'ng	
  the	
  roles	
  of	
  key	
  actors,	
  using	
  comparisons,	
  and	
  
by	
  exploring	
  the	
  what	
  if-­‐ques'ons.	


•  The	
  viability	
  of	
  the	
  user-­‐centric,	
  process-­‐automated	
  model	
  
for	
  data-­‐driven	
  visual	
  network	
  analysis	
  is	
  validated.	
  	
  
•  There	
  are	
  cri'cal	
  tradeoffs	
  between	
  explora'on	
  and	
  
automa'on	
  in	
  developing	
  sophis'cated	
  systems	
  designed	
  
for	
  the	
  par'cipa'on	
  of	
  both	
  low	
  and	
  high	
  tech-­‐savvy	
  
stakeholders.	
  	
  
Further	
  Informa'on	
  
Huhtamäki,	
  J.,	
  Russell,	
  M.G.,	
  SCll,	
  K.,	
  and	
  Rubens,	
  N.	
  (2011)	
  A	
  
Network-­‐Centric	
  Snapshot	
  of	
  Value	
  Co-­‐CreaCon	
  in	
  Finnish	
  
InnovaCon	
  Financing,	
  Technology	
  Innova,on	
  Management	
  
Review,	
  h^p://Cmreview.ca/arCcle/424.	
  
Huhtamäki,	
  J.,	
  Russell,	
  M.G.,	
  SCll,	
  K.,	
  and	
  Rubens,	
  N.,	
  “A	
  User-­‐
Centric,	
  Process-­‐Automated	
  Model	
  for	
  Data-­‐Driven	
  Visual	
  
Network	
  Analysis:	
  The	
  ExploraCon	
  -­‐	
  AutomaCon	
  Cycle,”	
  in	
  
Matei,	
  S.,	
  BerCno,	
  E.,	
  and	
  Russell,	
  M.G.,	
  Socio-­‐Computa,onal	
  
Frameworks,	
  Tools	
  and	
  Algorithms	
  for	
  Suppor,ng	
  Transparent	
  
Authorship	
  in	
  Social	
  Media	
  Knowledge	
  Markets.	
  Springer.	
  
Forthcoming.	
  
SCll,	
  K.,	
  Huhtamäki,	
  J.,	
  Russell,	
  M.G.,	
  and	
  Rubens,	
  N.	
  (2014)	
  
“Insights	
  for	
  OrchestraCng	
  InnovaCon	
  Ecosystems:	
  the	
  Cast	
  of	
  
EIT	
  ICT	
  Labs	
  and	
  Data-­‐Driven	
  Network	
  VisualisaCons,”	
  
Interna,onal	
  Journal	
  of	
  Technology	
  Management	
  66:2/3,	
  
243-­‐265.	
  
Russell,	
  M.G.,	
  SCll,	
  K.,	
  Huhtamäki,	
  J.,	
  and	
  Rubens,	
  N.,	
  
“RelaConal	
  Capital	
  for	
  Shared	
  Vision	
  in	
  InnovaCon	
  
Ecosystems,”	
  in	
  Gebhardt,	
  C.,	
  and	
  Meig,	
  H.A.	
  (Eds.),	
  Special	
  
Issue:	
  The	
  SpaCal	
  Dimension	
  of	
  InnovaCon:	
  Triple	
  Helix	
  and	
  
the	
  City,	
  Triple	
  Helix	
  Journal,	
  Forthcoming.	
  	
  
Basole,	
  R.	
  C.,	
  Russell,	
  M.	
  G.,	
  Huhtamäki,	
  J.,	
  Rubens,	
  N.,	
  S'll,	
  K.,	
  &	
  
Park,	
  H.	
  (2015).	
  Understanding	
  Business	
  Ecosystem	
  Dynamics:	
  A	
  
Data-­‐Driven	
  Approach.	
  ACM	
  Transac.ons	
  on	
  Management	
  
Informa.on	
  Systems	
  (TMIS),6(2),	
  6.	
  
Join	
  us	
  at	
  HICSS	
  2016	
  
hhp://ien.stanford.edu	


  Deadline	
  for	
  papers:	
  June	
  15,	
  2015	
  

Visualizing Transformative Networks in Innovation Ecosystems

  • 1.
    VISUALIZING  TRANSFORMATIVE  NETWORKS    IN  INNOVATION  ECOSYSTEMS     Innova'on  Ecosystem  Network         Interna'onal  Conference  on  Computa'onal  Social  Sciences   June  8,  2015   Martha  G  Russell  
  • 2.
    Co-­‐Authors   •  Martha  G  Russell     –  Stanford  University   •  Jukka  Huhtamäki     –  Tampere  Univ  of  Technology   •  Kaisa  SCll     –  VTT,  Finland   •  Neil  Rubens     –  Univ  of  Electro-­‐communica'ons   •  Jiafeng  Yu     –  VXPLO.com   •  Rahul  C.  Basole     –  Georgia  Ins'tute  of  Technology  
  • 3.
    Overview   •  Can  user-­‐centric,  process-­‐automated  model  for  data-­‐ driven  visual  network  analysis  be  validated  with   ground  truth?     •  What  are  the  tradeoffs  between  explora'on  and   automa'on  in  developing  systems  for  the  par'cipa'on   of  both  low  and  high  tech-­‐savvy  stakeholders?   •  Can  network  visualiza'ons  be  successfully  used  for   engaging  stakeholders  in  understanding  and   orchestra'ng  innova'on  ecosystems?      
  • 5.
        TransformaCon  of       InnovaCon  Ecosystems     InnovaCon  Ecosystems  refer  to  the  inter-­‐organiza'onal,  poli'cal,  economic,   environmental,  and  technological  systems  through  which  a  milieu  conducive   to  business  growth  is  catalyzed,  sustained,  and  supported.     A  dynamic  innova'on  ecosystem  is  characterized  by  a  con'nual  realignment   of  synergis'c  rela'onships  that  promote  growth  of  the  system.    In  agile   responsiveness  to  changing  internal  and  external  forces,  knowledge,  capital   and  other  vital  resources  flow  through  these  rela'onships.     Ecosystem  Transforma'ons  (Russell  et  al.,  2011)   EIT  ICT  Labs  Case  Study  (S'll  et  al.,  2014)   Symbio'c  rela'onships  to  create  and  deliver  products  and  services  (Basole  and  Rouse,  2008)     Synergis'c  realignment  (Rubens  et  al.,  2010)   Inventor  networks  (Powell  and  Giannella,  2009)     Interfirm  alliances  (Gula',  2009)  
  • 6.
    Agents Events Impact Coalitions Shared   Vision   Transforma'on   Iterative Alignment Interact & Feedback Co-Create Value Through Context, Culture, Capital Shared Vision Transforms Russell, M.G., Still, K., Huhtamäki, J., and Rubens, N., “Relational Capital for Shared Vision in Innovation Ecosystems,” in Gebhardt, C., and Meig, H.A. (Eds.), Special Issue: The Spatial Dimension of Innovation: Triple Helix and the City, Triple Helix Journal, Forthcoming.
  • 7.
                                                S'll,  K.,  Huhtamäki,  J.,  Russell,  M.G.,  Basole,  R.C.,  Salonen,  J.,  &  Rubens,  N.  (2013)  Networks  of  innova'on   rela'onships:  Mul'scopic  views  on  Finland,  in  Proceedings  of  the  XXIV  ISPIM  Conference  –  Innova'ng  in   Global  Markets:  Challenges  for  Sustainable  Growth,  16-­‐19  June  2013,  Helsinki,  Finland,  p.  15.   Descrip've  Metrics   were identified (note: following the practices and guidelines related to privacy, in this research we do not provide the names of individuals). Some actors were found to have positions as key connecting nodes in more than one view, suggesting interlocking relationships between the different levels. However, their roles were different. Table 2 Descriptions of the multiscope of cumulative networks of case Finland View Microscopic Mesoscopic Macroscopic Multiscope Nodes 844 821 231 1698 Connections 883 824 186 1664 Network description Directed relationships, multimode network Directed relationships, multimode network Undirected relationships, 1- mode network Directed and undirected relationships, multimode network Network metrics density: 0.002 diameter: 15 density: 0.002 diameter: 18 density: 0.007 diameter: 4 density: 0.001 diameter: 16 Top 10 actors based on betweenness centrality Startup Sauna Nokia Ind-PK SunyRide Ind-KB Ind-TT Transfluent Ind-JE Ind-AK Ind-VM Nokia Ind-PK Ind-TT Ind-JE Applifier Mendor Finnish Industry Investment WOT Services XIHA Tinkercad Nokia Nokia Siemens Networks Wartsila Metso Kemira Finnair Microsoft Outokumpu Stora Enso Ilmarinen Nokia Ind-PK Startup Sauna Ind-TT WOT Services SunyRide Ind-JE Mendor Ind-AK Ind-KB Top 10 actors based on degree Nokia Startup Sauna Ind-AK Ind-TL Ind-TT Holvi Ind-PK Ind-JE Ind-KL Ind-VM Nokia Blyk Fruugo Grand Cru Rovio Entertainment XIHA Flowdock Finnish Industry Investment Sofanatics Sulake Nokia Nokia Siemens Networks Wartsila Finnair Tabuk Cement Alcatel Lucent Telefonaktie– bolaget LM NEC NTT Docomo Zecon Bhd Elematic Fujitsu Nokia Startup Sauna Ind-TL Nokia Siemens Networks Ind-AK Ind-TT Grand Cru Holvi Blyk Rovio Entertainment
  • 8.
                                                Huhtamäki,  J.,  Russell,  M.G.,  S'll,  K.,  and  Rubens,  N.  (2011)  A  Network-­‐Centric  Snapshot  of   Value  Co-­‐Crea'on  in  Finnish  Innova'on  Financing,  Technology  Innova.on  Management  Review,   hhp://'mreview.ca/ar'cle/424.   Finnish  Innova'on  Ecosystem:     Rela'onal  networks  of  Finnish  companies   including players from more traditional industries – Wartsila, Metso and Kemira – indicates their connecting role both within Finland as well as globally. Interestingly, Rovio Entertainment, which by many is still regarded more of a growth company than an established company, is present in this view, due to its enterprise level relationships. Due to the nature of the data, all of the actors in the top 10 based on betweenness are companies, including Microsoft which is there due the its strategic alliance with Nokia. Figure 2 Macroscopic view highlighting enterprise level relationships The mesoscopic view highlighting growth companies (Figure 3) shows many Finnish companies with relationships to 1-3 actors; it also introduces more complex, networked relationships, showing a chain of nodes connecting key nodes. The key nodes that act as
  • 9.
                                                Huhtamäki,  J.,  Russell,  M.G.,  S'll,  K.,  and  Rubens,  N.  (2011)  A  Network-­‐Centric  Snapshot  of   Value  Co-­‐Crea'on  in  Finnish  Innova'on  Financing,  Technology  Innova.on  Management  Review,   hhp://'mreview.ca/ar'cle/424.   Finnish  Innova'on  Ecosystem:   Rela'onal  networks  of  growth  companies     For Rovio Entertainment, this view indicates the connected individuals as well as investors. Accordingly, three out of the top 10 actors based on betweenness are individuals. However, as degree measures the number of connections, all top 10 actors based on it are companies, including one financing organization. Figure 3 Mesoscopic view of growth companies The microscopic view highlighting startup companies (Figure 4) illustrates an intricate web of connections within the Finnish ecosystem. In addition to start-ups, the key nodes now include prominent individuals (in roles of founders, advisors and angels) as well as a business incubator, Startup Sauna, reflecting this particular incubator’s role as active advocate of start-up culture as well as home for start-ups, a place for building
  • 10.
                                                Huhtamäki,  J.,  Russell,  M.G.,  S'll,  K.,  and  Rubens,  N.  (2011)  A  Network-­‐Centric  Snapshot  of   Value  Co-­‐Crea'on  in  Finnish  Innova'on  Financing,  Technology  Innova.on  Management  Review,   hhp://'mreview.ca/ar'cle/424.   Finnish  Innova'on  Ecosystem:   Rela'onal  networks  of  start-­‐ups   Figure 4 Microscopic view of start-up companies The aggregated network depicts an ecosystemic view of Finland (Figure 5) as it combines the Finnish companies from the three separate datasets, and shows their direct connections. Hence, for the first time, we can see in a single visualization the founders and angels, executives and financing organizations, as well as companies from start-ups to established enterprises. Overall, key actor of the ecosystem with the highest
  • 11.
                                              Huhtamäki,  J.,  Russell,  M.G.,  SCll,  K.,  and  Rubens,  N.,  “A  User-­‐Centric,  Process-­‐Automated  Model  for  Data-­‐ Driven  Visual  Network  Analysis:  The  ExploraCon  -­‐  AutomaCon  Cycle,”  in  Matei,  S.,  BerCno,  E.,  and  Russell,   M.G.,  Socio-­‐Computa,onal  Frameworks,  Tools  and  Algorithms  for  Suppor,ng  Transparent  Authorship  in   Social  Media  Knowledge  Markets.  Springer.  Forthcoming.   Data  From  Mul'ple  Sources  
  • 12.
                                              Huhtamäki,  J.,  Russell,  M.G.,  SCll,  K.,  and  Rubens,  N.,  “A  User-­‐Centric,  Process-­‐Automated  Model  for  Data-­‐ Driven  Visual  Network  Analysis:  The  ExploraCon  -­‐  AutomaCon  Cycle,”  in  Matei,  S.,  BerCno,  E.,  and  Russell,   M.G.,  Socio-­‐Computa,onal  Frameworks,  Tools  and  Algorithms  for  Suppor,ng  Transparent  Authorship  in   Social  Media  Knowledge  Markets.  Springer.  Forthcoming.   Os'nato  Model   User-­‐centric  data-­‐driven  process  model  for  visual  analy'cs  
  • 13.
     Network  Metrics  for  Ecosystem   Rela'onal  Capital  Indicators     Russell,  M.G.,  S'll,  K.,  Huhtamäki,  J.,  Rubens,  N.,  and  Basole,  R.C.  “Rela'onal  Capital  for  Shared  Vision  in  Innova'on  Ecosystems,”  in  Gebhardt,   C.,  and  Meig,  H.A.  (Eds.),  Special  Issue:  The  Spa'al  Dimension  of  Innova'on:  Triple  Helix  and  the  City,  Triple  Helix  Journal,  Forthcoming.    
  • 14.
                                          Enterprise  Level  Ecosystem  Visualiza'ons   for  Three  Metropolitan  Areas     Russell,  M.G.,  S'll,  K.,  Huhtamäki,  J.,  and  Rubens,  N.,  and  Basole,  R.C.  “Rela'onal  Capital  for   Shared  Vision  in  Innova'on  Ecosystems,”  in  Gebhardt,  C.,  and  Meig,  H.A.  (Eds.),  Special  Issue:   The  Spa'al  Dimension  of  Innova'on:  Triple  Helix  and  the  City,  Triple  Helix  Journal,  Forthcoming.    
  • 15.
                                          Growth  Level  Ecosystem  Visualiza'ons  for   Three  Metropolitan  Areas     Russell,  M.G.,  S'll,  K.,  Huhtamäki,  J.,  and  Rubens,  N.,  and  Basole,  R.C.  “Rela'onal  Capital  for   Shared  Vision  in  Innova'on  Ecosystems,”  in  Gebhardt,  C.,  and  Meig,  H.A.  (Eds.),  Special  Issue:   The  Spa'al  Dimension  of  Innova'on:  Triple  Helix  and  the  City,  Triple  Helix  Journal,  Forthcoming.    
  • 16.
                                          Startup  Level  Ecosystem  Visualiza'ons  for   Three  Metropolitan  Areas     Russell,  M.G.,  S'll,  K.,  Huhtamäki,  J.,  and  Rubens,  N.,  and  Basole,  R.C.    “Rela'onal  Capital  for   Shared  Vision  in  Innova'on  Ecosystems,”  in  Gebhardt,  C.,  and  Meig,  H.A.  (Eds.),  Special  Issue:   The  Spa'al  Dimension  of  Innova'on:  Triple  Helix  and  the  City,  Triple  Helix  Journal,  Forthcoming.    
  • 17.
                                                Russell,  M.G.,  S'll,  K.,  Huhtamäki,  J.,  and  Rubens,  N.,  and  Basole,  R.C.  “Rela'onal  Capital  for   Shared  Vision  in  Innova'on  Ecosystems,”  in  Gebhardt,  C.,  and  Meig,  H.A.  (Eds.),  Special  Issue:   The  Spa'al  Dimension  of  Innova'on:  Triple  Helix  and  the  City,  Triple  Helix  Journal,  Forthcoming.     Comparing  Rela'onal  Capital  Metrics   of  Innova'on  Ecosystems    
  • 18.
                                                S'll,  K.,  Huhtamäki,  J.,  Russell,  M.G.,  and  Rubens,  N.  (2014)  “Insights  for  Orchestra'ng   Innova'on  Ecosystems:  the  Cast  of  EIT  ICT  Labs  and  Data-­‐Driven  Network  Visualisa'ons,”   Interna.onal  Journal  of  Technology  Management  66:2/3,  243-­‐265.   EIT     ICT  Labs     Cluster   Ci'es  
  • 19.
                                                S'll,  K.,  Huhtamäki,  J.,  Russell,  M.G.,  and  Rubens,  N.  (2014)  “Insights  for  Orchestra'ng   Innova'on  Ecosystems:  the  Cast  of  EIT  ICT  Labs  and  Data-­‐Driven  Network  Visualisa'ons,”   Interna.onal  Journal  of  Technology  Management  66:2/3,  243-­‐265.   What  if   SF  Bay   Area   would   be  EIT   ICT  Labs’   Node   #7?  
  • 20.
  • 22.
    •  The  listener’s   brain   determines   how  a  story   is  heard   •  Influence  by   – framing   – par'cipa'on   Put  ME  in  the  Story     hhp://uphillwri'ng.org/wp-­‐content/uploads/2011/11/Reality-­‐Mirror.gif   Sensemaking  and  Storytelling  
  • 23.
    Agents Events Impact Coalitions Shared   Vision   Transforma'on   Iterative Alignment Interact & Feedback Co-Create Value Through Context, Culture, Capital Shared Vision Transforms Russell, M.G., Still, K., Huhtamäki, J., and Rubens, N., “Relational Capital for Shared Vision in Innovation Ecosystems,” in Gebhardt, C., and Meig, H.A. (Eds.), Special Issue: The Spatial Dimension of Innovation: Triple Helix and the City, Triple Helix Journal, Forthcoming.
  • 24.
    In  Sum   • Our  results  demonstrate  that  network  visualiza'ons  can  be   successfully  used  for  engaging  stakeholders  in   understanding  and  orchestra'ng  innova'on  ecosystems,  by   highligh'ng  the  roles  of  key  actors,  using  comparisons,  and   by  exploring  the  what  if-­‐ques'ons.         •  The  viability  of  the  user-­‐centric,  process-­‐automated  model   for  data-­‐driven  visual  network  analysis  is  validated.     •  There  are  cri'cal  tradeoffs  between  explora'on  and   automa'on  in  developing  sophis'cated  systems  designed   for  the  par'cipa'on  of  both  low  and  high  tech-­‐savvy   stakeholders.    
  • 25.
    Further  Informa'on   Huhtamäki,  J.,  Russell,  M.G.,  SCll,  K.,  and  Rubens,  N.  (2011)  A   Network-­‐Centric  Snapshot  of  Value  Co-­‐CreaCon  in  Finnish   InnovaCon  Financing,  Technology  Innova,on  Management   Review,  h^p://Cmreview.ca/arCcle/424.   Huhtamäki,  J.,  Russell,  M.G.,  SCll,  K.,  and  Rubens,  N.,  “A  User-­‐ Centric,  Process-­‐Automated  Model  for  Data-­‐Driven  Visual   Network  Analysis:  The  ExploraCon  -­‐  AutomaCon  Cycle,”  in   Matei,  S.,  BerCno,  E.,  and  Russell,  M.G.,  Socio-­‐Computa,onal   Frameworks,  Tools  and  Algorithms  for  Suppor,ng  Transparent   Authorship  in  Social  Media  Knowledge  Markets.  Springer.   Forthcoming.   SCll,  K.,  Huhtamäki,  J.,  Russell,  M.G.,  and  Rubens,  N.  (2014)   “Insights  for  OrchestraCng  InnovaCon  Ecosystems:  the  Cast  of   EIT  ICT  Labs  and  Data-­‐Driven  Network  VisualisaCons,”   Interna,onal  Journal  of  Technology  Management  66:2/3,   243-­‐265.   Russell,  M.G.,  SCll,  K.,  Huhtamäki,  J.,  and  Rubens,  N.,   “RelaConal  Capital  for  Shared  Vision  in  InnovaCon   Ecosystems,”  in  Gebhardt,  C.,  and  Meig,  H.A.  (Eds.),  Special   Issue:  The  SpaCal  Dimension  of  InnovaCon:  Triple  Helix  and   the  City,  Triple  Helix  Journal,  Forthcoming.     Basole,  R.  C.,  Russell,  M.  G.,  Huhtamäki,  J.,  Rubens,  N.,  S'll,  K.,  &   Park,  H.  (2015).  Understanding  Business  Ecosystem  Dynamics:  A   Data-­‐Driven  Approach.  ACM  Transac.ons  on  Management   Informa.on  Systems  (TMIS),6(2),  6.  
  • 26.
    Join  us  at  HICSS  2016   hhp://ien.stanford.edu        Deadline  for  papers:  June  15,  2015