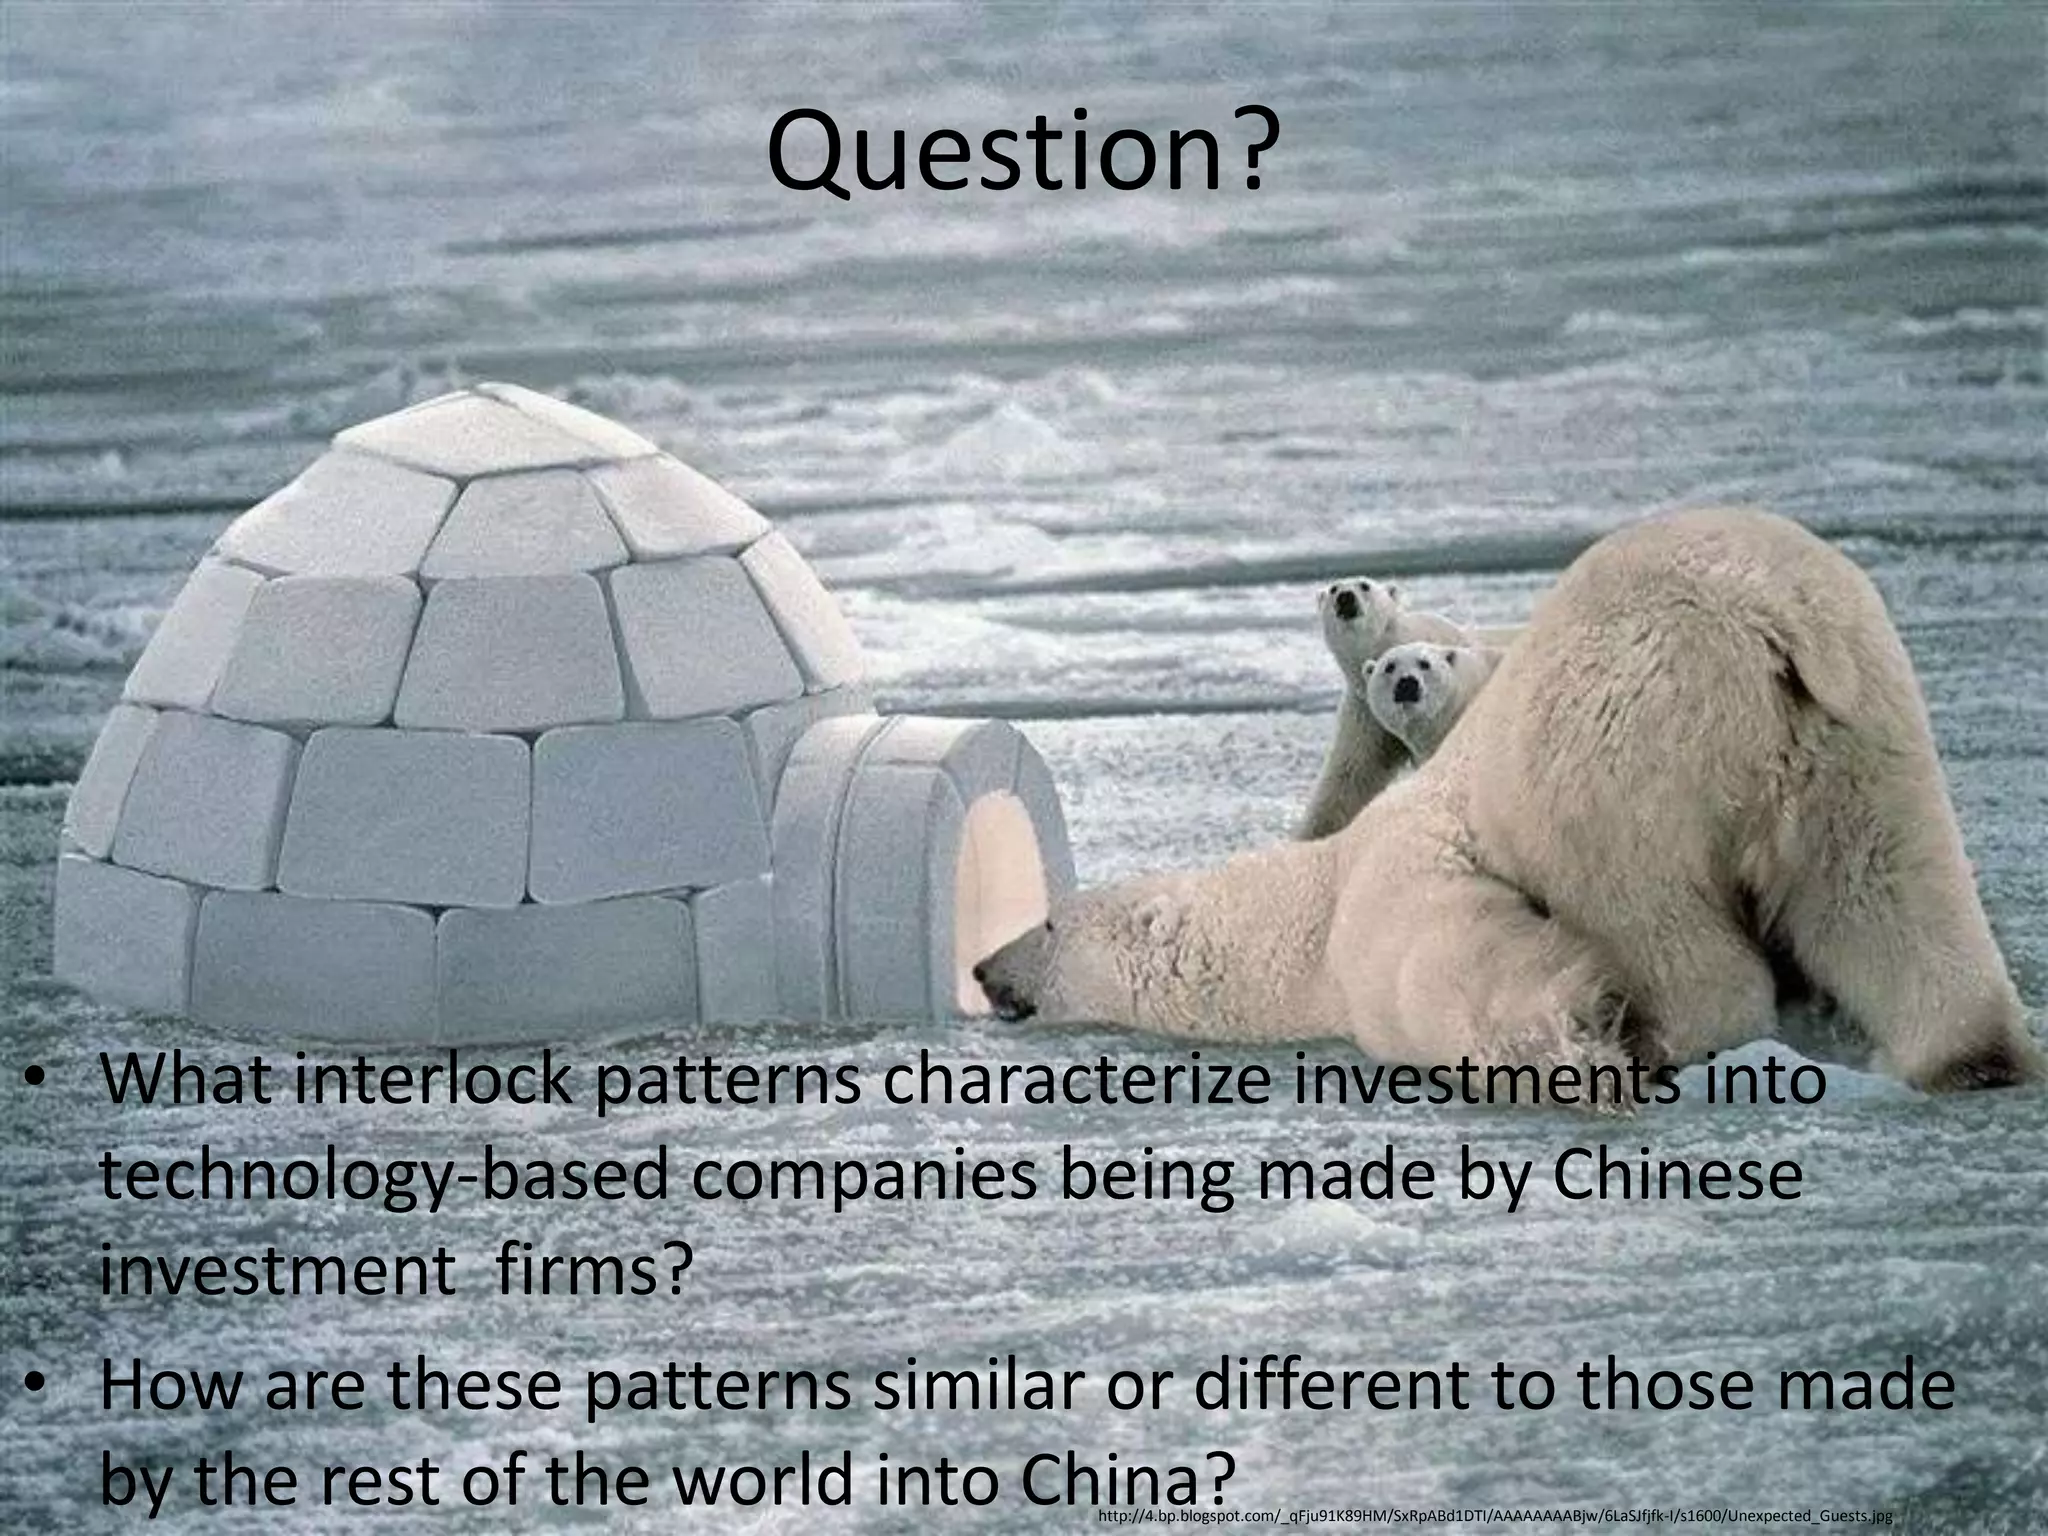
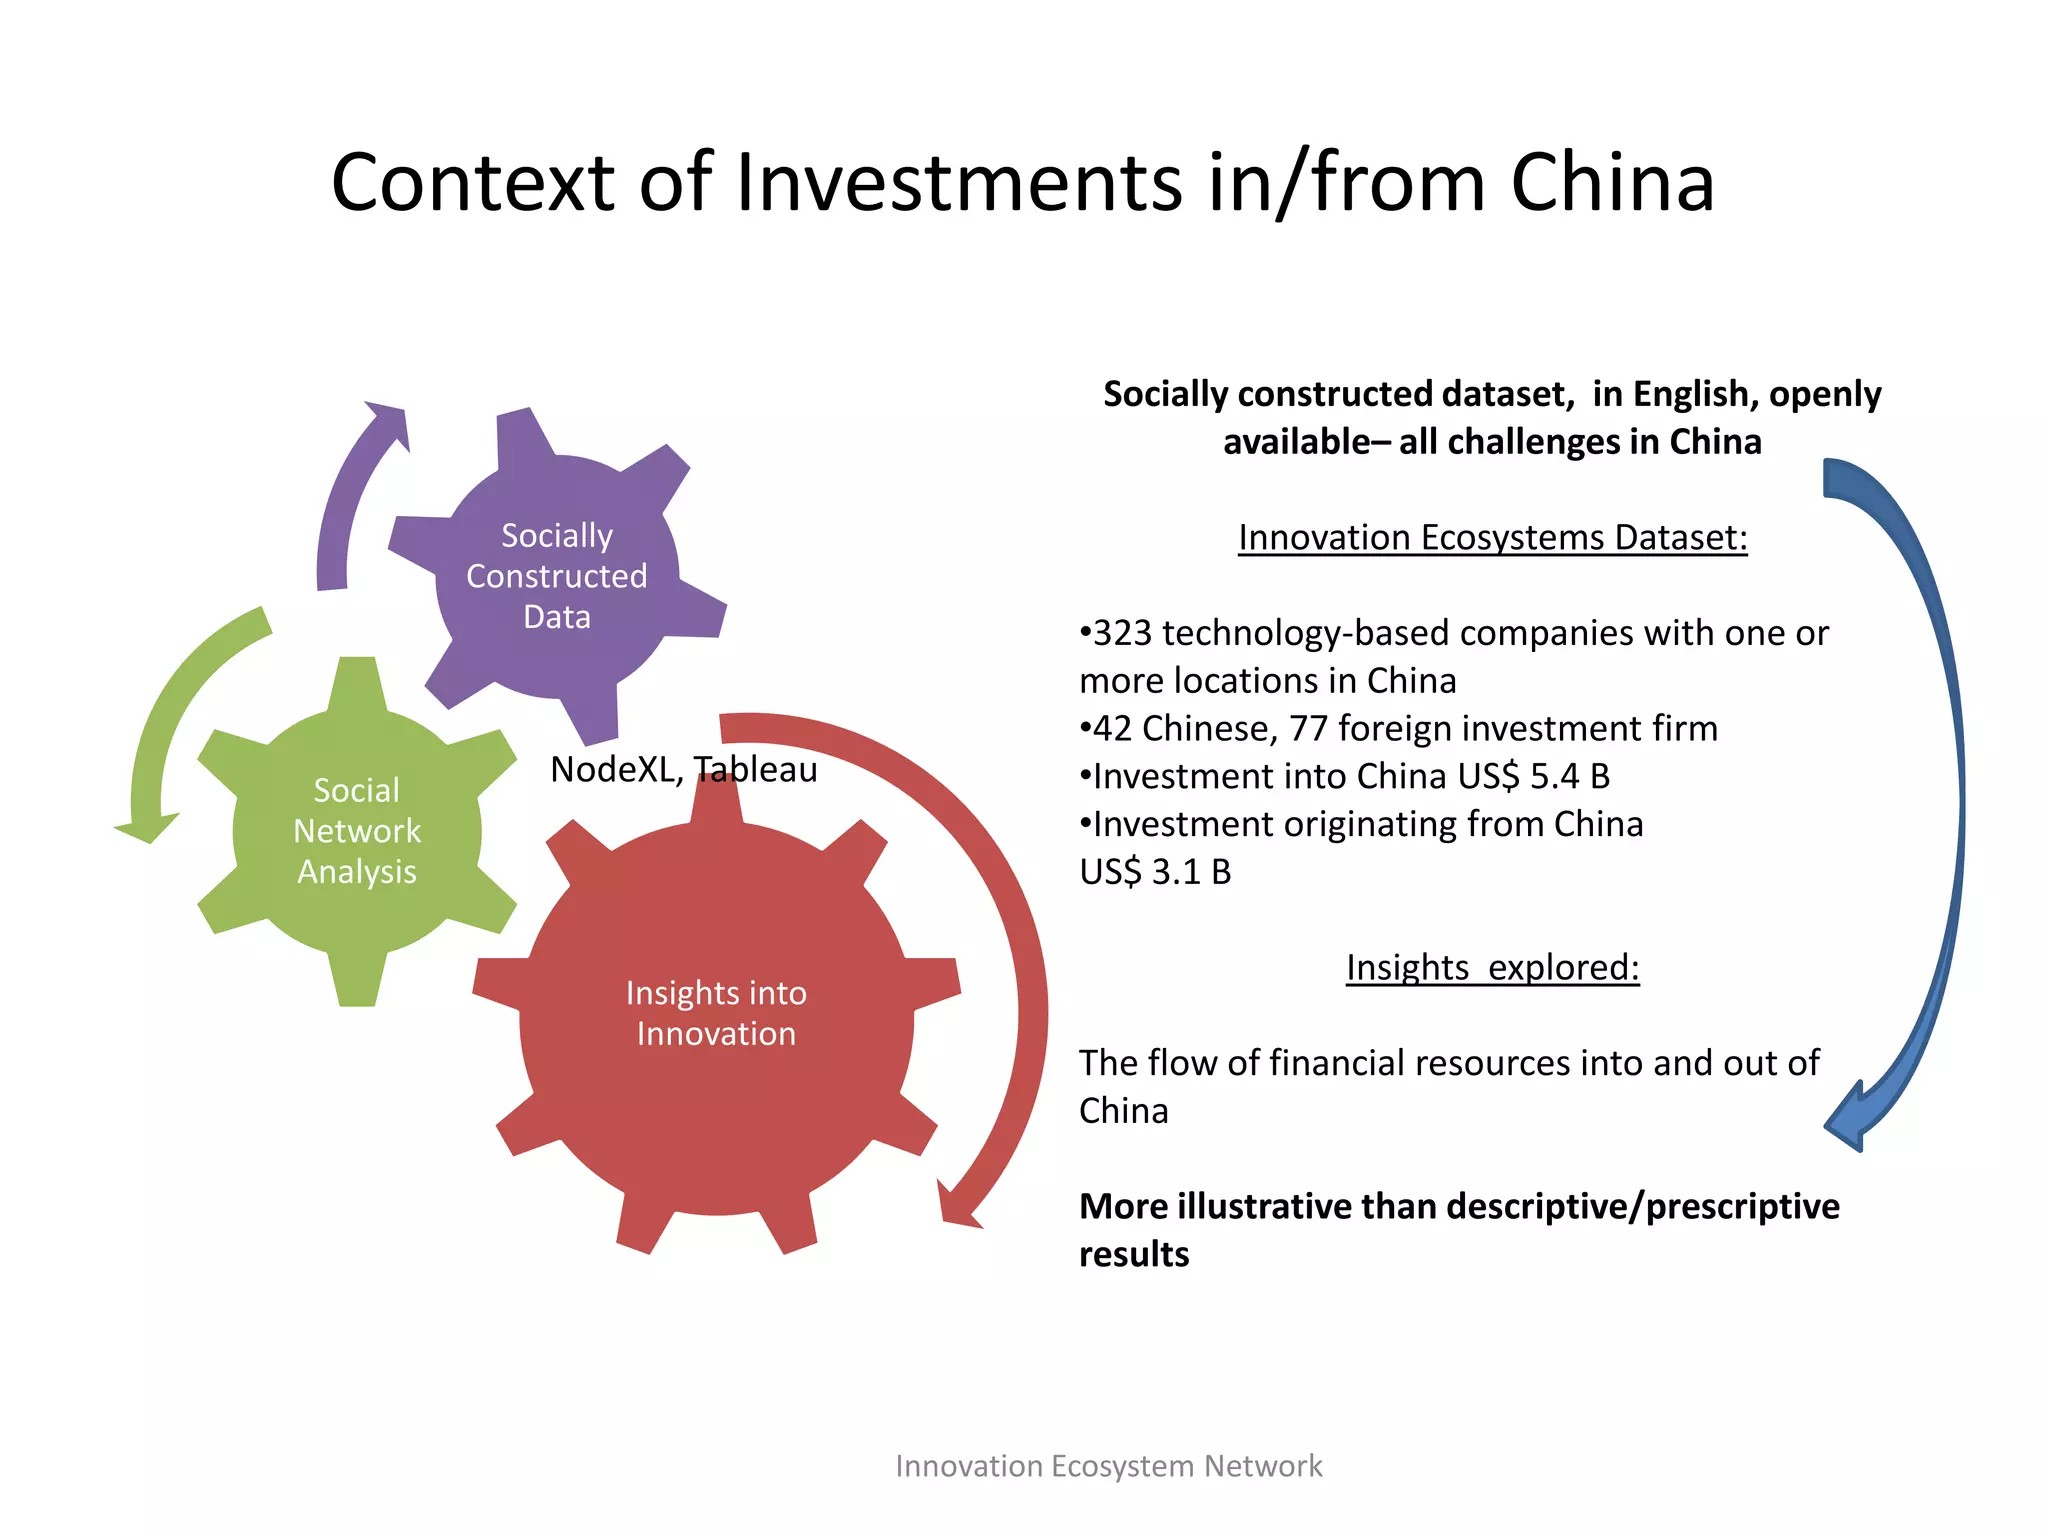
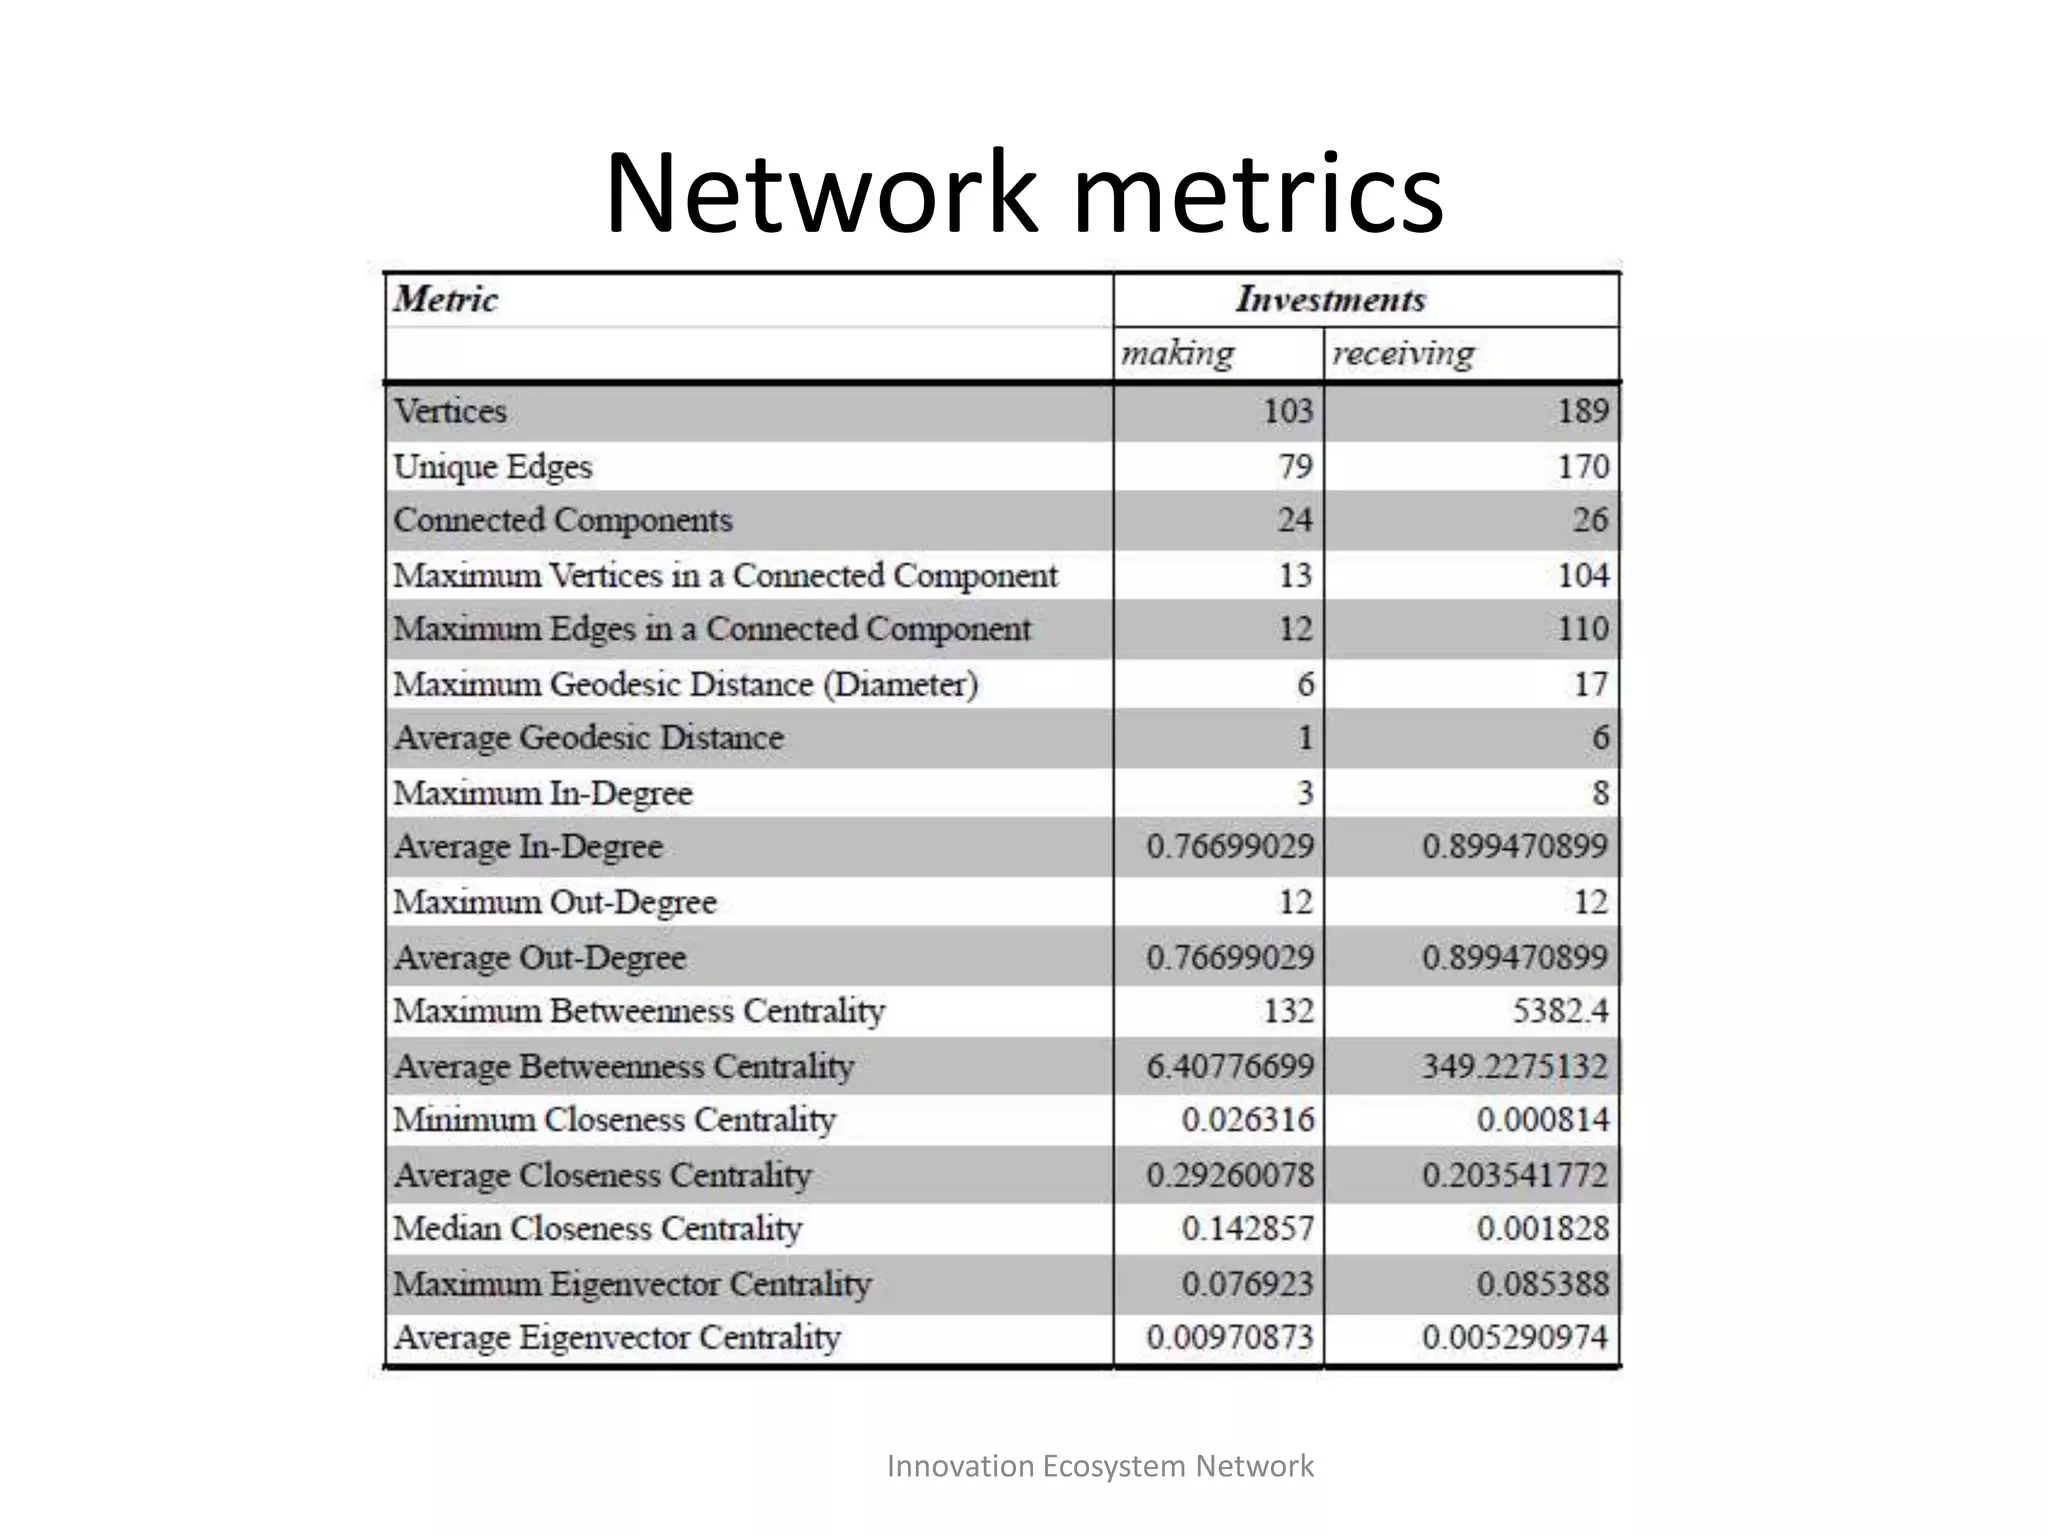
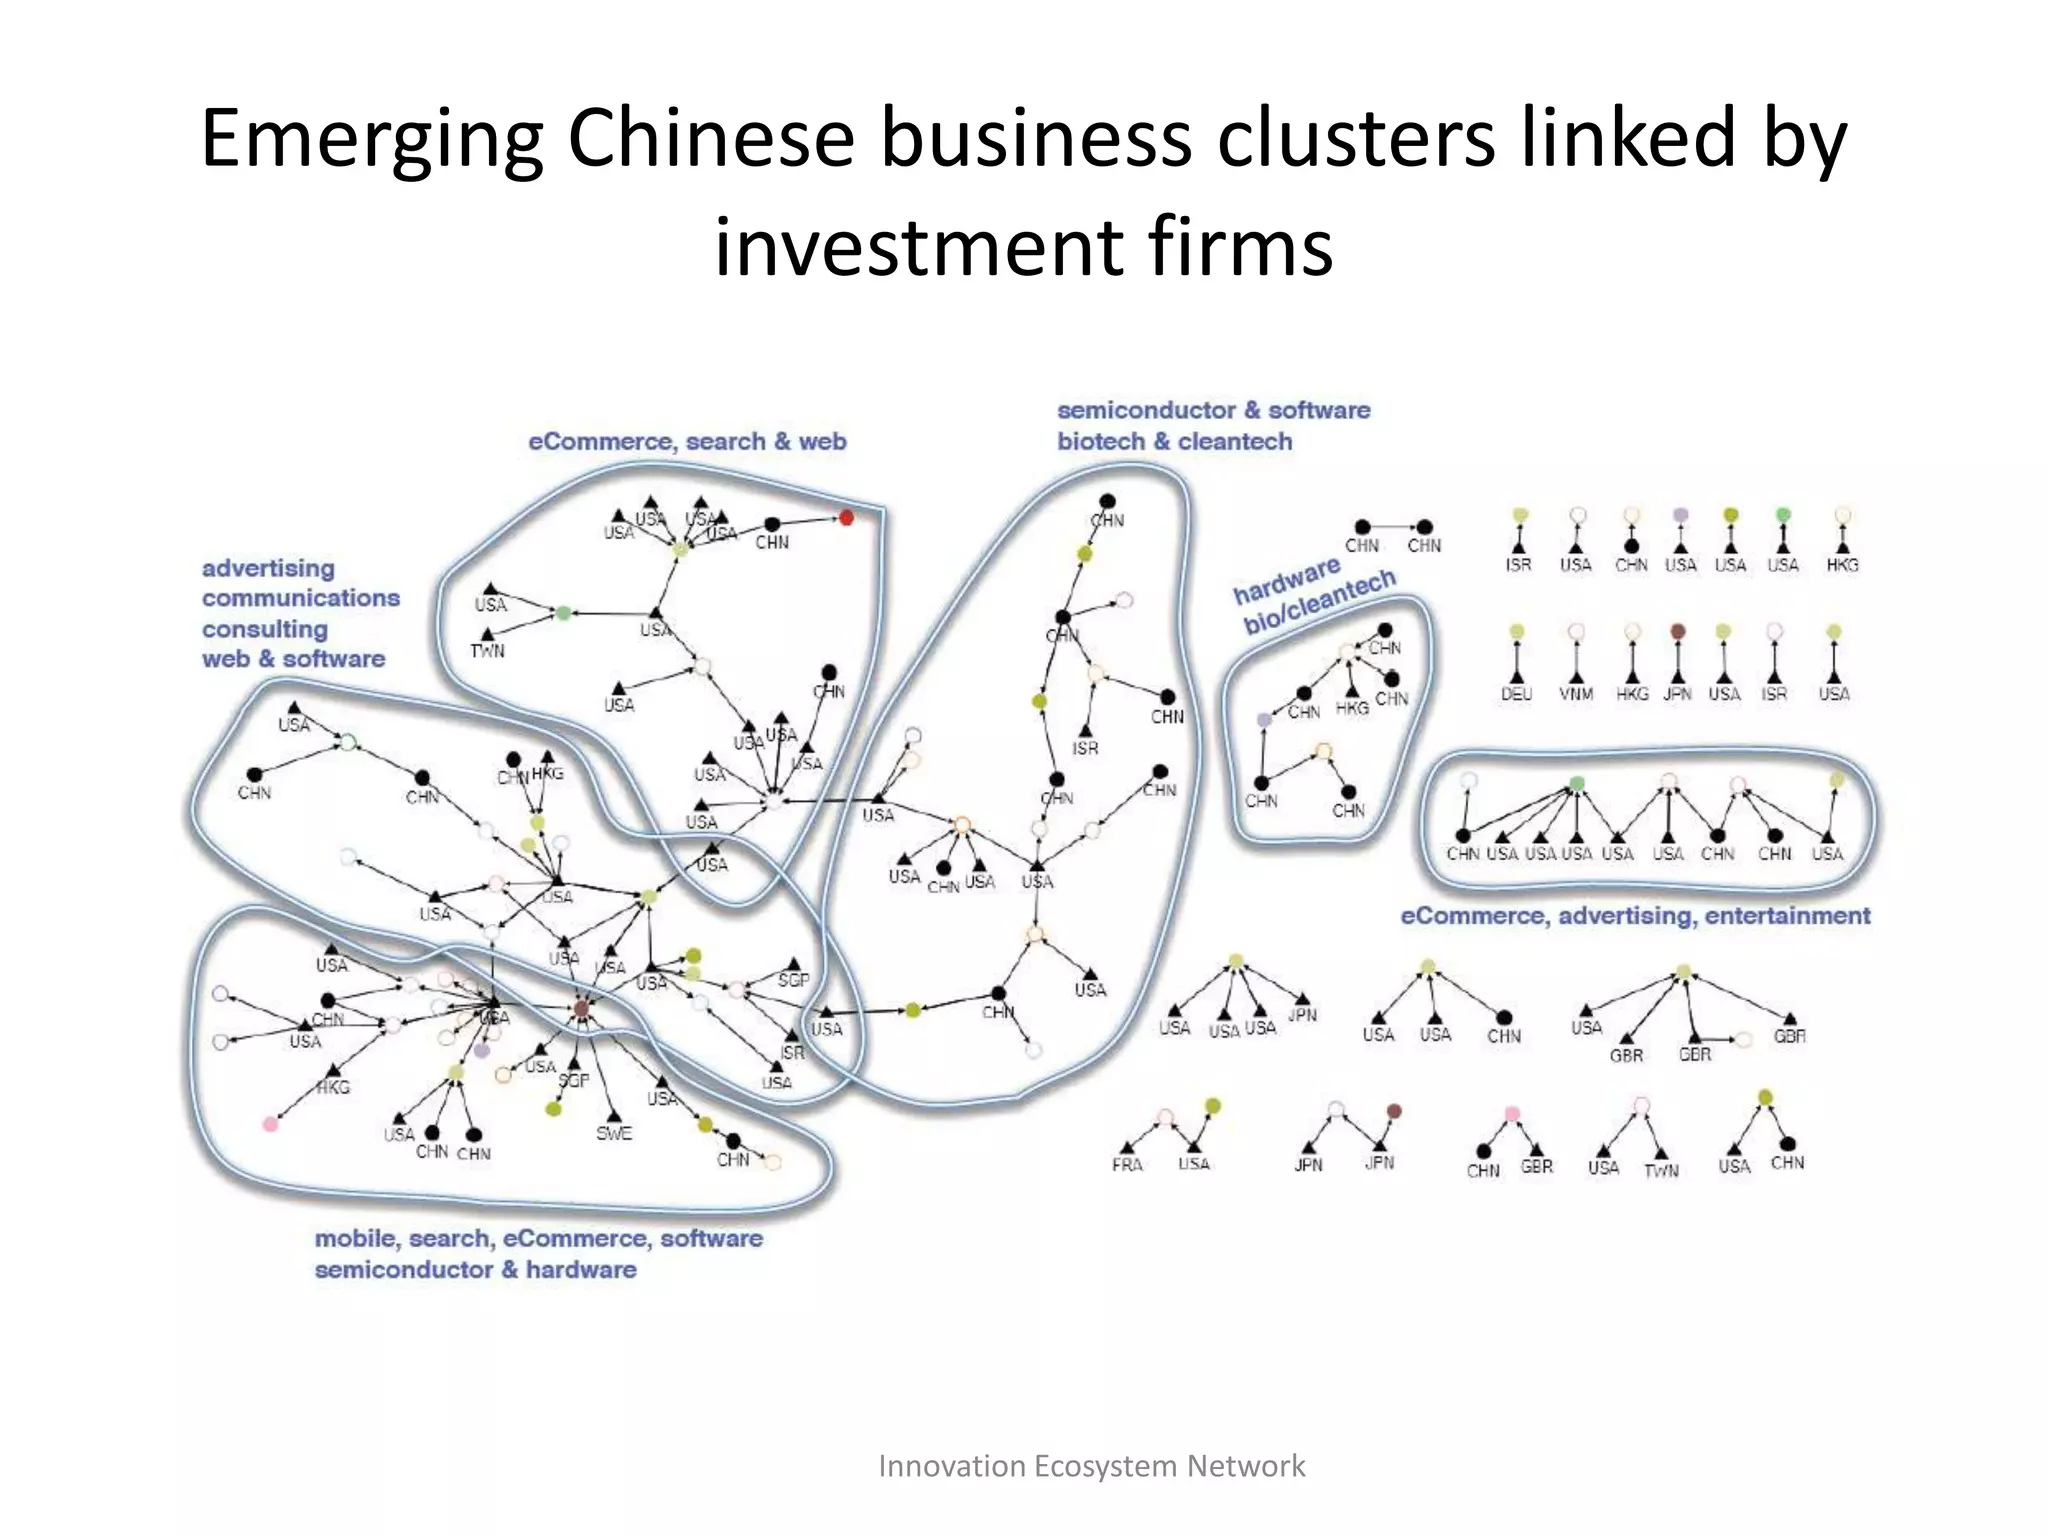
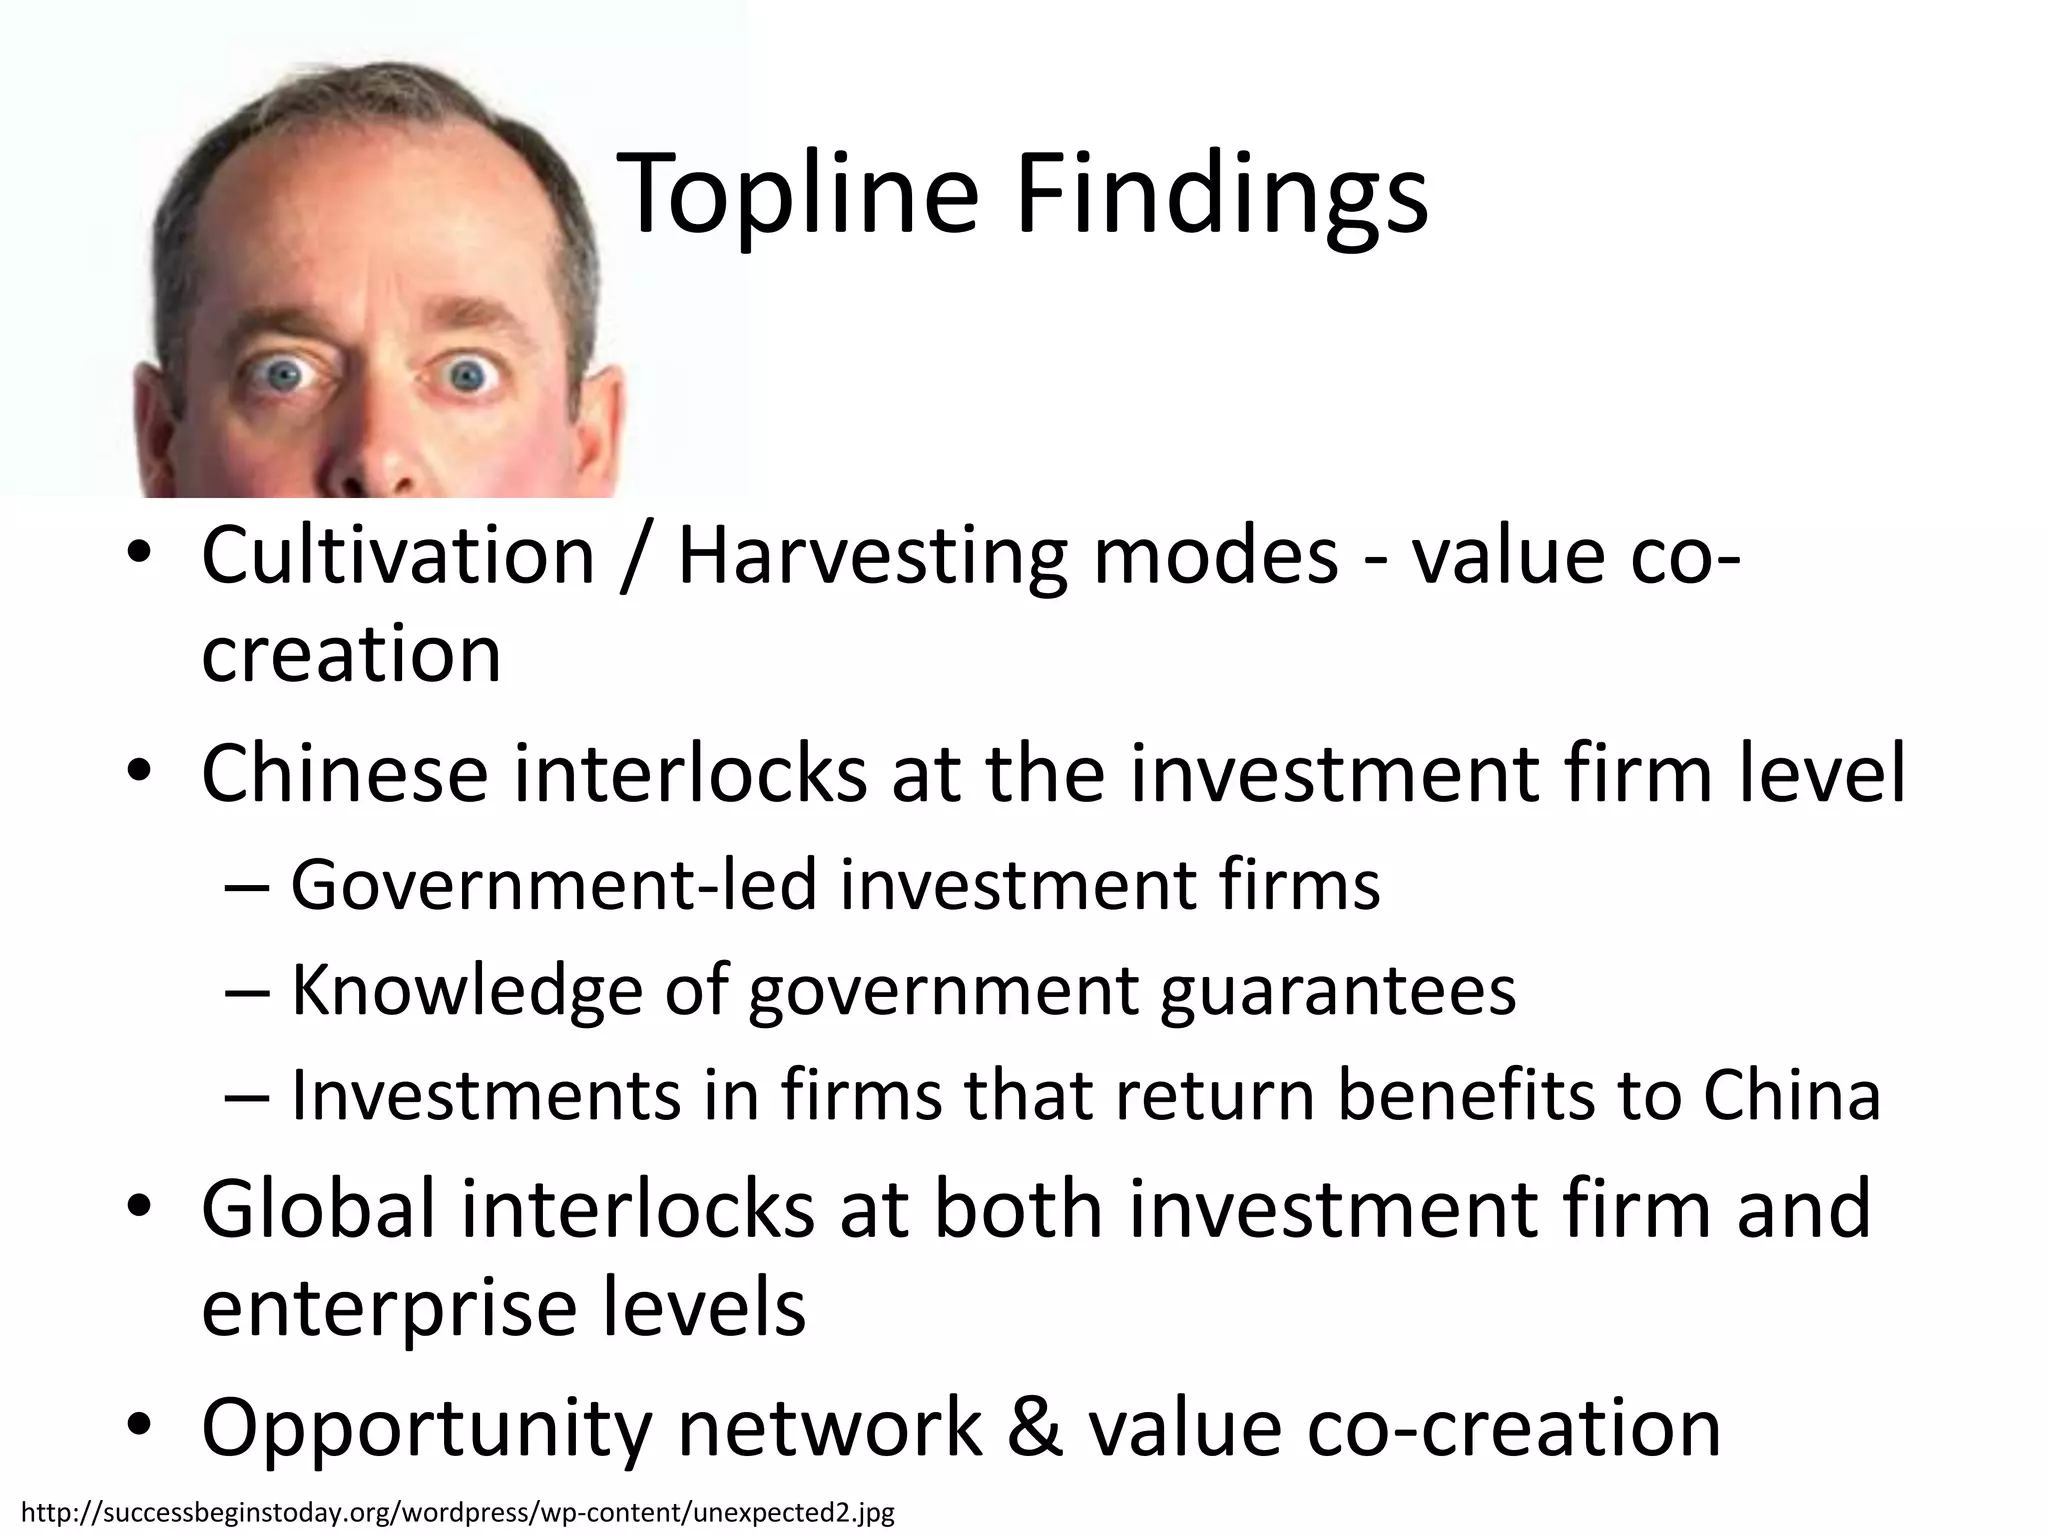
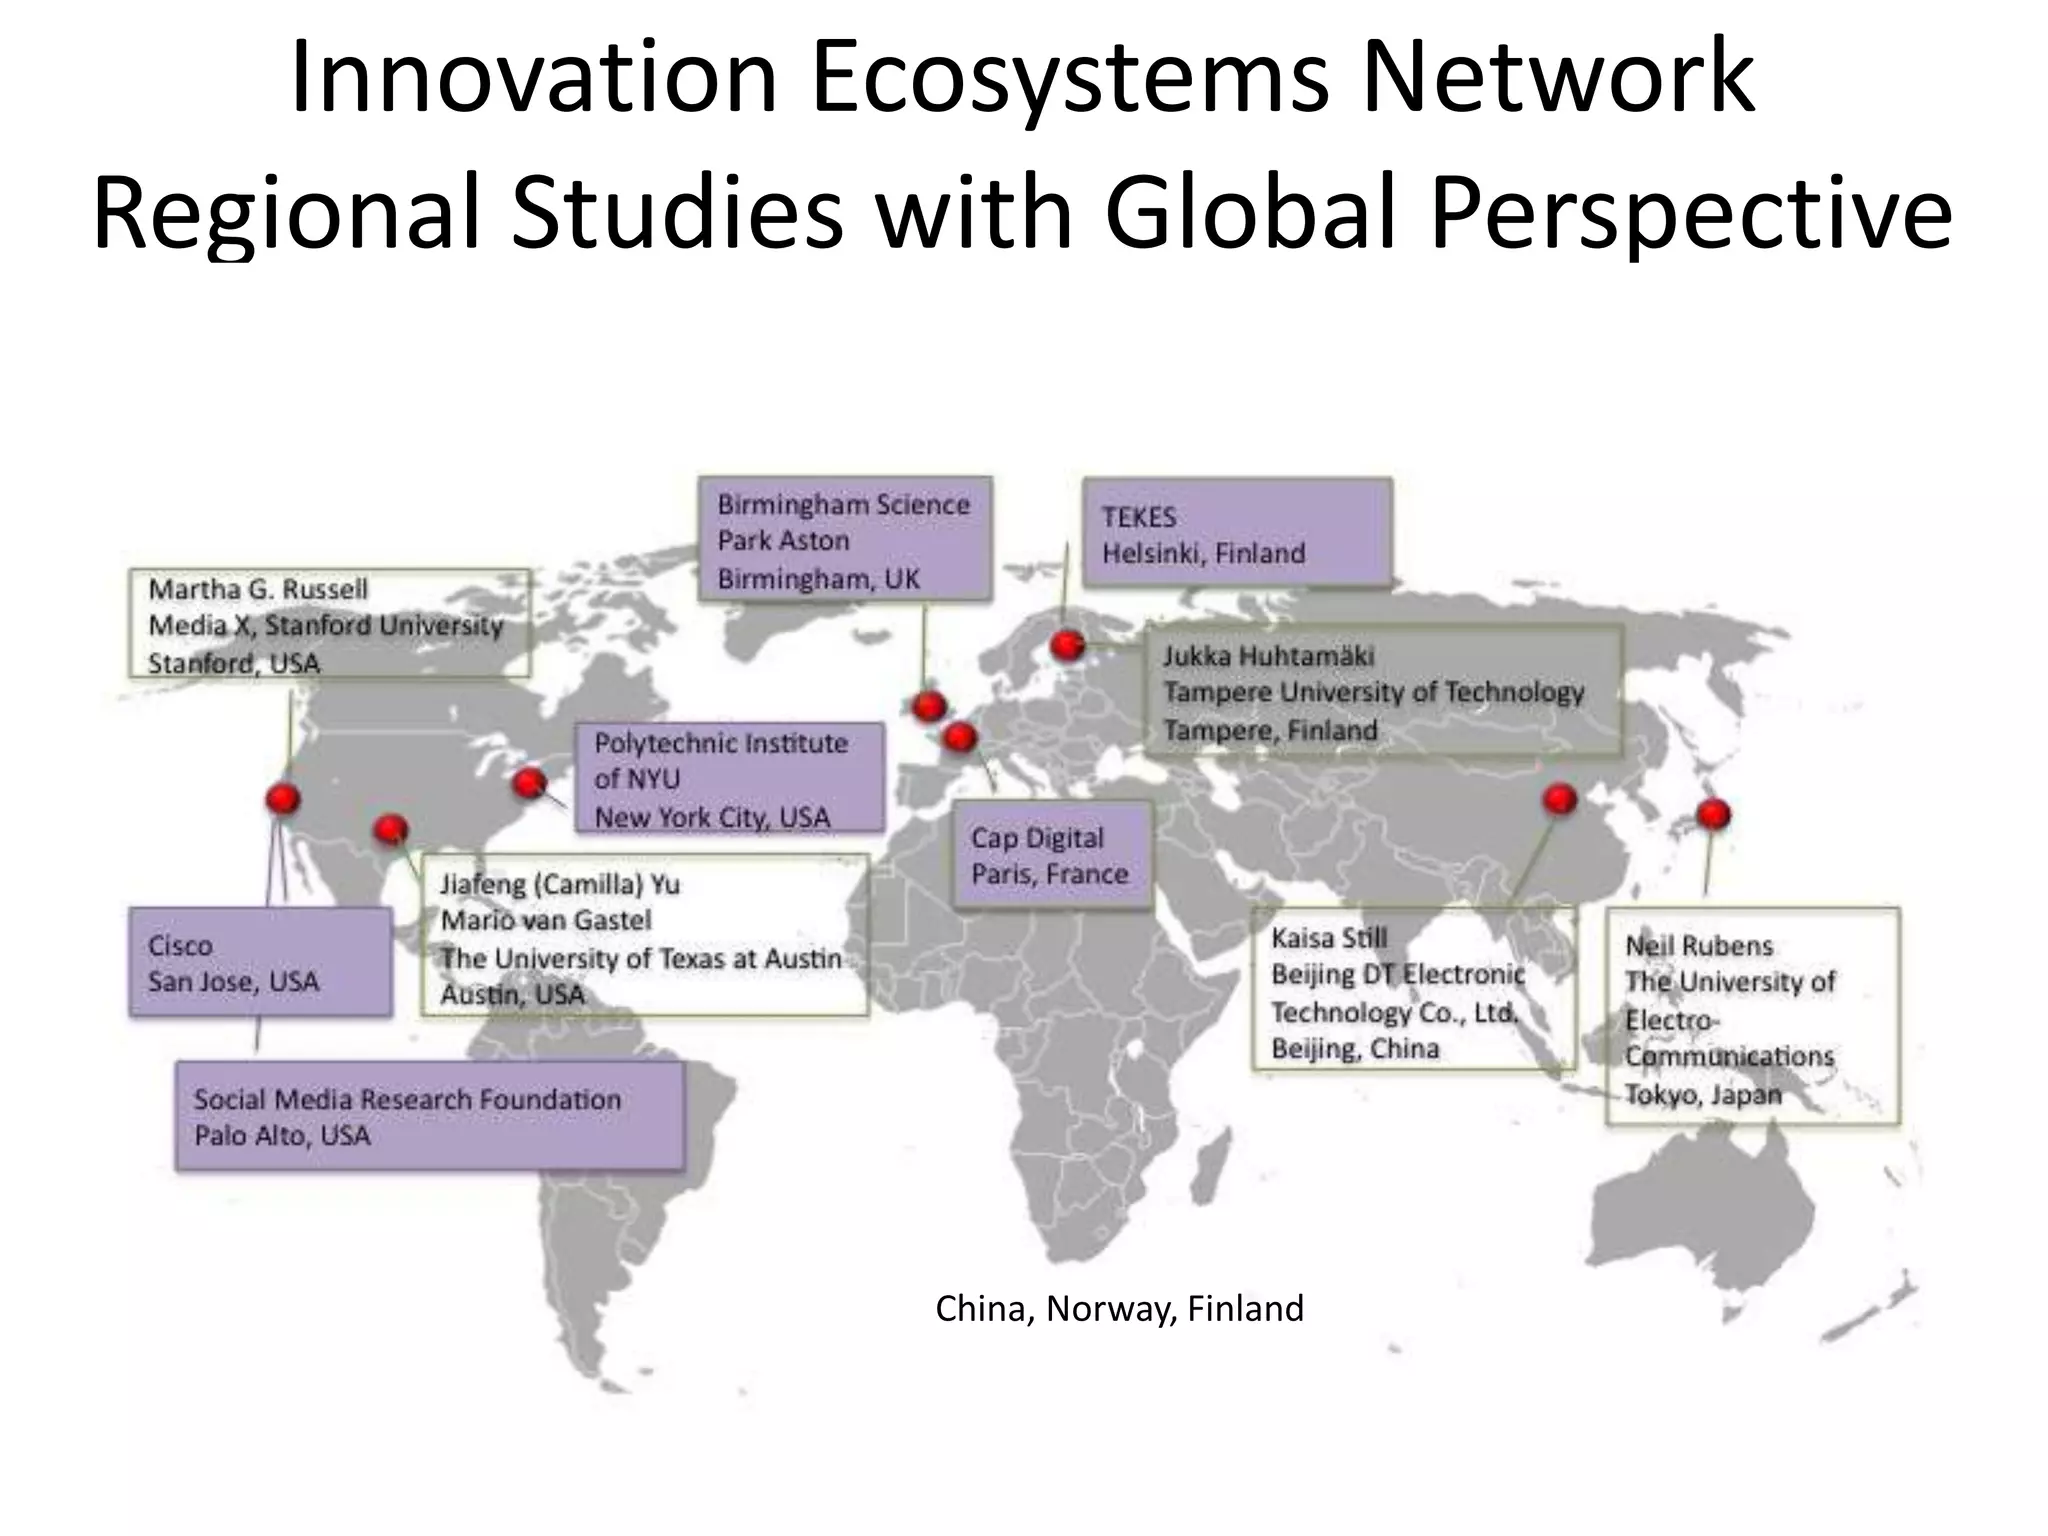
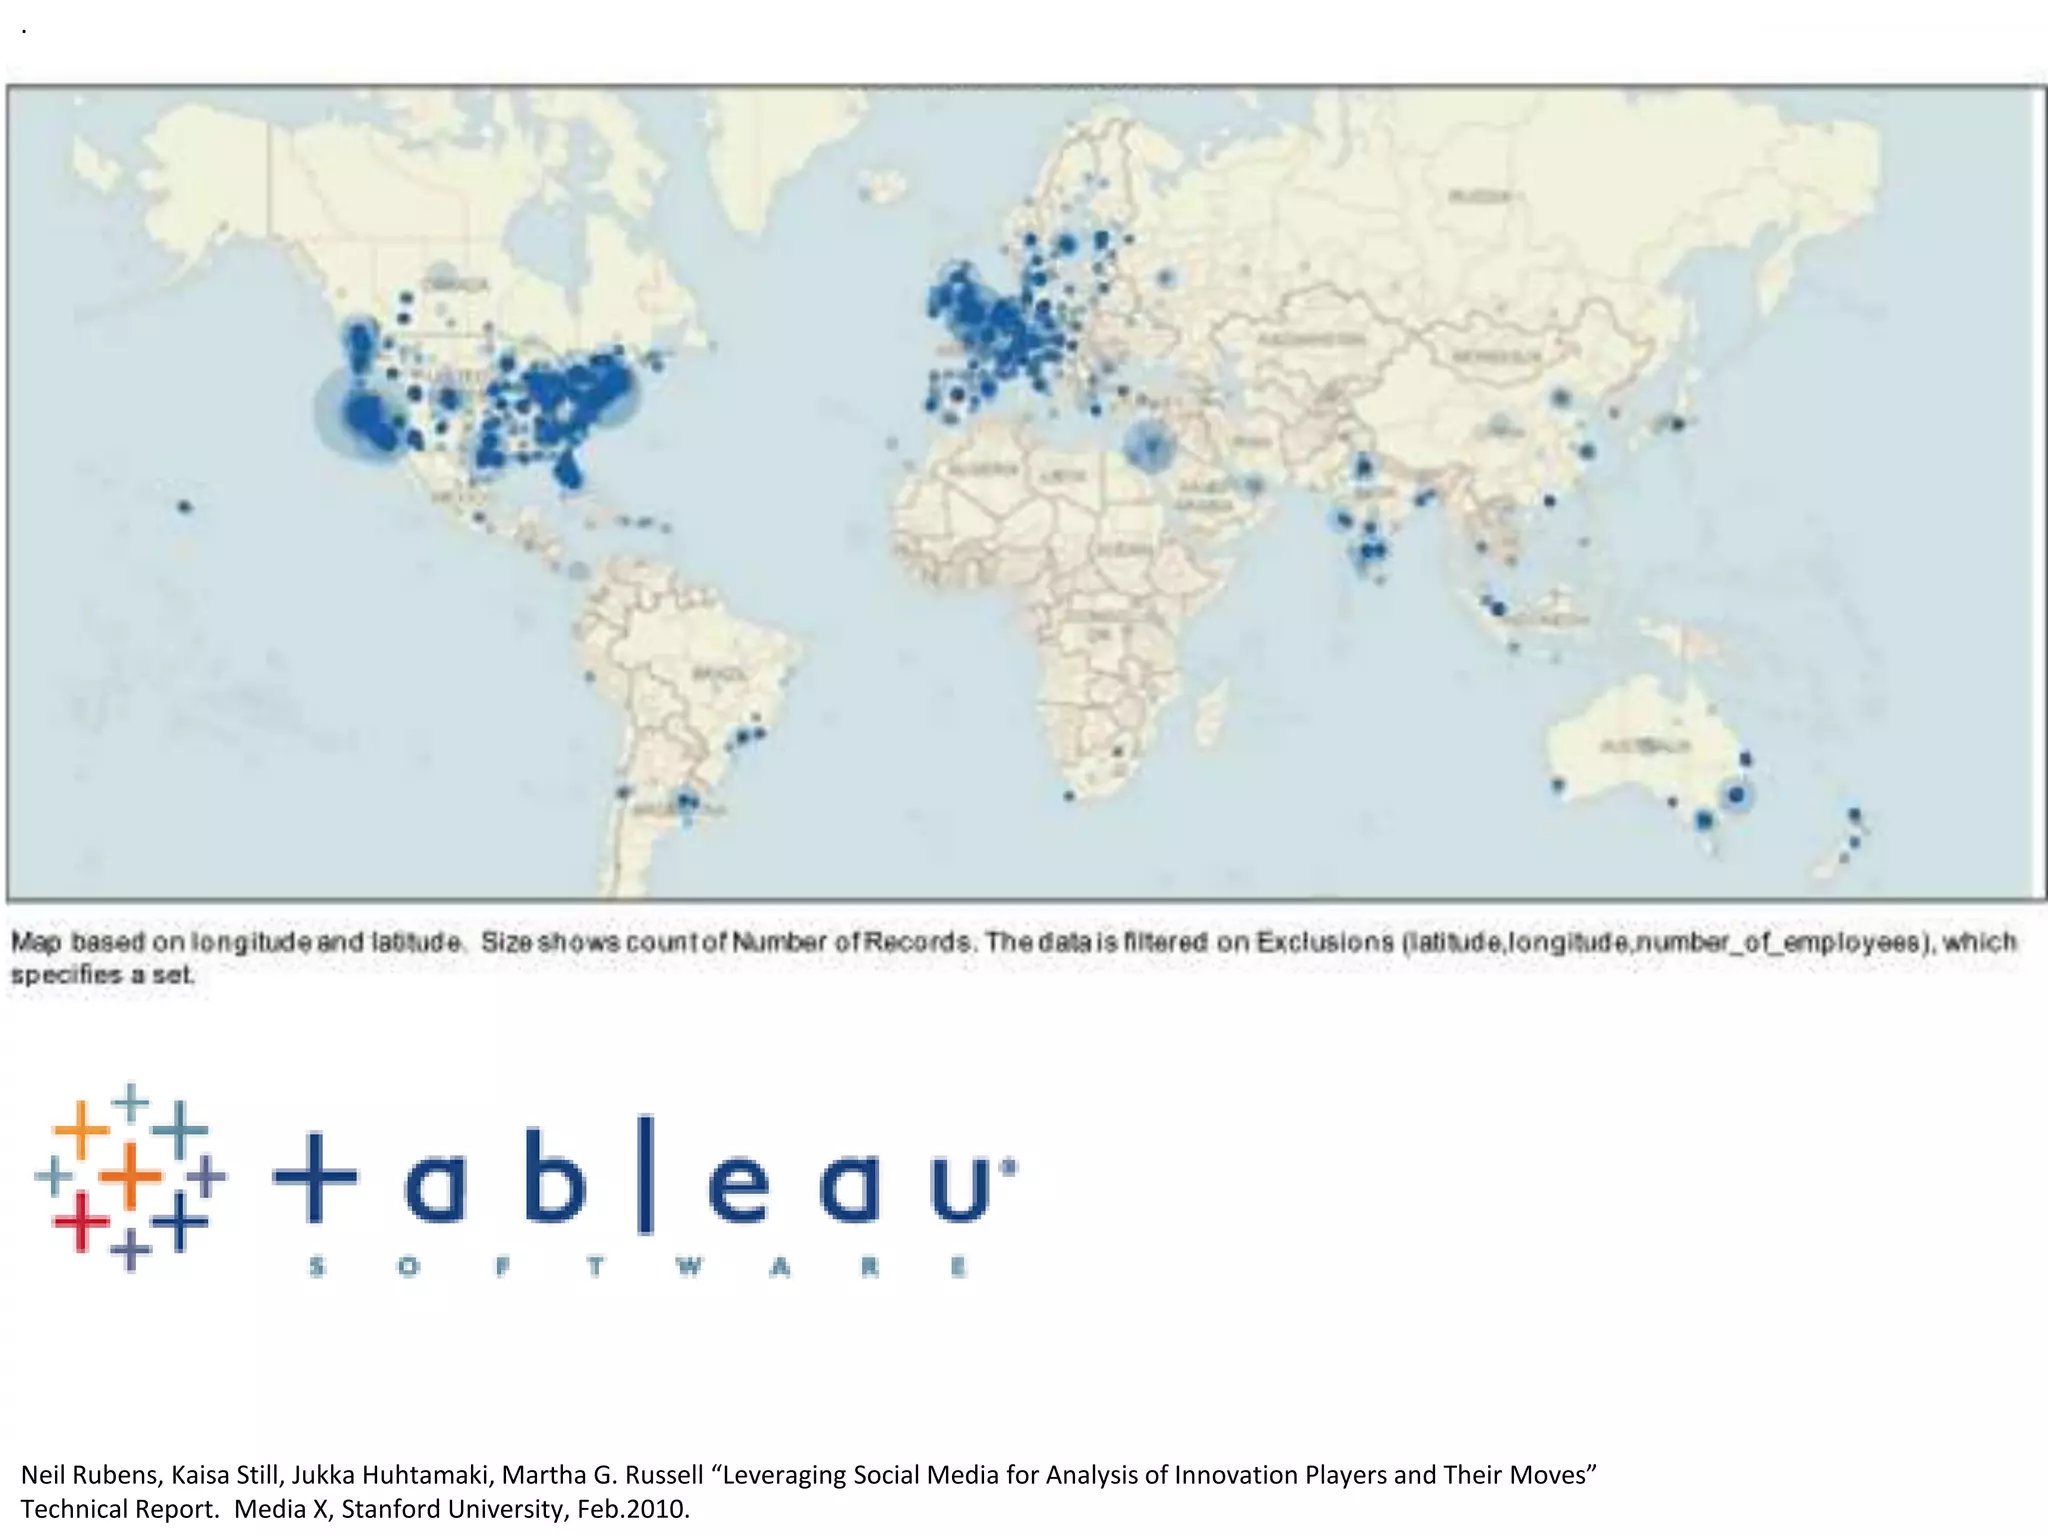
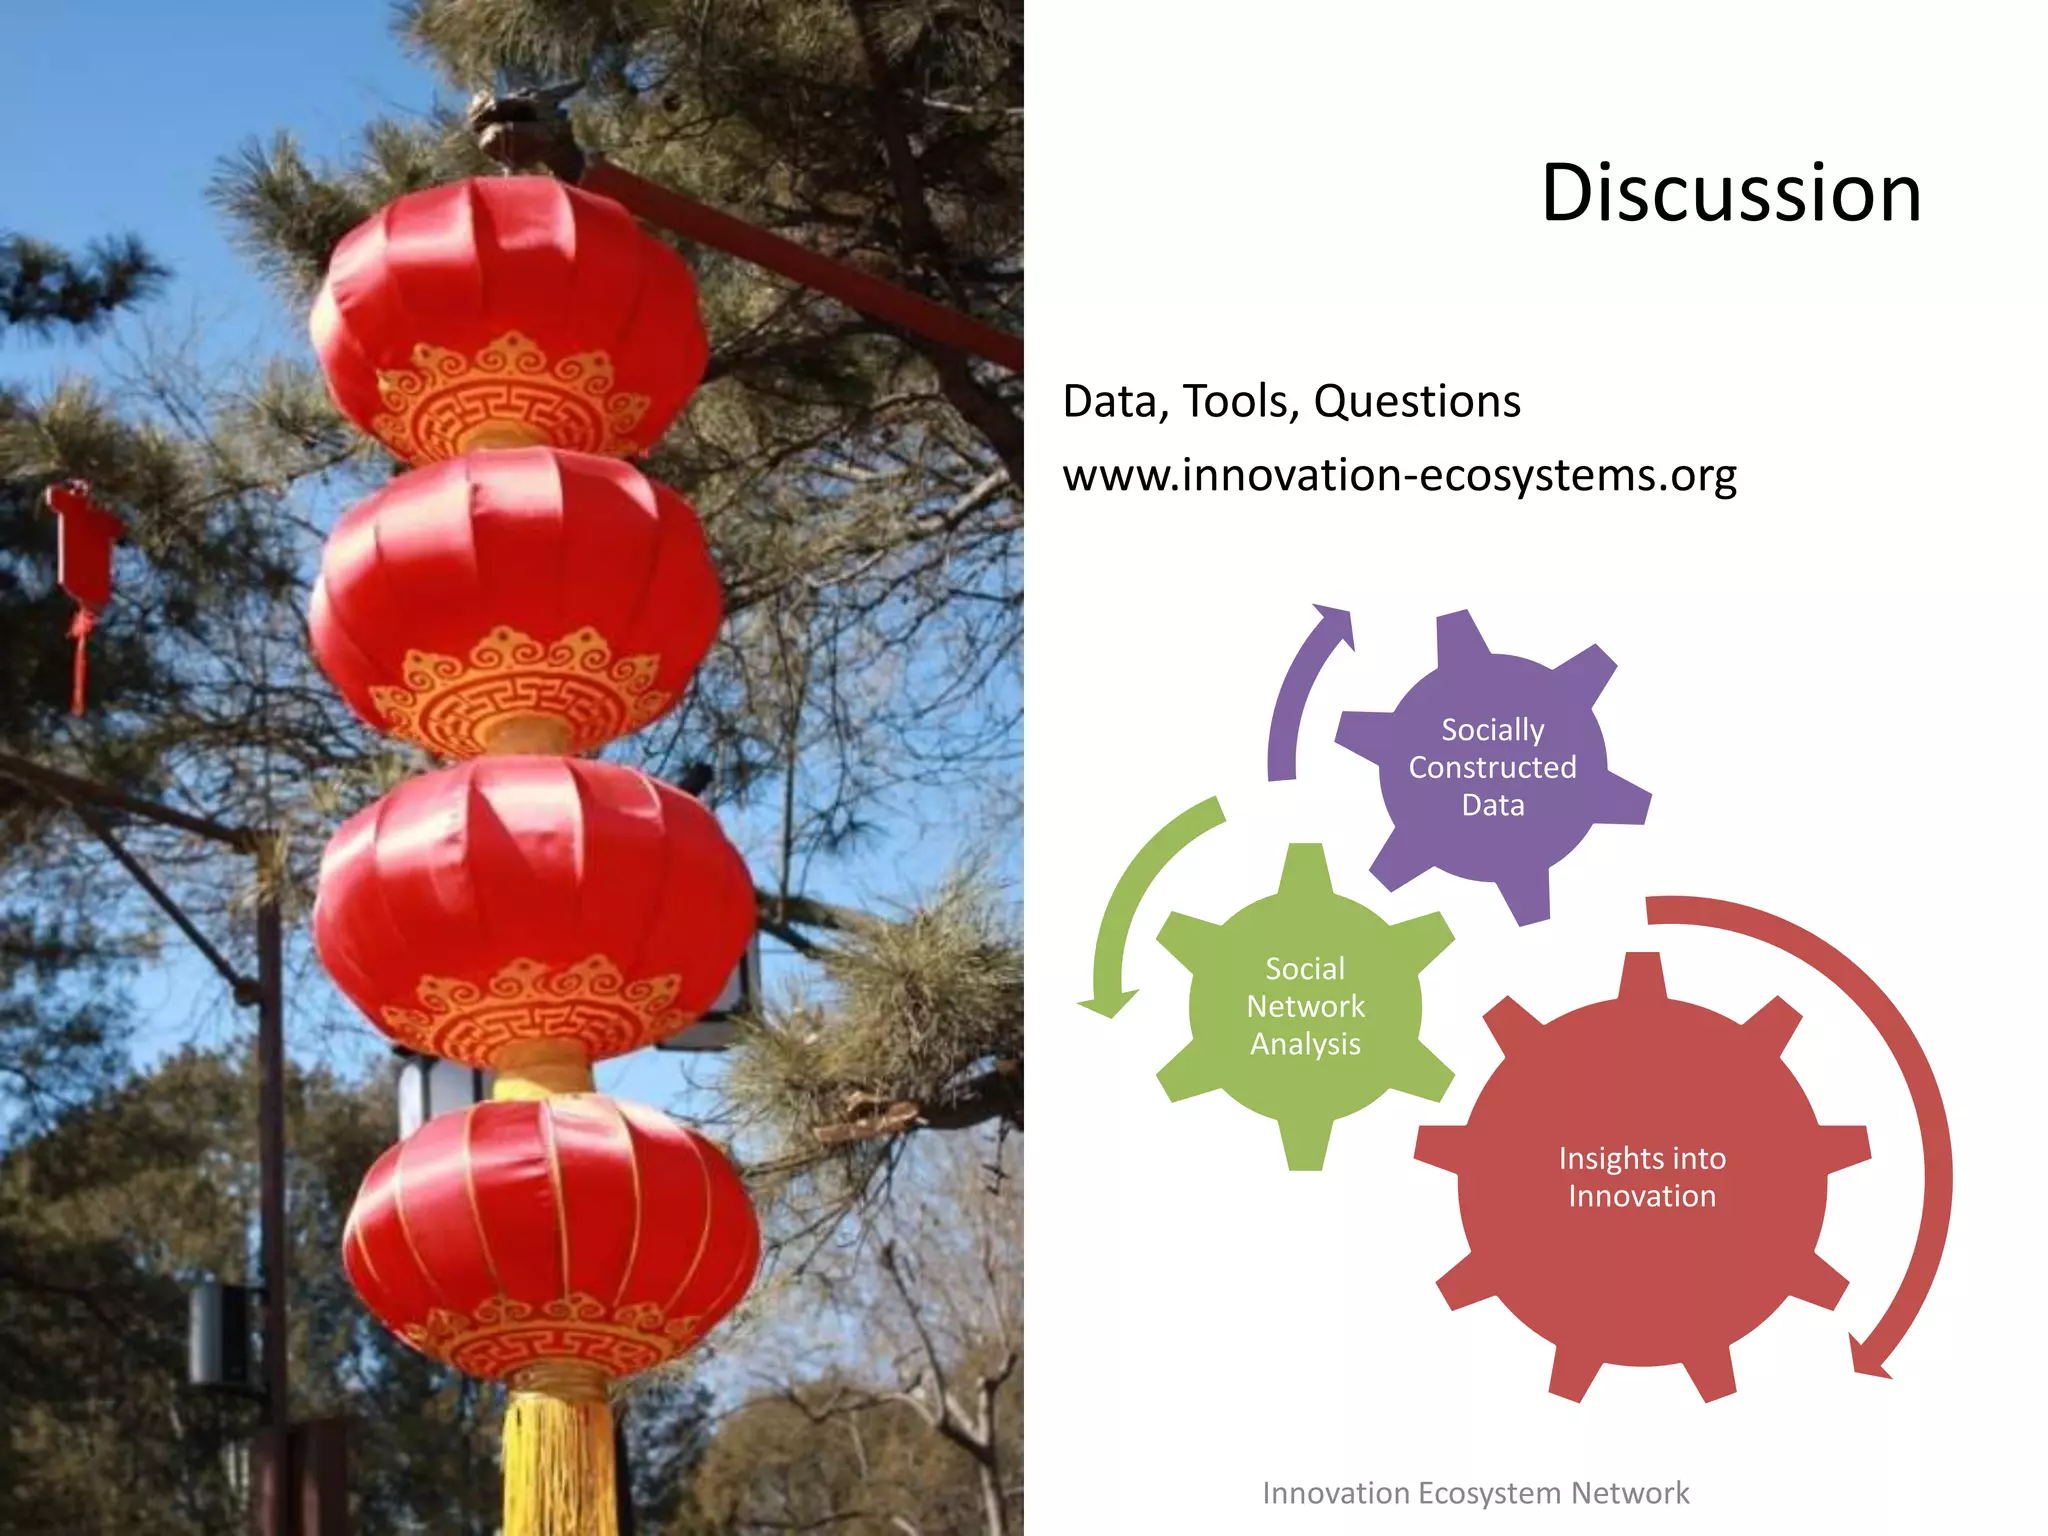
Identifying Value Co-creation in Innovation Ecosystems Using Social Network AnalysisInnovation Ecosystems Network,Martha G Russell, Neil RubensAugust 2, 2010
Innovation takes at least two.Team skills are required.There are winners and loosers.Although people can communicate anywhere, anytime, it’s difficult for anyone to have all the insights necessary at any one time for major decisions on the complex global issuesInnovation is Social
The Knowledge Revolution is here.What can we learn to improve our play?
http://www.innovation-ecosystems.orgInnovation Ecosystems NetworkMartha G Russell, PhD, martha.russell@stanford.edu
Sr. Research Scholar, HSTAR Institute
Associate Director, Media X at Stanford University
Neil Rubens, PhD, neil@hrstc.org
Assistant Professor, Graduate School of Information Systems
University of Electro-Communications, Tokyo
Jukka Huhtamäki, jukka.huhtamaki@tut.fi
Researcher, Lecturer
Hypermedia Laboratory (HLab) of Tampere University of Technology (TUT).
Kaisa Still, PhD, kaisastill@yahoo.com
Knowledge Management Specialist
Beijing DT Electronic Technology Co., Ltd
Mario Gastel, mariogastel@zeelandnet.nl
Graduate student, Texas Advertising, UT Austin
Fulbright Scholar (2009-11)
Jiafeng (Camilla) Yu, camillayu@gmail.com
M.A. in Advertising in Planning Track
The University of Texas at Austinhttp://www.flickr.com/photos/ritavitafinzi/2192500407/
“There is no data like more data” (Mercer at Arden. House, 1985)“There is no data like more data” (Mercer at Arden. House, 1985)Tan, Steinbach, Kumar; 20042,000 points500 Points8,000 points
Higher Dimensions: Double Edged Sword More Data is Needhttp://wissrech.ins.uni-bonn.de/research/projects/engel/engelpr2/pr2_thumb.jpgCould be easier to find patternshttp://www.iro.umontreal.ca/~bengioy/yoshua_en/research_files/CurseDimensionality.jpg
Innovation Ecosystems NetworkInnovation Ecosystems refer to the inter-organizational, political, economic, environmental, and technological systems through which a milieu conducive to business growth is catalyzed, sustained, and supported.A dynamic innovation ecosystem is characterized by a continual realignment of synergistic relationships of people, knowledge, and resources that promote harmonious growth of the system in agile responsiveness to changing internal and external forces.Optimizing the impact of investments made by stimulus programs and public and private stakeholders is a quest shared by developers around the world.A clear understanding of how to invest local resources for global participation that will accrue benefits to the local area has yet to be fully articulated, and metrics to measure interim progress are greatly needed. IEN aims to fill this void.
.Innovation EcosystemsDataset35,000 companies include:Sectors: Advertising, biotech, cleantech, consulting, ecommerce, enterprise, games_video, hardware, legal, mobile, network_hosting, public relations, search, security, semiconductor, software, web, other firms serving these.Investment profiles from Ltd to public, financing rounds identifiedMerger & Acquisition profilesNeil Rubens, Kaisa Still, Jukka Huhtamaki, Martha G. Russell “Leveraging Social Media for Analysis of Innovation Players and Their Moves” Technical Report.  Media X, Stanford University, Feb.2010.
# of Companies# of PeopleNeil Rubens, Kaisa Still, Jukka Huhtamaki, Martha G. Russell “Leveraging Social Media for Analysis of Innovation Players and Their Moves” Technical Report.  Media X, Stanford University, Feb.2010.
Models of InnovationFrom organizations to single users to networked individuals  eClusters?
The Place for InnovationFrom localized to regional to virtual shared spacesInnovation AccelerationNetworks?
.Number of US Technology-based companiesBy sector,  Dec 2009Neil Rubens, Kaisa Still, Jukka Huhtamaki, Martha G. Russell “Leveraging Social Media for Analysis of Innovation Players and Their Moves” Technical Report.  Media X, Stanford University, Feb.2010.
Need for Updating Regional           technology-based    economic 							development “The global map of businesses is increasingly dominated by geographically concentrated groups of companies and related economic actors and institutions”The Use of Data and Analysis as a tool for cluster policy, Green Paper on international best practices and perspectives prepared for the European Commission, November 2008“Members of a cluster can be sometimes located worldwide, but linked through information and communication technologies… the term e-cluster is used” Danese, Filippini, Romano, Vinelli 2009“Technological trends are causing a change in the way innovation gets done in advanced market economies”Baldwin & von Hippel November 2009, Harvard Business School Working Paper 10-038“Recognizing that a capacity to innovate and commercialize new high-technology products is increasingly a part of the international competition for economic leadership, governments around the world are taking active steps to strengthen their national innovation systems”Understanding Research, Science and Technology Parks: Global Best Practices, National Research Council of the National Academies, Report 2009
DistanceOldNew
The New Organizational Chart
Relationship InterlocksExecutives and key employeesTransfer of technologies and knowledge, professional networks, business culture, value-chain resources DirectorsUS Fortune 500 firms interlocked (shared directors) with average 7 other firmsCorporate governance embedded and filtered through social structures Executive compensation, strategies for takeovers, defending  against takeoversGerald F. Davis, “The Significance of Board Interlocks for Corporate Governance,” Corporate Governance 4:3, 1996Investors and service providersAwareness of external forces, competitive insights, resource leverageRelationship interlocks provideSocial relationship “filter” for governance, information flow & normsTransfer of implicit and explicit know-howMental modelshttp://fusionenterprises.ca/Business_Training.php
The new maps may be based on the connections -  rather than on distance.
CleanTechKaisa Still,  Neil Rubens, JukkaHuhtamäki, and Martha G. Russell , “Networks of Executive Women  in Technology-Based Innovation Ecosystems,” Technical Report , Media X, Stanford University, May.2010.
BioTechKaisa Still,  Neil Rubens, JukkaHuhtamäki, and Martha G. Russell , “Networks of Executive Women  in Technology-Based Innovation Ecosystems,” Technical Report , Media X, Stanford University, May.2010.

8 2-10 hkust eng

  • 1.
    Identifying Value Co-creationin Innovation Ecosystems Using Social Network AnalysisInnovation Ecosystems Network,Martha G Russell, Neil RubensAugust 2, 2010
  • 6.
    Innovation takes atleast two.Team skills are required.There are winners and loosers.Although people can communicate anywhere, anytime, it’s difficult for anyone to have all the insights necessary at any one time for major decisions on the complex global issuesInnovation is Social
  • 7.
    The Knowledge Revolutionis here.What can we learn to improve our play?
  • 8.
  • 9.
    Sr. Research Scholar,HSTAR Institute
  • 10.
    Associate Director, MediaX at Stanford University
  • 11.
    Neil Rubens, PhD,neil@hrstc.org
  • 12.
    Assistant Professor, GraduateSchool of Information Systems
  • 13.
  • 14.
  • 15.
  • 16.
    Hypermedia Laboratory (HLab)of Tampere University of Technology (TUT).
  • 17.
    Kaisa Still, PhD,kaisastill@yahoo.com
  • 18.
  • 19.
    Beijing DT ElectronicTechnology Co., Ltd
  • 20.
  • 21.
    Graduate student, TexasAdvertising, UT Austin
  • 22.
  • 23.
    Jiafeng (Camilla) Yu,camillayu@gmail.com
  • 24.
    M.A. in Advertisingin Planning Track
  • 25.
    The University ofTexas at Austinhttp://www.flickr.com/photos/ritavitafinzi/2192500407/
  • 26.
    “There is nodata like more data” (Mercer at Arden. House, 1985)“There is no data like more data” (Mercer at Arden. House, 1985)Tan, Steinbach, Kumar; 20042,000 points500 Points8,000 points
  • 27.
    Higher Dimensions: DoubleEdged Sword More Data is Needhttp://wissrech.ins.uni-bonn.de/research/projects/engel/engelpr2/pr2_thumb.jpgCould be easier to find patternshttp://www.iro.umontreal.ca/~bengioy/yoshua_en/research_files/CurseDimensionality.jpg
  • 28.
    Innovation Ecosystems NetworkInnovationEcosystems refer to the inter-organizational, political, economic, environmental, and technological systems through which a milieu conducive to business growth is catalyzed, sustained, and supported.A dynamic innovation ecosystem is characterized by a continual realignment of synergistic relationships of people, knowledge, and resources that promote harmonious growth of the system in agile responsiveness to changing internal and external forces.Optimizing the impact of investments made by stimulus programs and public and private stakeholders is a quest shared by developers around the world.A clear understanding of how to invest local resources for global participation that will accrue benefits to the local area has yet to be fully articulated, and metrics to measure interim progress are greatly needed. IEN aims to fill this void.
  • 29.
    .Innovation EcosystemsDataset35,000 companiesinclude:Sectors: Advertising, biotech, cleantech, consulting, ecommerce, enterprise, games_video, hardware, legal, mobile, network_hosting, public relations, search, security, semiconductor, software, web, other firms serving these.Investment profiles from Ltd to public, financing rounds identifiedMerger & Acquisition profilesNeil Rubens, Kaisa Still, Jukka Huhtamaki, Martha G. Russell “Leveraging Social Media for Analysis of Innovation Players and Their Moves” Technical Report. Media X, Stanford University, Feb.2010.
  • 30.
    # of Companies#of PeopleNeil Rubens, Kaisa Still, Jukka Huhtamaki, Martha G. Russell “Leveraging Social Media for Analysis of Innovation Players and Their Moves” Technical Report. Media X, Stanford University, Feb.2010.
  • 31.
    Models of InnovationFromorganizations to single users to networked individuals eClusters?
  • 32.
    The Place forInnovationFrom localized to regional to virtual shared spacesInnovation AccelerationNetworks?
  • 33.
    .Number of USTechnology-based companiesBy sector, Dec 2009Neil Rubens, Kaisa Still, Jukka Huhtamaki, Martha G. Russell “Leveraging Social Media for Analysis of Innovation Players and Their Moves” Technical Report. Media X, Stanford University, Feb.2010.
  • 34.
    Need for UpdatingRegional technology-based economic development “The global map of businesses is increasingly dominated by geographically concentrated groups of companies and related economic actors and institutions”The Use of Data and Analysis as a tool for cluster policy, Green Paper on international best practices and perspectives prepared for the European Commission, November 2008“Members of a cluster can be sometimes located worldwide, but linked through information and communication technologies… the term e-cluster is used” Danese, Filippini, Romano, Vinelli 2009“Technological trends are causing a change in the way innovation gets done in advanced market economies”Baldwin & von Hippel November 2009, Harvard Business School Working Paper 10-038“Recognizing that a capacity to innovate and commercialize new high-technology products is increasingly a part of the international competition for economic leadership, governments around the world are taking active steps to strengthen their national innovation systems”Understanding Research, Science and Technology Parks: Global Best Practices, National Research Council of the National Academies, Report 2009
  • 35.
  • 36.
  • 37.
    Relationship InterlocksExecutives andkey employeesTransfer of technologies and knowledge, professional networks, business culture, value-chain resources DirectorsUS Fortune 500 firms interlocked (shared directors) with average 7 other firmsCorporate governance embedded and filtered through social structures Executive compensation, strategies for takeovers, defending against takeoversGerald F. Davis, “The Significance of Board Interlocks for Corporate Governance,” Corporate Governance 4:3, 1996Investors and service providersAwareness of external forces, competitive insights, resource leverageRelationship interlocks provideSocial relationship “filter” for governance, information flow & normsTransfer of implicit and explicit know-howMental modelshttp://fusionenterprises.ca/Business_Training.php
  • 38.
    The new mapsmay be based on the connections - rather than on distance.
  • 39.
    CleanTechKaisa Still, Neil Rubens, JukkaHuhtamäki, and Martha G. Russell , “Networks of Executive Women in Technology-Based Innovation Ecosystems,” Technical Report , Media X, Stanford University, May.2010.
  • 40.
    BioTechKaisa Still, Neil Rubens, JukkaHuhtamäki, and Martha G. Russell , “Networks of Executive Women in Technology-Based Innovation Ecosystems,” Technical Report , Media X, Stanford University, May.2010.
  • 41.
    PRKaisa Still, Neil Rubens, JukkaHuhtamäki, and Martha G. Russell , “Networks of Executive Women in Technology-Based Innovation Ecosystems,” Technical Report , Media X, Stanford University, May.2010.
  • 42.
    WebKaisa Still, Neil Rubens, JukkaHuhtamäki, and Martha G. Russell , “Networks of Executive Women in Technology-Based Innovation Ecosystems,” Technical Report , Media X, Stanford University, May.2010.
  • 43.
    RolesCTOsInvestorsCMOsFoundersKaisa Still, Neil Rubens, JukkaHuhtamäki, and Martha G. Russell , “Networks of Executive Women in Technology-Based Innovation Ecosystems,” Technical Report , Media X, Stanford University, May.2010.
  • 44.
    Question?What interlock patternscharacterize investments into technology-based companies being made by Chinese investment firms?
  • 45.
    How are thesepatterns similar or different to those made by the rest of the world into China?http://4.bp.blogspot.com/_qFju91K89HM/SxRpABd1DTI/AAAAAAAABjw/6LaSJfjfk-I/s1600/Unexpected_Guests.jpghttp://successbeginstoday.org/wordpress/wp-content/unexpected2.jpg
  • 46.
    Context of Investmentsin/from ChinaSocially constructed dataset, in English, openly available– all challenges in China Innovation Ecosystems Dataset:323 technology-based companies with one or more locations in China
  • 47.
    42 Chinese, 77foreign investment firm
  • 48.
  • 49.
    Investment originating fromChinaUS$ 3.1 BInsights explored:The flow of financial resources into and out of China More illustrative than descriptive/prescriptive resultsNodeXL, TableauInnovation Ecosystem Network
  • 50.
    Initial Data Analysis:53%(113) of the Chinese companies from eCIS business sector50 % (66) of the foreign companies are from the eCIS business sectorToward Insights about:Patterns and differences in the characteristics of investment flows into and from China More Specific: Context of eCIS sectoreCommerce and electronic security=eCommerce, software search, network hosting, mobile, games &video, enterpriseInnovation Ecosystem Network
  • 51.
    HARVESTInvestments from Chinese(making investments)Innovation Ecosystem Network
  • 52.
    CULTIVATIONInvestments into China(receiving investments)Innovation Ecosystem Network
  • 53.
  • 54.
    Emerging Chinese businessclusters linked by investment firms Innovation Ecosystem Network
  • 55.
    Cultivation / Harvestingmodes - value co-creationChinese interlocks at the investment firm levelGovernment-led investment firmsKnowledge of government guaranteesInvestments in firms that return benefits to ChinaGlobal interlocks at both investment firm and enterprise levelsOpportunity network & value co-creationhttp://successbeginstoday.org/wordpress/wp-content/unexpected2.jpgTopline Findings
  • 56.
    http://www.flickr.com/photos/manpsing/2618332693/http://www.fabcats.org/owners/feeding/info.htmlPassive LearningActive LearningFURTHERRESEARCHPersonal relationships/opportunity networks Time series analysisExpansion of data Chinese language press releases Chinese business registries
  • 57.
    Innovation Ecosystems Network Regional Studies with Global PerspectiveChina, Norway, Finland
  • 58.
    .Neil Rubens, KaisaStill, Jukka Huhtamaki, Martha G. Russell “Leveraging Social Media for Analysis of Innovation Players and Their Moves” Technical Report. Media X, Stanford University, Feb.2010.
  • 59.

Editor's Notes

  • #10 Please think of several patterns and outliers in bicicles picture.ASK AUDIENCE---So let me just mention a few:Color is one of the patters that jumps out right awayFor example there is a lot of aluminum colorsYellow bike jumps out as an outlierIf we look closer we may also notice that there is only one bike where the handles are greenOnly a few bikes have their seat covered with plasticBikes are more or less lined upThere is a bike that is facing the wrong way though----------Even in these small dataset there are so many patterns and outliersBut how many of them are interesting; that really depends.We try to find patterns that are novel; since telling people that bicycles tend to have two wheels is perhaps not so interesting.What is interesting also depends on the purpose;A person checking whether bicycles have permit for parking – is looking for a specific outliersWhen I look for my own bike; I have a different outlier in mindSo ability to spot things that are interesting is extremely important.Outliers are normally discarded in data mining …Because you are often trying to find a pattern, and outliers screw up things.In business, some outliers have become very successful as described in the following book.So we thing it is interesting to look not only for patterns but also for outliers
  • #11 Can’t do data mining without the data; so we need data and the more the better – since then we can see patterns more clearly
  • #12 Also when we have more dimensions it is easier to spot patterns
  • #14 Now let me briefly describe a case of how we utilized the above mentioned principles.In our project we try to understand innovation, so have gathered the data on companies, people and money.What makes this data set different, besides its timeliness is the majority of data (thanks to social media) is about small companies having between 1 – 5 employees.A lot of innovation happens there so it is important to track.
  • #16 This shows how the models of innovations have evolved reflecting the changes
  • #17 This shows how we have evolved from the local/regional activities
  • #18 We can also look at the companies by sector
  • #19 At the core of this research we have what initially were called “regional technology-based economic development”– however each of the three parts has experienced changes, which calls for updating the whole concept
  • #20 So far I have shown analysis based on the spatial distance;However the aspects of distance is changing;We don’t know where these people are physically located but they seem to be in the same space.
  • #23 So the new maps may be based on the connections; rather than on distance.For this analysis we have utilized an open source tool called NodeXL
  • #29 My name is Neil Rubens, I am not a journalist; I am a data miner – but I think in essense it is not so different.
  • #37 It is rare that the data is simply brought to us on a silver platterWe have to try hard to actively acquire it
  • #39 This map indicates the location of the companies. Size of circle indicates number of companies.For this part of analysis we have used Tableau Software.