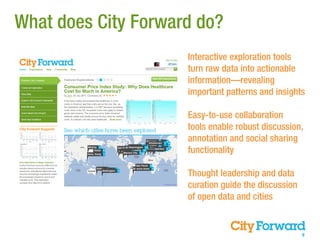
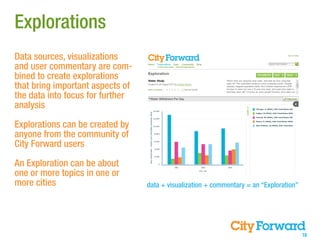
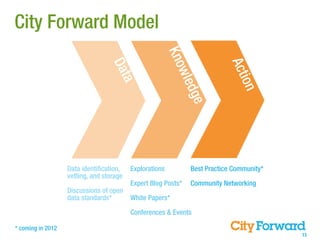
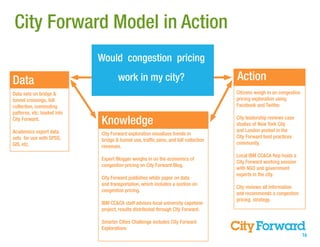
Making Open Data Accessible to Communities:
City Forward and other Data Visualization Tools
     John C. Reinhardt, AICP - Program Manager, City Forward
                                    IBM Corporate Citizenship
                                          November 18, 2011
Presentation Overview
Data and Cities: an IBM perspective

City Forward: a Corporate Citizenship Initiative

The Future: Data Literacy and Real-World Examples


                                                    2
Our Cities Generate Vital Signs
Today, almost anything—any object, process or system—can be instrumented, inter-
connected and infused with intelligence.

Data is lying in archives, published on government websites, being sensed from in-
strumentation in the environment, deduced from aerial imagery, and built from the
ground-up by citizens electronically communicating about city life.

This reality holds enormous promise for people everywhere. Nowhere is the potential
for progress more evident than in the world’s cities.


      Instrumented | Interconnected | Intelligent


                                                                                      3
The Future is Urban


   13%            50%        70%


    1900              2007   2050


                                    4
Cities are a Complex System of Systems
Here, all man-made systems intersect, interact and interconnect with one another.

On average 45% of a city’s budget goes to providing public safety services

Up to 40% of world energy use takes place in buildings

In Mexico City, 600 new vehicles enter the congested streets every day

A 1% increase in the college-educated population of a metropolitan area raises ev-
erybody else’s average wages by 0.8%-1.2%


                                                                                     5
Data in Cities
 National Data   - Relatively easy to secure.
                 -Good for comparing cities to national averages.
                 - Can be by academics, NGOs, think tanks.

     City Data   - Relatively easy to secure.
                 - Good for comparing peer cities (as cities like to do!)
                 - Can be used by journalists, city governments, academic
                 researchers.

Neighborhood     - Di cult to secure.
        Data     - Good for making policy & resourcing decisions.
                 - Can be used by citizens, CDCs , urban planners, etc.

    Individual   - Explosion with new instrumentation

          Data   - Allows for interesting predictive analytics
                 - Privacy concerns

                                                                            6
Importance of Data

Smarter Cities bring together information in ways that lead to new insights
and support decision-making.


                                                                              7
What is City Forward?


     City Forward is a free, web-based platform
     that lets users visualize and interact with
     city data while engaging with a community
     of people who are passionate about the
     future of cities.

                  cityforward.org
What does City Forward do?
                     Interactive exploration tools
                     turn raw data into actionable
                     information—revealing
                     important patterns and insights

                     Easy-to-use collaboration
                     tools enable robust discussion,
                     annotation and social sharing
                     functionality

                     Thought leadership and data
                     curation guide the discussion
                     of open data and cities


                                                     9
Explorations
Data sources, visualizations
and user commentary are com-
bined to create explorations
that bring important aspects of
the data into focus for further
analysis

Explorations can be created by
anyone from the community of
City Forward users

An Exploration can be about
one or more topics in one or
more cities                       data + visualization + commentary = an “Exploration”


                                                                                         10
An Exploration - Syracuse and Housing
                       Building Permits in Syracuse
                       (Syracuse’s boom occurred in the late
                       90s)


                       Homeowner Vacancy in Peer cities
                       Baltimore, Syracuse, Detroit
                       (Baltimore’s vacancy was more stable. What
                       policies were in place?)


                                                               11
How Does it Work?

      Community &                                               City
     Data Explorations   Services


                                                  Community            Government
                                                                         Agency
                         Exploration


          User
                          Content      Database         Data
                                                    Acquisition &
                                                   Transformation
                                                      Services


                         Community


                                                                                    12
IBM Technology in Action
IBM DB2 Database for data storage

IBM Cognos 8 Business Intelligence
for data analysis

IBM ILOG Elixir for Data visualization


IBM Tivoli software for user info mgmt

IBM Rational products for
requirements and project mgmt

IBM Lotus products for content
mgmt and social networking
Click here for a full technology overview.
                                             13
Focus Audiences
               Audience 1                 Audience 2
                         Citizens         Practitioners
                        Students          Cities
                           Media          Corporations
                            NGOs          Government
                                          SMEs
                                          Academics

   In need of tools, data, and training   Have tools, data, and expertise to share


                                                                                     14
City Forward Model


                                                         Kno


                                                                           Act
                                  Dat


                                                            wle


                                                                              ion
                                      a


                                                               dge
                   Data identification,    Explorations         Best Practice Community*
                   vetting, and storage
                                          Expert Blog Posts*   Community Networking
                   Discussions of open
                   data standards*     White Papers*

                                          Conferences & Events

* coming in 2012
                                                                                          15
City Forward Model in Action
                             Would congestion pricing

Data                                 work in my city?                                Action
Data sets on bridge &                                                                Citizens weigh in on congestion
tunnel crossings, toll                                                               pricing exploration using
collection, commuting                                                                Facebook and Twitter.
patterns, etc. loaded into
City Forward.
                             Knowledge                                               City leadership reviews case
                                                                                     studies of New York City
Academics export data                                                                and London posted in the
                             City Forward exploration visualizes trends in
sets for use with SPSS,                                                              City Forward best practices
                             bridge & tunnel use, traffic jams, and toll collection
GIS, etc.                                                                            community.
                             revenues.
                                                                                     Local IBM CC&CA Rep hosts a
                             Expert Blogger weighs in on the economics of
                                                                                     City Forward working session
                             congestion pricing on City Forward Blog.
                                                                                     with NGO and government
                                                                                     experts in the city.
                             City Forward publishes white paper on data
                             and transportation, which includes a section on
                                                                                     City reviews all information
                             congestion pricing.
                                                                                     and recommends a congestion
                                                                                     pricing strategy.
                             IBM CC&CA staff advises local university capstone
                             project, results distributed through City Forward.

                             Smarter Cities Challenge includes City Forward
                             Explorations
                                                                                                                       16
City Focus
                     SCC Cities


   Academic Partnership Cities


       Business Opportunities


   CC&CA Field Representatives

                                  17
Topic Focus
Chosen based on several criteria:

Emerging sectors for IBM, hot topics in the media, data availability,
and ability to engage in thought leadership.

      Education & Workforce Development | Social Safety Net
             Disaster Management | Food Systems

           Citizen Engagement (across all vertical topics)

Focus topics are not at the exclusion of other explorations, but help
focus the outreach to speci c user groups.
                                                                        18
Successes to date
                                                              Total

      Number of Explorations                                    102

          Number of Subjects                                       31
             Number of Cities                                      78
       National Average Cities                                     32
                 Data Sources                                      42
              SCC Integration    - City Forward is part of the 2012 City
                                                     Selection Process.

                                 - Integration with Syracuse, Philadel-
                                                     phia, and Helsinki


       Academic Partnerships      NYU Urban Systems Competition, NC
                                  State Youth Services Project, Notre
                                               Dame Foresight Course
                                         Yale, MIT, Harvard Capstones


                                                                           19
Other Tools


                                 m     Many  Eyes

      Independent Discovery     Social Networking and
                              Community Building Tools
                                       Included


                                                         20
“The Google Public Data Explorer makes large datasets easy to
explore, visualize and communicate. As the charts and maps animate
over time, the changes in the world become easier to understand. You
don’t have to be a data expert to navigate between di erent views,
make your own comparisons, and share your ndings.

Students, journalists, policy makers and everyone else can play with
the tool to create visualizations of public data, link to them, or embed
them in their own webpages. Embedded charts and links can update
automatically so you’re always sharing the latest available data.”


                                                                           21
Simple, Minimal Interface
Animations of data over time
Ability to embed and share
User-uploaded datasets
Datasets from:
    World Bank; Eurostat; OECD;
    US Bureau of Labor Stats;
    US Census; CDC; World
    Resources Institute; NYC
    Department of Public
    Health, etc.


                               22
“Tableau Public is a free service that lets anyone publish interactive
data to the web. Once on the web, anyone can interact with the data,
download it, or create their own visualizations of it. No programming
skills are required.

The free version of Tableau Public is for people. This includes writers,
bloggers, students, professors, hobbyists, journeymen, critics,
citizens and more. It’s also meant for organizations, but only as an
introductory service. If your organization wants to put data online for
the public, you are welcome to use this as an introductory service.”


                                                                           23
Users must download software
Robust “Community” section
O ers best practices on visualization
Does not store datasets, but links to
publicly available data.

Allows users to share and comment


                                   24
m   Many  Eyes


    “Data visualisation tools from IBM. Site allows users to upload data
    and then produce graphic representations for others to view and
    comment upon.”


                                                                           25
m   Many  Eyes
                 Robust “Community” section
                 Users can upload their own data

                 Users can share data sets

                 Allows users to share their viz

                 Many good looking viz options


                                                   26
“Data visualization works so well because the human brain is extremely well-equipped to process visual
information. We can capture patterns and essential themes in huge data sets very, very quickly through
visual means.

Unfortunately, the tools to create these visual representations are usually too expensive and di cult
for smaller news organizations and everyday citizens to use, creating a gap for the future of community
journalism. With the generous support of the Knight Foundation, we created VIDI, a suite of powerful
intuitive Drupal data-visualization modules for anyone to use on any standard set of data ranging from
government databases to demographics and statistics.

Jack Knight called for media to inform and enlighten, so the people might determine their own true
interests. As we come to understand his exhortation’s new, evolving meaning, we must continually
challenge ourselves to break down professional barriers in order to empower the in nite diversity of
equally true interests. “Raw Data Now” should be our battle cry, and open-source data visualization
modules our weaponry. Visualize the power of data!”


                                                                                                          27
Developed speci cally for Journalists

Users must identify data sets

To share, users must have a Drupal-based
website

The best looking visualizations are created
through Google API

Tool is set up to visualize by selecting
“Time”, “Geo” or “Comparative” data

Requires some technical skill and data
literacy

                                           28
“The Global City Indicators Program provides an established set of city indicators
with a globally standardized methodology that allows for global comparability of
city performance and knowledge sharing. This website serves all cities that become
members to measure and report on a core set of indicators through this web-based
relational database.”


                                                                                     29
Allows for city to city comparison
Allows comparisons of “peer cities”
Could have useful data for City Forward
visualizations
Many cities do not have data
Reports are only in “chart” form


                                      30
What’s Next?
The future of urban data:

    More Data

    Better Data

    Better Use of Data

    More Collaboration Amongst Professions


                                             31
What’s Next?
City Forward is currently the only tool with the following features:

        Extensive City-level data

        Storage of datasets on the City Forward website

        City comparison features using city-reported data

        Global scope at the city level

Thinking about:

        How to Scale the number of cities and data sets included

        User experience redesign, built around cities as hubs

        City Forward as a data literacy tool


                                                                       32
Data Literacy
Accessing, understanding and processing data will be key to accessing the best
opportunities in cities in the 21st century

         Where to send the kids to school

         Where jobs are located and where they pay the most

         How to minimize energy consumption


“We didn’t build libraries for a literate citizenry. We built libraries to help citizens
become literate. Today we build open data portals not because we have public
policy literate citizens, we build them so that citizens may become literate in public
policy.” - David Eaves


                                                                                           33
Challenge to the Urban Systems Collaborative


  What are we doing as a group to foster citizen interaction with
  data, increase data literacy, and improve the understanding of
             urban systems among the general public?


         Questions | Open Discussion


                                                                    34

Urban Systems Collaborative Seminar | John Reinhardt, City Forward and other Data Visualization Tools

  • 1.
    Making Open DataAccessible to Communities: City Forward and other Data Visualization Tools John C. Reinhardt, AICP - Program Manager, City Forward IBM Corporate Citizenship November 18, 2011
  • 2.
    Presentation Overview Data andCities: an IBM perspective City Forward: a Corporate Citizenship Initiative The Future: Data Literacy and Real-World Examples 2
  • 3.
    Our Cities GenerateVital Signs Today, almost anything—any object, process or system—can be instrumented, inter- connected and infused with intelligence. Data is lying in archives, published on government websites, being sensed from in- strumentation in the environment, deduced from aerial imagery, and built from the ground-up by citizens electronically communicating about city life. This reality holds enormous promise for people everywhere. Nowhere is the potential for progress more evident than in the world’s cities. Instrumented | Interconnected | Intelligent 3
  • 4.
    The Future isUrban 13% 50% 70% 1900 2007 2050 4
  • 5.
    Cities are aComplex System of Systems Here, all man-made systems intersect, interact and interconnect with one another. On average 45% of a city’s budget goes to providing public safety services Up to 40% of world energy use takes place in buildings In Mexico City, 600 new vehicles enter the congested streets every day A 1% increase in the college-educated population of a metropolitan area raises ev- erybody else’s average wages by 0.8%-1.2% 5
  • 6.
    Data in Cities National Data - Relatively easy to secure. -Good for comparing cities to national averages. - Can be by academics, NGOs, think tanks. City Data - Relatively easy to secure. - Good for comparing peer cities (as cities like to do!) - Can be used by journalists, city governments, academic researchers. Neighborhood - Di cult to secure. Data - Good for making policy & resourcing decisions. - Can be used by citizens, CDCs , urban planners, etc. Individual - Explosion with new instrumentation Data - Allows for interesting predictive analytics - Privacy concerns 6
  • 7.
    Importance of Data SmarterCities bring together information in ways that lead to new insights and support decision-making. 7
  • 8.
    What is CityForward? City Forward is a free, web-based platform that lets users visualize and interact with city data while engaging with a community of people who are passionate about the future of cities. cityforward.org
  • 9.
    What does CityForward do? Interactive exploration tools turn raw data into actionable information—revealing important patterns and insights Easy-to-use collaboration tools enable robust discussion, annotation and social sharing functionality Thought leadership and data curation guide the discussion of open data and cities 9
  • 10.
    Explorations Data sources, visualizations anduser commentary are com- bined to create explorations that bring important aspects of the data into focus for further analysis Explorations can be created by anyone from the community of City Forward users An Exploration can be about one or more topics in one or more cities data + visualization + commentary = an “Exploration” 10
  • 11.
    An Exploration -Syracuse and Housing Building Permits in Syracuse (Syracuse’s boom occurred in the late 90s) Homeowner Vacancy in Peer cities Baltimore, Syracuse, Detroit (Baltimore’s vacancy was more stable. What policies were in place?) 11
  • 12.
    How Does itWork? Community & City Data Explorations Services Community Government Agency Exploration User Content Database Data Acquisition & Transformation Services Community 12
  • 13.
    IBM Technology inAction IBM DB2 Database for data storage IBM Cognos 8 Business Intelligence for data analysis IBM ILOG Elixir for Data visualization IBM Tivoli software for user info mgmt IBM Rational products for requirements and project mgmt IBM Lotus products for content mgmt and social networking Click here for a full technology overview. 13
  • 14.
    Focus Audiences Audience 1 Audience 2 Citizens Practitioners Students Cities Media Corporations NGOs Government SMEs Academics In need of tools, data, and training Have tools, data, and expertise to share 14
  • 15.
    City Forward Model Kno Act Dat wle ion a dge Data identification, Explorations Best Practice Community* vetting, and storage Expert Blog Posts* Community Networking Discussions of open data standards* White Papers* Conferences & Events * coming in 2012 15
  • 16.
    City Forward Modelin Action Would congestion pricing Data work in my city? Action Data sets on bridge & Citizens weigh in on congestion tunnel crossings, toll pricing exploration using collection, commuting Facebook and Twitter. patterns, etc. loaded into City Forward. Knowledge City leadership reviews case studies of New York City Academics export data and London posted in the City Forward exploration visualizes trends in sets for use with SPSS, City Forward best practices bridge & tunnel use, traffic jams, and toll collection GIS, etc. community. revenues. Local IBM CC&CA Rep hosts a Expert Blogger weighs in on the economics of City Forward working session congestion pricing on City Forward Blog. with NGO and government experts in the city. City Forward publishes white paper on data and transportation, which includes a section on City reviews all information congestion pricing. and recommends a congestion pricing strategy. IBM CC&CA staff advises local university capstone project, results distributed through City Forward. Smarter Cities Challenge includes City Forward Explorations 16
  • 17.
    City Focus SCC Cities Academic Partnership Cities Business Opportunities CC&CA Field Representatives 17
  • 18.
    Topic Focus Chosen basedon several criteria: Emerging sectors for IBM, hot topics in the media, data availability, and ability to engage in thought leadership. Education & Workforce Development | Social Safety Net Disaster Management | Food Systems Citizen Engagement (across all vertical topics) Focus topics are not at the exclusion of other explorations, but help focus the outreach to speci c user groups. 18
  • 19.
    Successes to date Total Number of Explorations 102 Number of Subjects 31 Number of Cities 78 National Average Cities 32 Data Sources 42 SCC Integration - City Forward is part of the 2012 City Selection Process. - Integration with Syracuse, Philadel- phia, and Helsinki Academic Partnerships NYU Urban Systems Competition, NC State Youth Services Project, Notre Dame Foresight Course Yale, MIT, Harvard Capstones 19
  • 20.
    Other Tools m Many  Eyes Independent Discovery Social Networking and Community Building Tools Included 20
  • 21.
    “The Google PublicData Explorer makes large datasets easy to explore, visualize and communicate. As the charts and maps animate over time, the changes in the world become easier to understand. You don’t have to be a data expert to navigate between di erent views, make your own comparisons, and share your ndings. Students, journalists, policy makers and everyone else can play with the tool to create visualizations of public data, link to them, or embed them in their own webpages. Embedded charts and links can update automatically so you’re always sharing the latest available data.” 21
  • 22.
    Simple, Minimal Interface Animationsof data over time Ability to embed and share User-uploaded datasets Datasets from: World Bank; Eurostat; OECD; US Bureau of Labor Stats; US Census; CDC; World Resources Institute; NYC Department of Public Health, etc. 22
  • 23.
    “Tableau Public isa free service that lets anyone publish interactive data to the web. Once on the web, anyone can interact with the data, download it, or create their own visualizations of it. No programming skills are required. The free version of Tableau Public is for people. This includes writers, bloggers, students, professors, hobbyists, journeymen, critics, citizens and more. It’s also meant for organizations, but only as an introductory service. If your organization wants to put data online for the public, you are welcome to use this as an introductory service.” 23
  • 24.
    Users must downloadsoftware Robust “Community” section O ers best practices on visualization Does not store datasets, but links to publicly available data. Allows users to share and comment 24
  • 25.
    m Many  Eyes “Data visualisation tools from IBM. Site allows users to upload data and then produce graphic representations for others to view and comment upon.” 25
  • 26.
    m Many  Eyes Robust “Community” section Users can upload their own data Users can share data sets Allows users to share their viz Many good looking viz options 26
  • 27.
    “Data visualization worksso well because the human brain is extremely well-equipped to process visual information. We can capture patterns and essential themes in huge data sets very, very quickly through visual means. Unfortunately, the tools to create these visual representations are usually too expensive and di cult for smaller news organizations and everyday citizens to use, creating a gap for the future of community journalism. With the generous support of the Knight Foundation, we created VIDI, a suite of powerful intuitive Drupal data-visualization modules for anyone to use on any standard set of data ranging from government databases to demographics and statistics. Jack Knight called for media to inform and enlighten, so the people might determine their own true interests. As we come to understand his exhortation’s new, evolving meaning, we must continually challenge ourselves to break down professional barriers in order to empower the in nite diversity of equally true interests. “Raw Data Now” should be our battle cry, and open-source data visualization modules our weaponry. Visualize the power of data!” 27
  • 28.
    Developed speci callyfor Journalists Users must identify data sets To share, users must have a Drupal-based website The best looking visualizations are created through Google API Tool is set up to visualize by selecting “Time”, “Geo” or “Comparative” data Requires some technical skill and data literacy 28
  • 29.
    “The Global CityIndicators Program provides an established set of city indicators with a globally standardized methodology that allows for global comparability of city performance and knowledge sharing. This website serves all cities that become members to measure and report on a core set of indicators through this web-based relational database.” 29
  • 30.
    Allows for cityto city comparison Allows comparisons of “peer cities” Could have useful data for City Forward visualizations Many cities do not have data Reports are only in “chart” form 30
  • 31.
    What’s Next? The futureof urban data: More Data Better Data Better Use of Data More Collaboration Amongst Professions 31
  • 32.
    What’s Next? City Forwardis currently the only tool with the following features: Extensive City-level data Storage of datasets on the City Forward website City comparison features using city-reported data Global scope at the city level Thinking about: How to Scale the number of cities and data sets included User experience redesign, built around cities as hubs City Forward as a data literacy tool 32
  • 33.
    Data Literacy Accessing, understandingand processing data will be key to accessing the best opportunities in cities in the 21st century Where to send the kids to school Where jobs are located and where they pay the most How to minimize energy consumption “We didn’t build libraries for a literate citizenry. We built libraries to help citizens become literate. Today we build open data portals not because we have public policy literate citizens, we build them so that citizens may become literate in public policy.” - David Eaves 33
  • 34.
    Challenge to theUrban Systems Collaborative What are we doing as a group to foster citizen interaction with data, increase data literacy, and improve the understanding of urban systems among the general public? Questions | Open Discussion 34