SlideShare a Scribd company logo
1 of 59
This is likely to be one of the most well-cited pictures of Earth
called “Blue
Marble”. It was taken on December 7, 1972, by the crew of the
Apollo 17
spacecraft. It has a distinct color of blue, because the Earth
uniquely carries
an atmosphere and 70% of the Earth’s surface is covered by the
ocean.
Atmosphere from Space
We can see our atmosphere even from space. In this figure, the
bright layer is
the atmosphere between space and Earth; both are shown here in
black.
Please note how thin the atmospheric layer is relative to Earth’s
diameter!
Another view
of the
Atmosphere
from Space
This is a zoomed-in image of the atmosphere. You will notice
that there is a
gradual color change ranging from a brownish color closer to
the Earth’s
surface that transitions to a pale blue and eventually fades into
space. The
atmosphere extends about 10,000km into space. There is no
exact top to the
atmosphere. Due to the Earth’s gravity, the number of
molecules, which
individually each carry mass, gradually decreases outward into
space. Most of
the gas molecules are within the lower atmosphere. 90% of the
atmosphere’s
mass is in its lower 10km and 99.9997% is within the lower
100km. You will
also notice that there are little blobs in the brownish colored
layer close to the
surface. This layer is called the troposphere, the lowest layer of
the
atmosphere ranging from 6-10km above sea level. This is where
we live,
clouds are formed, daily weather is observed, and the majority
of the
molecules exist. The blobs you see are seemingly giant
cumulonimbus – dense
towering clouds – often associated with thunderstorms.
Composition of the Atmosphere including
variable components (by volume)
The three elements that make up over 99.9% of the atmosphere
– nitrogen,
oxygen, and argon. These elements are abundant in the
atmosphere and have
many uses.
Pure nitrogen (N2) is used in its very cold, liquid state as it
boils at -195.8 C (or
-320F). Ted Williams, a baseball player who played for the
Boston Red Sox for
22 years, and deceased in 2002, is preserved in liquid nitrogen
since his family
members chose to have his remains frozen.
Pure oxygen (O2) is used to achieve higher temperatures, to
increase the
efficiency of waste incinerators. It is also used as an oxidizing
agent, and in
medical applications to assist and sustain a person’s respiratory
functions.
Argon (Ar) is a colorless, odorless, nontoxic, and nonreactive
gas. It creates
inert environments for growing crystals, often used in
semiconductors. It
protects materials against corrosion. It also fills the air space in
double-pane
insulating windows.
Earth’s climate system
and interactions of its
components
Two key ideas for this course, especially for the first half is:
1st: Climate is regulated by complex interactions amongst
components of
the Earth’s system.
2nd: Understanding climate change can be reduced to
understanding
how “the control knobs” function
Climate change
The knobs that control earth’s climate:
• Atmospheric composition (greenhouse effect)
• Amount of solar radiation (luminosity)
• What parts of Earth get radiation (orbit)
• Atmospheric and ocean circulation
• Earth’s albedo (fraction of solar energy reflected off earth’s
surface)
• Volcanoes
• Plate tectonics
Greenhouse Effect
We are here.
First, a bit about radiation . . .
How the control knobs work
Amount of energy reaching earth determines the climate.
Dominant source
of energy is sunlight, which when reaching Earth can heat the
land, ocean,
and atmosphere.
If a chunk of matter oscillates and interacts with light at all
possible
frequencies, it is called blackbody. And the light (energy) that
is emitted by
a blackbody is called blackbody radiation. In this manner,
although
“blackbody” is originally named for an ideal object, we
consider the Earth
as a blackbody. In fact, many objects that radiate energy back
when they
are heated are considered as a blackbody.
The Greenhouse Effect
Greenhouse gases don’t “trap”
heat; they absorb heat and re-
radiate it out to space and back
to Earth.
So, some of that sunlight is reflected back to space by the
Earth’s surface,
clouds, or ice. But much of the sunlight that reaches Earth is
absorbed and
warms the planet. When Earth emits the same amount of energy
that it
absorbs, its energy budget is in balance, and its average
temperature
remains stable.
The discrepancy between incoming solar energy and outgoing
radiation
energy is the greenhouse effect. Earth’s atmosphere contains
greenhouse
gases (e.g. CO2, CH4, etc.) that absorb 95% of the longwave
(we will learn
more about this later) back radiation emitted from the surface.
Earth’s radiation budget
Here is a breakdown of the numbers…
Solar radia)on arriving at the top of Earth’s atmosphere
averages 342 W/m2,
indicated here as 100% (upper leB). About 30% of the incoming
radia)on is
reflected and scaHered back into space, and the other 240 W/m2
(70%) enters
the climate system. Some of this entering radia=on warms
Earth’s surface
and causes it to radiate heat upward (right). The greenhouse
effect (lower
right) retains 96% of the heat radiated back from Earth’s heated
surface and
warms Earth by 31 C
̊ .
410
http://berkeleyearth.org/2018-
temperatures/
(Upper figure) Mean global air temperature variation from 1850
to 2018
In 2018, 9 of the 10 warmest years have occurred since 1990.
(Lower figure) Atmospheric CO2 variation during the same
interval
From 1960 to present: the atmospheric CO2 concentration has
been
measured in Mauna Loa, Hawaii. Before 1960, the CO2
concentration is a
reconstructed value based upon CO2 preserved in ice cores.
Ice core records
Temp.
CO2
Dust
Annually
laminated
bands
within ice
core
Thousands of years ago
Why do we use ice core records instead of observed data (which
seems to
be the more direct and reliable approach)?
This is because, unfortunately, we only have a limited number
of observed
records for us to understand the natural cycle of the Earth’s
climate – most
of the data are available only for the past 50 years of which a
few extend
past a couple hundred years. This means, for instance, if we
would like to
discuss our climate system in relation to the El Nino cycle,
which likely
occurs every 3-5 years on average, we can only refer to a few of
those
events. For this reason, we need a longer record than the
observational
record.
By using ice core records, as shown in this figure, we can study
and argue
climate/environmental variability of the past 400,000 years. If
the ice core
preserves annual layers (like tree rings), the record you are
looking at is
basically a sub-seasonal resolution of climate variability.
Climate Change in New England
Weider and Boutt, 2010
What is happening in New England?
This figure shows 12 month moving averages of temperature
data
measured at 43 observational sites across New England between
1920 and 2009. Please note that this data is an average of 12
months, and any seasonal variability is expressed much less
obvious.
There maybe a warming trend? This may be correct. However,
importantly, local temperature variability can be quite different
from
global temperature variability – it maybe even cooling in some
areas.
Receding mountain glacier due to recent warming.
0
1000
2000
3000
4000
5000
6000
7000
1000 1200 1400 1600 1800 2000
P
op
ul
at
io
n
(M
ill
io
ns
)
Time (Years)
World Population
(http://www.census.gov/ipc/www/idb/worldpopinfo.html)
1967
1920
1850
Today 7 billion
Is this temperature trend related to population growth?
Popula'on growth
If so, what will the future population be?
Check today’s population:
https://www.census.gov/popclock/
MMD-A1B 2080-2099 vs 1980-1999 IPCC 2007
Effects on Agriculture and the Ocean?
Also figures from the IPCC (Intergovernmental Panel on
Climate Change)
showing the discrepancy between simulated climate model
results 2080-2099
and observational data 1980-1999. Precipitation, soil moisture,
runoff, and
evaporation. Some areas experience drier conditions.
Source: IPCC 2007
Black line: observed temperatures
Blue: expected changes due to natural factors
Pink: expected changes due to natural factors plus greenhouse
gases
Comparison of observed continental- and global-scale changes
in surface
temperature with results simulated by climate models using
either natural or both
natural and anthropogenic forcings. Averages of observations
are shown for the
period 1906-2005 (black line) plotted against the center of the
decade and relative
to the corresponding average for 1901-1950. Lines are dashed
where spatial
coverage is less than 50%. Blue shaded bands show the 5 to
95% range for 19
simulations from five climate models using only natural
forcings due to solar
activity and volcanoes. Red shaded bands show the 5 to 95%
range for 58
simulations from 14 climate models using both natural and
anthropogenic forcings
(like CO2)
Change in Snow Depth CRCM-A2 2070
Results from another climate model showing changes in snow
depth in
North America.
An example of a positive feedback
Warming reduces the cover of snow and sea ice in the Arctic
from 2005
(right) to 2007 (left), increases the amount of heat absorbed by
exposed
water, reduces albedo, and thereby further warms the climate.
This is called
a positive feedback process.
We will learn more about “albedo” and “feedback process” later
this
semester.
November Arctic Ocean Ice Extent
Source: NSIDC
Monthly November ice
extent for 1979 to 2014
shows a decline of 4.7%
per decade relative to the
1981 to 2010 average.
Source: Steffen et al., 2008
Area of Melting on the Greenland Ice Sheet: increasing
Greenland ice sheet is also increasingly melting from 1979 to
2008.
Maps of maximum annual surface melt on the Greenland Ice
Sheet
derived from monthly ice surface temperature product of
Greenland
(2000-2016). Greenland ice sheet is also increasingly melBng!
A Multilayer Surface Temperature, Surface Albedo, and Water
Vapor Product of
Greenland from MODIS, April 2018, Remote Sensing
10(4):555,
DOI: 10.3390/rs10040555
This figure shows the amount of ice sheet lost in Greenland and
Antarctica
between 2002 and 2009.
Velicogna (2009), Geophysical Research Letters, v.36. L19503,
DOI: 10.1029GL040222
https://www.antarcticglaciers.org/2020/01/what-is-the-ice-
volume-of-thwaites-glacier/
Ice streams of Antarctica
Recent observations show that
incursions of warm ocean water cause
melting of the undersides of floating ice
shelves in West Antarctica. This could
cause a rapid and irreversible rise in sea
level.
Reference: Hillenbrand, CD., Smith, J., Hodell, D. et
al. West Antarctic Ice Sheet retreat driven by
Holocene warm water incursions. Nature 547, 43–
48 (2017). https://doi.org/10.1038/nature22995
Our own UMass faculty, Prof. DeConto
published in Nature journal in 2021 a
suggestion that if emissions continue at
their current pace, by approximately
2060, the Antarctic Ice Sheet will have
crossed a critical threshold that will
cause irreversible global sea level rise
within a human timescale.
Reference: DeConto, R.M., Pollard, D., Alley, R.B. et
al. The Paris Climate Agreement and future sea-
level rise from Antarctica. Nature 593, 83–89
(2021). https://doi-
org.silk.library.umass.edu/10.1038/s41586-021-
03427-0
https://www.antarcticglaciers.org/2020/01/what-is-the-ice-
volume-of-thwaites-glacier/
https://doi-org.silk.library.umass.edu/10.1038/s41586-021-
03427-0
Future Sea Level?
If we lose all ice in the world – what will happen to the sea
level?
Bamber et al., 2009
A simula)on model result shows what happens to the sea level,
if all sea
ice/con)nental ice (ice sheet) fully collapsed. Most of the
northern
hemisphere experiences an increase in sea level of over 1 m.
What happens
with 1 m sea
level rise?
Here are links that include recent research outcome about ice
loss from
Earth’s ice sheets. Check out the amazing and disturbing videos
in this NASA
briefing….
Snow over Antarctica Buffered Sea Level Rise during Last
Century
https://go.nasa.gov/2GeaWZb
Carbon Brief.org
http://www.carbonbrief.org/blog/2015/08/new-nasa-videos-
show-stark-ice-
loss-from-earths-ice-sheets/
Annual Arctic sea ice minimum 1979-2018 with area graph
https://climate.nasa.gov/climate_resources/155/video-annual-
arctic-sea-
ice-minimum-1979-2018-with-area-graph/
Antarctic ice loss: 2002-2016
https://climate.nasa.gov/climate_resources/154/video-antarctic-
ice-loss-
2002-2016/
https://t.co/9metgs5qRp
http://www.carbonbrief.org/blog/2015/08/new-nasa-videos-
show-stark-ice-loss-from-earths-ice-sheets/
https://climate.nasa.gov/climate_resources/155/video-annual-
arctic-sea-ice-minimum-1979-2018-with-area-graph/
https://climate.nasa.gov/climate_resources/154/video-antarctic-
ice-loss-2002-2016/
Changes in Medical Education
Scenario
Imagine you are a medical apprentice in the 1800s. Envision
your medical training during this era under the apprenticeship
model. Jump to the 1960s and envision your training under the
academic model. Finally, think of what your medical school
training might look like today.
Of particular interest for today’s training are the many
technology innovations for learning in medical schools,
including augmented reality (AR), virtual reality (VR), robotic-
assisted surgery, and minimally or noninvasive procedure
technologies. Today’s training features remote patient
monitoring (RPM) and telemedicine through a virtual model of
care (VMC), as well as learning to use the human genome for
more accurate diagnosing and patient-specific treatments.
Instructions
Write a 3–4 page paper to analyze the scope of change in
medical education from the 1800s to today, the apprenticeship
and academic models, and the importance of understanding the
history in order to help improve medical education in the future.
Do the following:
1. The textbook is suggested as the most efficient resource for
this assessment, or use other resources from those provided with
this assessment. You may also use resources you find on your
own from the History of Health Care Research tab in the Health
Care Administration Undergraduate Library Research Guide to
research the history of medical education from the 1800s,
1960s, early 2000s, and today.
. You will need to include four references in your paper, one of
which can be your textbook.
. Use the course resources provided for the remaining
references, or locate your own resources.
· Write an introduction to your paper using the Changes in
Medical Education Template [DOCX].
. Include a brief explanation of the purpose of the paper and its
main ideas.
. Refer to the Writing Support page on Campus for resources to
help you as you write and revise your paper.
· In The Changing Scope of Medical Education section of the
assessment template, analyze the scope of the changes in
medical education from the 1800s to today.
. How widespread are the newer technologies impacting medical
training?
. Have there been mandated changes or have there been cultural
changes that have impacted medical education?
· In the Apprenticeship Model vs. Academic Model section of
the assessment template, compare and contrast the
apprenticeship and academic models of medical education in the
1800s, 1960s, 2000s, and today.
. Describe the apprenticeship model and the academic model.
. Compare and contrast the similarities and differences in their
features.
. Analyze how the models have evolved over time and the
impact the evolution of these models has had on the quality of
patient care.
· In the Importance of Understanding History of
Medicine section of the assessment template, explain the
importance of understanding the history of medical education in
order to help improve medical education in the future.
· Write a conclusion to your paper in which you summarize the
main themes you addressed.
· Cite all the resources you used in your paper in APA 7TH
Edition format.
Additional Requirements
· Your paper should be 3–4 pages, in addition to the title page
and references page.
· Double space and use Times New Roman, 12-point font, as is
provided in the template.
· Use a minimum of four resources; you may include the
textbook and other course resources.
· Respond to all parts of the template, using the headings
provided.
· Support all points with credible evidence, in the form of APA
citations.
· Include a references page in APA format with appropriate
citations.
Competencies Measured
By successfully completing this assessment, you will
demonstrate your proficiency in the following course
competencies and scoring guide criteria:
· Competency 3: Analyze the development of medical education
in the United States.
. Analyze the scope of change in medical education from the
1800s to today.
. Compare and contrast the apprenticeship model and the
academic model of medical education.
. Analyze the impact of the evolution of the models on patient
care.
. Analyze why it is important to understand the history of
medicine in order to improve medical education.
· Competency 4: Communicate in a manner that is scholarly,
professional, and respectful of the diversity, dignity, and
integrity of others.
. Articulates meaning relevant to the main topic, scope, and
purpose of the prompt.
. Applies APA formatting to in-text citations and references.
2
3
Changes in Medical Education
Your Full Name (no credentials)
Capella University
BHA-FPX4002: History of the United States Health Care
System
Instructor’s Name
Date
Changes in Medical Education
Write your introduction here. Include a brief explanation of the
purpose of the paper and its main ideas.The Changing Scope of
Medical Education
Analyze the scope of change in medical education from the
1800s to today. How widespread are the newer technologies
impacting medical training? Have there been mandated changes
or have there been cultural changes that have impacted medical
education?
Apprenticeship Model vs. Academic Model
Description and Comparison of Both Models
Describe both the apprenticeship and academic models of
medical education in the 1800s, 1960s, early 2000s, and today.
Compare and contrast the features of both models.
Analysis of Evolution and Impact
Analyze how the two models have evolved over time and
the impact the evolution of these models has had on the quality
of patient care.
Importance of Understanding History of Medicine
Explain why it is important to understa nd the history of medical
education in order to help improve medical education in the
future. Be sure to provide examples that illustrate your point.
Conclusion
Summarize the main themes of your paper.
References
(Include a minimum of four resources, all of which must be
cited in the body of your paper.)
Young, K. M., & Kroth, P. J. (2018). Sultz & Young's health
care USA: Understanding its organization and delivery (9th
ed.). Jones & Bartlett Learning.
Historical Health Care Trend Analysis
In this assessment, you will review the private and public health
legislation, regulatory agencies, and quality initiatives that have
catapulted the United States into the quality revolution that we
are experiencing today. As this quality revolution continues,
health care professionals can expect to see more innovations
contributing to individual patient and population health quality
initiatives, with many more regulations to come.
Scenario
You are a health care educator for a large integrated
accountable care organization (ACO). You are tasked to work
with a group of hospital executives to identify milestone events
for three eras, the 1800s, 1900s, and 2000s, and identify trends
from those events that impacted the health care industry. The
trend analysis will consist of three critical measures: access,
quality, and costs. Milestone events and trends identified for
these three measures over time should include legislation,
regulatory agencies, and quality initiatives in the various time
periods. The final paper will be used in an annual strategic
planning session attended by the ACO and hospital executives
to demonstrate how the quality movement has evolved into a
quality revolution.Instructions
Write a 2–3-page paper in which you explain and analyze health
care regulations and medical practice evolutionary changes for
access, quality, and cost, including the significant milestone
events from different time periods.
Complete the following:
1. References and citations:
. You are required to reference a total of three scholarly
sources in your paper.
. Be sure to cite these references within the body of your paper
correctly using APA style citations. Refer to Evidence and
APA in the Capella Writing Center for help with using APA
style.
· Complete the Trend Analysis Table: Evolution of Access,
Quality, and Cost in Health Care in the appendix for the
assessment template.
. For each time period, select 2 milestone events or regulations
. There should be a total of 18 milestone events or regulations
in the completed table.
. Include bullet points with notes that describe each event or
regulation and how it impacted access, quality, or cost.
· Write an introduction for the paper using the Historical Health
Care Trend Analysis Template [DOCX].
. Provide a brief explanation of the purpose of this historical
trend analysis and how it might be used in your work as a health
administrator (1 paragraph).
· Use the Trend Analysis Table: Evolution of Access, Quality,
and Cost in Health Care table to write the body of your paper.
. Complete the Trends and Regulations section in the assessment
template.
. Provide a brief description of the key measures of health care
services, which are access, quality, and cost (1–2 paragraphs).
. In the Health Care Access subsection, explain the significant
trends and regulatory milestones associated with access to
health care over the recent eras (1–2 paragraphs).
. What U.S. legislation, regulatory agencies, and quality
initiatives from the 1800s, 1900s, and 2000s have influenced
access to health care services in the United States?
. What does your milestone trend analysis reveal for access to
care?
. Include citations and references to specific regulations, events,
or agencies.
· In the Health Care Quality subsection, explain the significant
trends and regulatory milestones associated with health
care quality over the recent eras (1–2 paragraphs).
. What U.S. legislation, regulatory agencies, and quality
initiatives from the 1800s, 1900s, and 2000s have influenced
care quality in health care services in the United States?
. What does your trend analysis reveal for care quality?
. Include citations and references to specific regulations, events,
or agencies.
· In the Health Care Cost subsection, explain the significant
trends and regulatory milestones associated with access to
health care costs over the recent eras (1–2 paragraphs).
. What U.S. legislation, regulatory agencies, and quality
initiatives from the 1800s, 1900s, and 2000s have affected
health care costs for medical services?
. What does your trend analysis reveal for medical service
costs?
. Include citations and references to specific regulations, events,
or agencies.
· Complete the Trend Analysis section of the assessment
template (1–2 paragraphs).
· Analyze the trends and regulations in health care access,
quality, and cost to draw conclusions about the evolution of
health care regulations and practice throughout the recent eras.
· Describe professional experiences or examples to illustrate the
trends.
·
· Write the conclusion for the paper (1 paragraph).
· Briefly restate the trends revealed for health care access,
quality, and cost.
· Draw a conclusion about how the milestones, regulations, and
changes have improved, been neutral, or inhibited progress of
the U.S. health care system.
· Summarize clear and concise conclusions of your trend
analysis. Additional Requirements
· Your paper should be 2–3 pages, in addition to the title page,
appendix, and references page.
· Double space your paper, and use Times New Roman, 12-point
font, as indicated in the assessment template.
· Use a minimum of three resources. This may include your
textbook and other course resources.
· Complete all parts of the assessment template, using the
headings provided in the template.
· Support all points with credible evidence, in the form of APA
citations.
· Include a references page in APA format with appropriate
citations.
· Complete the Trend Analysis Table: Evolution of Access,
Quality, and Cost in Health Care in the appendix of the
assessment template.Competencies Measured
By successfully completing this assessment, you will
demonstrate your proficiency in the following course
competencies and scoring guide criteria:
· Competency 1: Analyze trends in the U.S. health care system
from a historical perspective.
. Identify health care legislative, regulatory agency, and quality
initiative events in a trend analysis table of different eras.
· Competency 2: Explain the development of health regulation
and the evolution of medical practice.
. Explain the significant trends and regulatory milestones
associated with access to health care over the recent eras.
. Explain the significant trends and regulatory milestones
associated with health care quality over the recent eras.
. Explain the significant trends and regulatory milestones
associated with health care costs over the recent eras.
. Analyze the trends and regulations in health care access,
quality, and cost to draw conclusions about the evolution of
health care regulations and practice throughout the recent eras.
Comparative Analysis: Physician Practice Evolution
EXAMPLE PAPER
Learner’s Name
School of Business, Technology, and Health Care
Administration, Capella University
BHA4002/BHA-FPX4002: History of the United States Health
Care System
Capella Instructor’s Name
Date
Note: This is an example paper written on the evolution of
physician practices. The actual assessment is a comparative
analysis of the evolution of hospitals.
2
Example-only Comparative Analysis Paper
© Capella University, Not for Distribution
Comparative Analysis: Physician Practice Evolution
In this comparative analysis report, the evolution of physician
practice is reviewed from the 1800’s
through the 2000s. The purpose of this report is to show the
progress of how physician practices, their
staff and payment systems have changed over the last three
centuries. The irony is that they have
changed, and they have also gone full circle as explained below.
In the 1800 and 1900 centuries, the relationship with the
physician was very personal and patient-
centered. The physician knew everything about their patient,
and the patient knew everything about their
hometown physician. As medicine evolved, physicians became
more specialized, and focused on specific
diseases. This often removed that personal relationship between
physician specialist and patient. The
irony is that the 2019 COVID pandemic put a spotlight once
again on the primary care physician-patient
relationship, but in a much broader context. The pandemic
showed us the importance of the primary and
community healthcare (P&CHC) systems focus (Lauriola, et al.,
2021). The pandemic revealed a
weakness in P&CHC worldwide, i.e., it put a focus on hospital
and intensive care beds and not on
community and primary care. In Lauriola et al. (2021), the
authors propose that the pandemic has shown
us that P&CHC is where the focus needs to be though local
community problem-solving to safeguard
communities, which brings us back to the primary care
physician and infrastructure at the community
level, but in a context of global world health (Lauriola et al.,
2021).
Comparative Grid and Analysis
In Appendix A, the table entitled The Physician Practice
Evolution and Changes shows how the
physician practice has progressed. There are several major
milestones that stand out in the table which
includes the evolution of the physicians’ offices, the training of
their staff, and how they were paid
compared to payment systems today.
The Physician Practice
In the 1800s, physicians would often go to see the patient at
their home (Nespor, 2009).
Physicians were solo practitioners around the turn of the 19th
century. By the mid-1900s physicians were
more likely to be in a group practice of two or more providers
(Kroth & Young, 2018). In the early 1990s,
healthcare markets began to consolidate nationwide due to
rising healthcare costs and reduced
reimbursement. By the 1990s group practices began to integrate
horizontally into Independent Practice
3
Example-only Comparative Analysis Paper
© Capella University, Not for Distribution
Associations (IPAs) (Kroth & Young, 2018). The IPAs then
vertically integrated with hospitals and formed
Physician-Hospital Organizations (PHOs). The PHOs were
established to retain and gain market share
through managed care contracting and used shared purchasing
groups to achieve cost-savings (Kroth &
Young, 2018; Williams & Cuneo,1997).
Physician Staff
In the 1800s, the physician most often worked as a solo
practitioner without an assistant. If they
had an assistant, it was someone that they personally trained
(Nespor, 2015). By the 1960s, due to
population growth and the demand for health services,
physicians time became a scarce commodity, and
the nurse practitioner movement began (Kroth & Young, 2018).
This movement persists today because of
population demand and the projected physician shortages
(AAMC, 2021).
Payment Systems
From the 1800s to the early 1900s, physicians were paid in
small amounts of cash, or in food
and services from their patients (Allen, 2016). As healthcare
costs rose between 1960-2000, physicians’
fees declined. The physicians’ reimbursement changed from fee-
for-service to discounted fee-for-service
and capitation (Kroth & Young, 2018). Capitation is a flat
prepaid fee to providers per member per month
(PMPM) from the managed care organizations (MCOs) (Kroth &
Young, 2018).
Comparative Analysis Summary
In the 1800s, the physician’s office was often their home. By
the 1960s offices were centrally
located and often group practices with two or more physicians.
In the 1800, physicians extenders did not
exist. In the 1960s and still today the educational programs for
NP and PA are well established and the
physician extender, working under the supervision of the
physician, is common.
One of the biggest changes in the physician practice has been
in the reimbursement for their
services. In the 1800s, physicians received payment in cash or
food and services. Blue Cross (BC) was
established in 1929, Medicare and Medicaid in 1965 as fee for
service payers. However, by the early
1990s markets consolidated and managed care organizations
were on the rise promoting care quality and
cost containment.
4
Example-only Comparative Analysis Paper
© Capella University, Not for Distribution
Conclusion
In conclusion, the evolution of the physicians practice has been
progressively positive, and the
improvements have established higher quality of care in medical
practices today. The changes in the
physician’s medical practice have been and will continue to be
dynamic and persistent. However, the
medical industry is unable to ignore what the 2019 COVID
pandemic has revealed, i.e., the importance of
the primary and community healthcare (P&CHC) systems focus.
Although, the primary care and specialty
care physicians will continue to manage patient care and
prevention at the community level they will need
to do so within a broader world-health context.
5
Example-only Comparative Analysis Paper
© Capella University, Not for Distribution
References
Allen, E. (2016, April 28). Paying the doctor in 18th-century
Philadelphia. Library of Congress.
https://blogs.loc.gov/loc/2016/04/paying-the-doctor-in-18th-
century-philadelphia/
Association of American Medical Colleges. (2021, June 11).
AAMC report reinforces mounting physician
shortage. https://www.aamc.org/news-insights/press-
releases/aamc-report-reinforces-mounting-
physician-shortage
Berenson, R. A., & Rich, E. C. (2010). US approaches to
physician payment: The deconstruction of
primary care. Journal of General Internal Medicine, 25(6), 613–
618.
https://doi.org/10.1007/s11606-010-1295-z
Kroth, P. J., & Young, K. M. (2018). Sultz & Young's health
care USA: Understanding its organization and
delivery (9th ed.). Jones & Bartlett.
Lauriola, P., Martín-Olmedo, P., Leonardi, G. S., Bouland, C.,
Verheij, R., Dückers, M., van Tongeren, M.,
Laghi, F., van den Hazel, P., Gokdemir, O., Segredo, E., Etzel,
R. A., Abelsohn, A., Bianchi, F.,
Romizi, R., Miserotti, G., Romizi, F., Bortolotti, P., Vinci, E.,
Giustetto, G., … Zeka, A. (2021). On
the importance of primary and community healthcare in relation
to global health and
environmental threats: lessons from the COVID-19 crisis. BMJ
Global Health, 6(3), e004111.
https://doi.org/10.1136/bmjgh-2020-004111
Nespor, C. (2009, March 11). 19th century doctors in the U.S.
Melnick Medical (History) Museum.
https://melnickmedicalmuseum.com/2009/03/11/19th-century-
doctors-in-the-us/
Nespor, C. (2015, October 28). Doctors’ offices. Melnick
Medical (History) Museum.
https://melnickmedicalmuseum.com/tag/doctors-offices/
Williams, W. C., III, & Cuneo, K. F. (1997). Physician-hospital
organizations and PHO executives. What
lies ahead for the PHO? Physician Executive, 23(2), 13–15.
http://web.b.ebscohost.com.library.capella.edu/ehost/
6
Example-only Comparative Analysis Paper
© Capella University, Not for Distribution
Appendix A
The Physician Practice Evolution and Changes
Theme 1800s 1960s 2000s
The
Physician’s
Office
• Often the
providers home
• Often the patients
home (Nespor,
2009).
• Single Physician
Office (Nespor,
2009).
• Small group
Practice of 2-4
physicians (Kroth
& Young, 2018).
• Independent Physician
Associations (IPAs).
• Consolidation of market
with larger physician
groups contracted with
Hospitals, i.e., Physician
Hospital organizations
(PHOs). (Kroth & Young,
2018).
The
Physician
Assistant
• None with formal
training.
• Trained by the
physician to assist
them (Nespor,
2015).
• Office staff, may
include RN, LPN,
or MA
• Often trained by
the physician to
assist them
(Kroth & Young,
2018).
• Specialization, Physician
extenders, Nurse
practitioners (NP) and
Physician Assistants
(PA)
• Lab Technicians,
Radiology Technologists
(Kroth & Young, 2018).
The
Physician
Payment
Systems
• Small cash
payments
• Goods, such as
coffee, tea, wine,
and beer; and
services such as
carpentry, painting
and so on were
offered as
payment (Allen,
2016).
• Fee-for-Service:
Private pay.
• Early insurance
payments form
BCBS (1929),
• 1965 and
beyond,
Medicare and
Medicaid (Kroth
& Young, 2018).
• Medicare Physicians Fee
Schedule (PFS),
Resource-Based
Relative Value Scale
(RBRVS),
• Capitation, one fee per
member per month
(PMPM) (Kroth & Young,
2018).
Historical Trend Analysis
Your Full Name (no credentials)
Capella University
BHA-FPX4002: History of the United States Health Care
System
Instructor’s Name
1
2
Date
Historical Trend Analysis
Write your introduction here. Provide a brief explanation of the
purpose of this historical trend analysis and how it might be
used in your work as a health administrator (1 paragraph).
Where appropriate, reference significant health care milestones,
regulations, and measures for access, quality, and cost.
Trends and Regulations
Provide a brief description of the key measures of health care
services, which are access, quality, and cost (1–2 paragraphs).
Health Care Access
Explain why access to health care is important and what it
means. What U.S. legislation, regulatory agencies, and quality
initiatives for the 1800s, 1900s and 2000s have influenced
access to health care services in the United States. What does
your milestone trend analysis reveal for access to care? (1–2
paragraphs)
Health Care Quality
Explain what quality health care is and why it is important.
What U.S. legislation, regulatory agencies, and quality
initiatives for the 1800s, 1900s and 2000s have influenced care
quality in health care services in the United States. What does
your trend analysis reveal for care quality? (1–2 paragraphs)
Health Care Cost
Explain what health care cost is and why it is important.
What U.S. legislation, regulatory agencies, and quality
initiatives for the 1800s, 1900s and 2000s have affected health
care costs for medical services. What does your trend analysis
reveal for medical service costs? (1–2 paragraphs)
Trend Analysis
Analyze the trends and regulations in health care access,
quality, and cost to draw conclusions about the evolution of
health care regulations and practice throughout the recent eras
(1–2 paragraphs). Describe professional experiences or
examples to illustrate the trends. Include citations and
references to specific regulations, events, or agencies.
Conclusion
Summarize clear and concise conclusions of your trend analysis
(1 paragraph). What are the trends revealed for health care
access, quality, and cost? Draw a conclusion about how the
changes have improved, been neutral, or inhibited progress of
the U.S. health care system.
References
Kroth, P. J., & Young, K. M. (2018). Sultz & Young's health
care USA: Understanding its organization and delivery (9th
ed.). Jones & Bartlett.
Appendix
Trend Analysis Table: Evolution of Access, Quality, and Cost in
Health Care
Milestones
Health Care Access
Health Care Quality
Health Care Costs
1800s
Regulatory Legislation, Agencies, or Quality Initiatives
Year, Milestone
· Note
· Note
Year, Milestone
· Note
· Note
Year, Milestone
· Note
· Note
Year, Milestone
· Note
· Note
Year, Milestone
· Note
· Note
Year, Milestone
· Note
· Note
1900s
Regulatory Legislation, Agencies, or Quality Initiatives
Year, Milestone
· Note
· Note
Year, Milestone
· Note
· Note
Year, Milestone
· Note
· Note
Year, Milestone
· Note
· Note
Year, Milestone
· Note
· Note
Year, Milestone
· Note
· Note
2000s
Regulatory Legislation, Agencies, or Quality Initiatives
Year, Milestone
· Note
· Note
Year, Milestone
· Note
· Note
Year, Milestone
· Note
· Note
Year, Milestone
· Note
· Note
Year, Milestone
· Note
· Note
Year, Milestone
· Note
· Note
Evolution of the Hospital Industry: A Comparative Analysis
Your Full Name (no credentials)
Capella University
BHA-FPX4002: History of the United States Health Care
System
Instructor’s Name
Date
2
2
Evolution of the Hospital Industry: A Comparative Analysis
Write your introduction here. Include a brief explanation of the
purpose of the paper and main ideas. Reference significant
trends that you noticed as appropriate (1 paragraph).
Hospital Care Evolution
Provide a brief overview of the evolution of hospital care from
the 1800s to the 1960s to today (1 short paragraph).
Hospital Environment
Describe your findings about hospital environme nts from the
1800s, 1960s, and 2000s
(1 paragraph).
Staff Education
Describe your findings about hospital environments from the
1800s, 1960s, and 2000s
(1 paragraph).
Level of Care
Describe your findings about hospital environments from the
1800s, 1960s, and 2000s
(1 paragraph).
Paying for Your Care
Describe your findings about hospital environments from the
1800s, 1960s, and 2000s
(1 paragraph).
Comparative Analysis
Write a brief summary of your comparisons and analysis about
the significance of the key changes from the different time
periods. Draw conclusions about how the hospital industry has
evolved from the 1800s, to the 1960s, to today, and about the
significance of the key milestones from the different time
periods. Give specific examples of the impact on the quality of
patient care during these time frames (1–2 paragraphs).
Conclusion
Summarize clear and concise conclusions drawn from your
comparisons and analysis about the different time periods and
the hospital environment, staff education, level of care, and
payment for care topics. Explain why it is important to study
the history of hospital care for your profession (1 paragraph).
References
(Include a minimum of three resources, all of which must be
cited in the body of your paper.)
Young, K. M., & Kroth, P. J. (2018). Health care USA:
Understanding its Organization and delivery (9th ed.). Jones &
Bartlett Learning.
Appendix
Comparative Analysis Table: Hospital Care Evolution
Instructions: Fill in the chart with bullet points that describe the
key milestones (events, regulations, laws, etc.) and the
supporting details to explain the topics in each cell. Use your
textbook and at least two other resources from the course
resources for this assessment or your own research, and
document where you found the information using accurate APA
citations.
Subject/Topic
1800s
1960s
2000s
Hospital Environment
(Describe the overall hospital environment.)
Medical Staff Education Level
(Describe the care providers and their education levels.)
Level of Care
(Describe the quality of care for each century and if it
improved.)
Paying for Care
(Describe how care was paid for.)
Evolution of the Hospital Industry: A Comparative Analysis
Instructions
Write a 2–3 page paper about the similarities and differences in
hospital care from the different time periods (1800s, 1960s, and
today), as well as the conclusions you drew from your analysis.
Include a research table in the appendix of your paper.
Complete the following:
1. Research how the hospital industry has evolved in terms of
hospital environment, medical staff education, level of care in
hospitals, and payment systems.
. You will need to reference a total of three scholarly sources in
your paper.
. Be sure to cite these references within the body of your paper
correctly using APA 7th Edition style citations.
· Complete the Comparative Analysis Table: Hospital Care
Evolution, located in the appendix of the Comparative Analysis
Template [DOCX].
. Provide two descriptive changes for each time period under
each of the headings.
. Add bullet points to each cell in the table to document the
descriptive changes that you have found for each topic.
. Document the source where you found the information for
each cell in the table, using APA-style citations.
· Write an introduction to the paper using the Comparative
Analysis Template [DOCX].
. Include a brief explanation of the purpose of the paper and
main ideas.
. Reference significant trends that you noticed as appropriate.
. Refer to the Writing Support page on Campus for resources to
help you as you write and revise your paper.
· Write the body of the paper.
. Write the Hospital Care Evolution section in the assessment
template, using the information from the Comparative Analysis
Table you completed.
. Describe your findings about each topic in the different time
periods under each subtopic heading.
. Explain the trends in hospital environment, medical staff
education, level of care in hospitals, and the payment systems in
a short paragraph (3–4 sentences) for each topic, using the
subheadings provided in the assessment template.
. Cite all references used within the body of your paper using
APA-style citations.
· Write the Comparative Analysis section (1–2 paragraphs) in
the assessment template.
. Write a brief summary of your comparisons and analysis about
the significance of the key changes from the different time
periods.
. Draw conclusions about how the hospital industry has evolved
from the 1800s to the 1960s to today and about the significance
of the key milestones from the different time periods.
. Give specific examples of the impact on the quality of patient
care during these time frames.
· Write a conclusion paragraph where you summarize the main
ideas included in the paper.
· Explain why it is important to study the history of hospital
care for your profession.
Additional Requirements
· Your paper should be 2–3 pages, in addition to the title page,
appendix, and reference page.
· Double space your paper, and use Times New Roman, 12-point
font, as indicated in the assessment template.
· Use a minimum of three resources.
· Complete all parts of the assessment template, using the
headings provided in the template.
· Support all points with credible evidence, in the form of APA
citations.
· Include a references page in APA format with appropriate
citations.
· Complete the Comparative Analysis Table: Hospital Care
Evolution table in the appendix of the assessment template.
Competencies Measured
By successfully completing this assessment, you will
demonstrate your proficiency in the following course
competencies and scoring guide criteria:
· Competency 1: Analyze trends in the U.S. health care system
from a historical perspective.
. Compare and contrast the hospital environments of the 1800s,
1960s, and today.
. Compare and contrast the level of care provided in hospitals of
the 1800s, 1960s, and today.
. Compare and contrast the payment systems in the hospitals of
the 1800s, 1960s, and today.
. Draw conclusions about how the hospital industry has evolved
from the 1800s, to the 1960s, to today.
· Competency 3: Analyze the development of medical education
in the United States.
. Compare and contrast the staff education level in hospitals of
the 1800s, 1960s, and today.
· Competency 4: Communicate in a manner that is scholarly,
professional, and respectful of the diversity, dignity, and
integrity of others.
. Appropriately addresses all components of the assessment
prompt, using the assessment description to structure text.
. Apply APA 7th Edition formatting to in-text citations and
references.
Arctic Climate Change
The difference during summer
is increasing as the sea ice
extension is decreasing in
relation to the recent past.
http://nsidc.org/arcticseaicenews/
In lecture 1, we learned about the seasonal migration of Arctic
sea ice extension. In this figure, it is very clear that 2012 was
exceptional because the Arctic sea ice during that summer was
at the greatest minimum ever observed, dropping far below the
mean of the long term trend. Let’s take a look what happened
after, particularly in 2016.
(National Snow and Ice Data Center)
This figure is based on a report of sea ice extension in
November
2016. At the end of summer in 2016, the minimum sea ice
extension was the second lowest after the 2012 extension (left
red arrow). As the season migrates and turns colder, the sea ice
did not grow back as fast as it should have relative to all
previously measured patterns (right red arrow). By November,
the
sea ice extension was the lowest ever recorded in November.
What was happening in 2016?
Daily mean temperatures for the Arctic area north of the
80th northern parallel. (Danish Meteorological Institute)
Arctic temperatures are about 20 degrees Celsius higher than
normal
above 80 degrees North Latitude! (Nov 2016).
This figure shows daily temperature measurements in the Arctic
at 80 degrees north in
2016 (red line) along with a computer simulation of temperature
patterns based on long-
term temperature measurements of the Arctic region (green
line). The blue line is the
point of freezing (0 degree Celsius). Please note that Y-axis
identifies temperature shown
in units Kelvin (K). Kelvin is a commonly used unit of
measurement in science for
temperature. Please see the following slide for more detail. The
X-axis identifies the
number of days in 2016. For example, the day 1 indicates
January 1st, and the day 365
equates to December 31st.
As you can see, there is seasonal variation. You will also notice
that, most of the year, the
temperature remains below the freezing level (blue line),
although it will slightly exceed
freezing for a short period of time during summer. In November
of 2016, the temperature
north of 80 degrees latitude was around -5 degrees C. This is
below freezing (not by
much), but is anomalous to the normal temperature of around -
25 degrees C (see vertical
blue dashed line). The temperature difference between the long
term mean (green line)
and the observed temperature (red line) was as great as 20
degrees!!
(continue)
(continued)
Why was this happening? Why did it happen in the Arctic? This
phenomenon is
known as polar amplification and it is important that we learn
about this
concept to understand how and why changes in our climate
system affect
different parts of the world unequally. For now, maintain an
awareness of polar
amplification as we will learn more about this concept in the
following weeks.
In the meantime, please take a moment to think about whether
such daily
temperature changes north of 80 degrees latitude are considered
“climate” or
“weather”?
Further, please check the latest news from Arctic Sea Ice News
and Analysis for
additional information: https://nsidc.org/arcticseaicenews/
A recent science study reports that
rapid warming in the Arctic is a likely
driver of the recent extreme winter
weather in the US.
https://www.science.org/doi/10.11
26/science.abi9167?utm_campaign
=SciMag&utm_source=Social&utm_
medium=Twitter
https://nsidc.org/arcticseaicenews/
https://www.science.org/doi/10.1126/science.abi9167?utm_cam
paign=SciMag&utm_source=Social&utm_medium=Twitter
Fahrenheit is a temperature scale based on one proposed in 1724
by the
German physicist Daniel Gabriel Fahrenheit. 0 F was the lowest
temperature
Dr. Fahrenheit could measure, 100 F is the average human core
body
temperature. In scientific measurement, Kelvin is more common
because by
definition 0 Kelvin is called absolute zero. Absolute zero is
theoretically the
lowest possible temperature where all molecules seize their
motion (almost no
heat is emitted by the molecule). In this slide, temperatures in
Fahrenheit,
Kelvin, and Celsius are compared in the same scale.
Weather Forecasting
• Weather affects nearly everyone, every day.
• Weather forecasts are issued:
o To save lives
o Reduce property damage
o Reduce crop damage
o To let the general public know what to expect
• Forecasts are often utilized to make many important decisions
on
a daily basis
• So how is it done, and how is it done correctly?
National Weather Service Mission:
• The NWS provides weather, hydrologic, and climate
forecasts and warnings for the US, its territories,
adjacent waters, and ocean areas for the protection
of life and property and the enhancement of the
national economy.
Tools available to a forecaster…
• Weather Observations
(including surface data, satellite data, and radar data)
• Commercial aircraft data
• Wind profilers
• Numerical Model Output
…There are a lot of sources for data!
Forecasting technique - Persistence
13Image from WW2010 Online Guide
The most primitive method of forecasting is to observe and
estimate that
there will be no changes to the present. Today is sunny,
therefore, tomorrow
will also be sunny. This may work relatively well in a dry and
arid region, but
does it work in the New England region? Probably not.
The Trend Technique
15Image from Meteorology Today by C. Donald Ahrens
Another method of forecasting that has been used in the more
recent past is to
understand trends. As we all know, however, weather systems
migrate from west
to east in the mid latitude, where we live, due to prevailing
wind called the
westerly (we will cover this in the following weeks). The
atmospheric pressure
system, in general, crosses over North America in 3 to 5 days.
With this, the
system travels approximately 800 miles per day. With this
understanding, we can
broadly predict when a storm will approach a specified region.
Can this be used
to make an accurate prediction? Although this maybe not be a
desirable way to
forecast for a long-term period, it may work for a shorter and
current time
interval.
The Analogue Technique
17
The analogue technique is a combination of climate and
weather. Based on long-
term observations, you might be able to identify a clear pattern
in the
atmospheric system. For instance, you may notice that,
statistically, when a dry
and cold weather pattern is observed in the northwest (high
pressure system),
there is a tendency for stormy weather in the northeast (low
pressure system).
This method could be useful and may produce relatively reliable
results for
slightly longer time periods (few days to a week).
Accuracy and skill in forecasting
After you learn about forecasting techniques, you may be asking
yourself
– what is an ”accurate” forecast?
• What is an accurate forecast?
o Your forecast for tonight’s minimum temp is 0F
If the actual minimum was 1F, is it inaccurate??
If the actual minimum was 10F, is it inaccurate??
o Accuracy (in forecasting) is arbitrary and relative – it is not
clearly or objectively defined.
19
Modern weather forecasts are based on model
forecasts
– Numerical Weather Prediction
In order to increase accuracy, we heavily rely on numerical
weather prediction.
• Predict the state of the atmosphere (e.g., pressure,
temperature, precip, winds, etc) in time
• Use mathematical equations – initialized with observational
data
…Why are models often wrong?
20
Problems with numerical modeling
21
• Models represent a “simplified” atmosphere – not every real
process in atmosphere can be resolved in models.
• Many are not global in coverage
• The initial atmospheric state is not well-known
• The data may also have errors in it
• The model equations compute quantities at grid points (30-
50km).
• The atmosphere is fundamentally chaotic!
So, the atmosphere is fundamentally chaotic and this is why
weather
forecasting, although state of the art, is still not perfect.
Therefore, in order
to understand the climate system, scientists focus on key
phenomena and/or
relationships that effectively control or alter the climate system
of the Earth.
Here, we call them the “climate knobs” and let’s talk more
about it in the
next lecture.
Here is a news from weather forecast development:
Artificial Intelligence May Be Key to
Better Weather Forecasts
Recent advances in machine learning
hold great potential for converting a
deluge of data into weather forecasts
that are fast, accurate, and detailed.
By Sid-Ahmed Boukabara, Vladimir
Krasnopolsky, Jebb Q. Stewart, Stephen
G. Penny, Ross N. Hoffman, and Eric
Maddy, 1 August 2019
https://eos.org/opinions/artificial-intelligence-may-be-key-to-
better-weather-forecasts
mailto:[email protected]
https://eos.org/opinions/artificial-intelligence-may-be-key-to-
better-weather-forecasts
https://www.ncdc.noaa.gov/billions/overview
“In 2021, there were 20 weather/climate disaster events with
losses exceeding $1 billion each
to affect the United States.” “Overall, these events resulted in
the deaths of 688 people and
had significant economic effects on the areas impacted.”
https://www.ncdc.noaa.gov/billions/overview
https://www.noaa.gov/news/2021-was-worlds-6th-
warmest-year-on-record
2021 was world’s 6th-warmest year says NOAA
https://medialibrary.climatecentral.org/resources/2020-in-
review-global-temperature-rankings
– Could we have predicted that 2021
would become the 6nd warmest year on
record or predict what 2022
temperatures will look like when the
report becomes available? The answer
is no. However, you can look into the
long-term trend and anticipate what
likely will happen in the future!
(weather vs climate)
https://www.noaa.gov/news/2021-was-worlds-6th-warmest-year-
on-record
https://medialibrary.climatecentral.org/resources/2020-in-
review-global-temperature-rankings
Please take a moment to read the article published in March
2017 about our
perceptions of climate change. This was before the catastrophes
caused by Hurricane
Harvey and Hurricane Irma in 2017.
How Americans Think About
Climate Change, in Six Maps
By NADJA POPOVICH, JOHN SCHWARTZ
and TATIANA SCHLOSSBERG
MARCH 21, 2017
https://www.nytimes.com/interactive/201
7/03/21/climate/how-americans-think-
about-climate-change-in-six-maps.html
https://www.nytimes.com/interactive/2017/03/21/climate/how -
americans-think-about-climate-change-in-six-maps.html
Example Test 1 question:
Climate differs from weather in that
A. climate is a broad composite of temperature
conditions, while weather addresses temperature
as well as precipitation, snow and ice cover, and
wind conditions.
B. climate change occurs over longer durations than
do weather changes.
C. climate change is exclusively global, whereas
weather is exclusively regional.
D. climate and weather do not differ, they are
interchangeable terms.
At last, here is an example questions in preparation for the test.
The
questions in test 1 will be similar in format to this question, but
not
necessarily the same question.
The answer is B.

More Related Content

Similar to This is likely to be one of the most well-cited pictures o

Clamate change introduction class 1.pptx
Clamate change introduction class 1.pptxClamate change introduction class 1.pptx
Clamate change introduction class 1.pptxLavanya943804
 
Climate change 101 - Introduction to Climate Change Science (UNDP presentation)
Climate change 101 - Introduction to Climate Change Science (UNDP presentation)Climate change 101 - Introduction to Climate Change Science (UNDP presentation)
Climate change 101 - Introduction to Climate Change Science (UNDP presentation)UNDP Eurasia
 
The Science of Climate Change r1.pdf
The Science of Climate Change r1.pdfThe Science of Climate Change r1.pdf
The Science of Climate Change r1.pdfKeith_Shotbolt
 
VCE Environmental Science - Greenhouse Effect
VCE Environmental Science - Greenhouse EffectVCE Environmental Science - Greenhouse Effect
VCE Environmental Science - Greenhouse EffectHawkesdale P12 College
 
Global warming faq
Global warming faqGlobal warming faq
Global warming faqnandanrocker
 
Energy Balance lecture 4................................ppt
Energy Balance lecture 4................................pptEnergy Balance lecture 4................................ppt
Energy Balance lecture 4................................pptMagrethJoseph
 
Global warming faq
Global warming faqGlobal warming faq
Global warming faqKavita Khati
 
Environmental changes kartavya.pptx
Environmental changes kartavya.pptxEnvironmental changes kartavya.pptx
Environmental changes kartavya.pptxKush564255
 
Introducation of global warming
Introducation of global warmingIntroducation of global warming
Introducation of global warmingneetusingh01
 
Geo pro
Geo proGeo pro
Geo projoremy
 
Earth Radiation Balance Project
Earth Radiation Balance ProjectEarth Radiation Balance Project
Earth Radiation Balance ProjectSuryaveer Singh
 

Similar to This is likely to be one of the most well-cited pictures o (20)

Clamate change introduction class 1.pptx
Clamate change introduction class 1.pptxClamate change introduction class 1.pptx
Clamate change introduction class 1.pptx
 
Global warming
Global warmingGlobal warming
Global warming
 
Hansen
HansenHansen
Hansen
 
Climate Change 2016
Climate Change 2016Climate Change 2016
Climate Change 2016
 
Climate change 101 - Introduction to Climate Change Science (UNDP presentation)
Climate change 101 - Introduction to Climate Change Science (UNDP presentation)Climate change 101 - Introduction to Climate Change Science (UNDP presentation)
Climate change 101 - Introduction to Climate Change Science (UNDP presentation)
 
Rits (1) (1)
Rits (1) (1)Rits (1) (1)
Rits (1) (1)
 
The Science of Climate Change r1.pdf
The Science of Climate Change r1.pdfThe Science of Climate Change r1.pdf
The Science of Climate Change r1.pdf
 
Global warming
Global warmingGlobal warming
Global warming
 
Why does climate change?
Why does climate change?Why does climate change?
Why does climate change?
 
VCE Environmental Science - Greenhouse Effect
VCE Environmental Science - Greenhouse EffectVCE Environmental Science - Greenhouse Effect
VCE Environmental Science - Greenhouse Effect
 
Global warming faq
Global warming faqGlobal warming faq
Global warming faq
 
Energy Balance lecture 4................................ppt
Energy Balance lecture 4................................pptEnergy Balance lecture 4................................ppt
Energy Balance lecture 4................................ppt
 
Global warming faq
Global warming faqGlobal warming faq
Global warming faq
 
Global warming faq
Global warming faqGlobal warming faq
Global warming faq
 
Climppf1
Climppf1Climppf1
Climppf1
 
Environmental changes kartavya.pptx
Environmental changes kartavya.pptxEnvironmental changes kartavya.pptx
Environmental changes kartavya.pptx
 
GLoBal WaRmiNg..
GLoBal WaRmiNg..GLoBal WaRmiNg..
GLoBal WaRmiNg..
 
Introducation of global warming
Introducation of global warmingIntroducation of global warming
Introducation of global warming
 
Geo pro
Geo proGeo pro
Geo pro
 
Earth Radiation Balance Project
Earth Radiation Balance ProjectEarth Radiation Balance Project
Earth Radiation Balance Project
 

More from GrazynaBroyles24

6 Pagesewly appointed Police Chief Alexandra Delatorre of the An.docx
6 Pagesewly appointed Police Chief Alexandra Delatorre of the An.docx6 Pagesewly appointed Police Chief Alexandra Delatorre of the An.docx
6 Pagesewly appointed Police Chief Alexandra Delatorre of the An.docxGrazynaBroyles24
 
6 pages which reach all of requiements below hereAn essay inclu.docx
6 pages which reach all of requiements below hereAn essay inclu.docx6 pages which reach all of requiements below hereAn essay inclu.docx
6 pages which reach all of requiements below hereAn essay inclu.docxGrazynaBroyles24
 
54w9Performing Effective Project Monitoring and Risk Management.docx
54w9Performing Effective Project Monitoring and Risk Management.docx54w9Performing Effective Project Monitoring and Risk Management.docx
54w9Performing Effective Project Monitoring and Risk Management.docxGrazynaBroyles24
 
5I need a fiive page paper with title page, reference page in APA fo.docx
5I need a fiive page paper with title page, reference page in APA fo.docx5I need a fiive page paper with title page, reference page in APA fo.docx
5I need a fiive page paper with title page, reference page in APA fo.docxGrazynaBroyles24
 
6 pages paper for International relations class Knowledgeable Econo.docx
6 pages paper for International relations class Knowledgeable Econo.docx6 pages paper for International relations class Knowledgeable Econo.docx
6 pages paper for International relations class Knowledgeable Econo.docxGrazynaBroyles24
 
50 words minimum This weeks audio is very informative but o.docx
50 words minimum This weeks audio is very informative but o.docx50 words minimum This weeks audio is very informative but o.docx
50 words minimum This weeks audio is very informative but o.docxGrazynaBroyles24
 
500 word discussion on the passage to answer question at the botto.docx
500 word discussion on the passage to answer question at the botto.docx500 word discussion on the passage to answer question at the botto.docx
500 word discussion on the passage to answer question at the botto.docxGrazynaBroyles24
 
5. An electric motor accomplishes what task[removed]convert.docx
5. An electric motor accomplishes what task[removed]convert.docx5. An electric motor accomplishes what task[removed]convert.docx
5. An electric motor accomplishes what task[removed]convert.docxGrazynaBroyles24
 
5.4 - Commercial Air Travel during the 1950’s – 1960’sIn this .docx
5.4 - Commercial Air Travel during the 1950’s – 1960’sIn this .docx5.4 - Commercial Air Travel during the 1950’s – 1960’sIn this .docx
5.4 - Commercial Air Travel during the 1950’s – 1960’sIn this .docxGrazynaBroyles24
 
500 wordsAPA FormatScenarioYou are a probation officer a.docx
500 wordsAPA FormatScenarioYou are a probation officer a.docx500 wordsAPA FormatScenarioYou are a probation officer a.docx
500 wordsAPA FormatScenarioYou are a probation officer a.docxGrazynaBroyles24
 
500 words- no references. Must be original, no plagiarism.docx
500 words- no references. Must be original, no plagiarism.docx500 words- no references. Must be original, no plagiarism.docx
500 words- no references. Must be original, no plagiarism.docxGrazynaBroyles24
 
5.5 - Beginnings of the Space ProgramIn this discussion activi.docx
5.5 - Beginnings of the Space ProgramIn this discussion activi.docx5.5 - Beginnings of the Space ProgramIn this discussion activi.docx
5.5 - Beginnings of the Space ProgramIn this discussion activi.docxGrazynaBroyles24
 
5.3 - Discussion Ethical issuesReview the pros and cons of glob.docx
5.3 - Discussion Ethical issuesReview the pros and cons of glob.docx5.3 - Discussion Ethical issuesReview the pros and cons of glob.docx
5.3 - Discussion Ethical issuesReview the pros and cons of glob.docxGrazynaBroyles24
 
500 words APA formatHow much impact do managers actually have on a.docx
500 words APA formatHow much impact do managers actually have on a.docx500 words APA formatHow much impact do managers actually have on a.docx
500 words APA formatHow much impact do managers actually have on a.docxGrazynaBroyles24
 
5.2Complete one of the following options for your Week 5 Assignm.docx
5.2Complete one of the following options for your Week 5 Assignm.docx5.2Complete one of the following options for your Week 5 Assignm.docx
5.2Complete one of the following options for your Week 5 Assignm.docxGrazynaBroyles24
 
5.1 DBDisparities exist among racial and ethnic groups with rega.docx
5.1 DBDisparities exist among racial and ethnic groups with rega.docx5.1 DBDisparities exist among racial and ethnic groups with rega.docx
5.1 DBDisparities exist among racial and ethnic groups with rega.docxGrazynaBroyles24
 
5. What are the most common types of computer-based information syst.docx
5. What are the most common types of computer-based information syst.docx5. What are the most common types of computer-based information syst.docx
5. What are the most common types of computer-based information syst.docxGrazynaBroyles24
 
5.2 - Postwar Commercial AviationIn this discussion activity, .docx
5.2 - Postwar Commercial AviationIn this discussion activity, .docx5.2 - Postwar Commercial AviationIn this discussion activity, .docx
5.2 - Postwar Commercial AviationIn this discussion activity, .docxGrazynaBroyles24
 
5-6 paragraphsYou and Officer Landonio are on patrol. Yo.docx
5-6 paragraphsYou and Officer Landonio are on patrol. Yo.docx5-6 paragraphsYou and Officer Landonio are on patrol. Yo.docx
5-6 paragraphsYou and Officer Landonio are on patrol. Yo.docxGrazynaBroyles24
 
5-6 paragraphs Interagency is relatively recent as a term, y.docx
5-6 paragraphs Interagency is relatively recent as a term, y.docx5-6 paragraphs Interagency is relatively recent as a term, y.docx
5-6 paragraphs Interagency is relatively recent as a term, y.docxGrazynaBroyles24
 

More from GrazynaBroyles24 (20)

6 Pagesewly appointed Police Chief Alexandra Delatorre of the An.docx
6 Pagesewly appointed Police Chief Alexandra Delatorre of the An.docx6 Pagesewly appointed Police Chief Alexandra Delatorre of the An.docx
6 Pagesewly appointed Police Chief Alexandra Delatorre of the An.docx
 
6 pages which reach all of requiements below hereAn essay inclu.docx
6 pages which reach all of requiements below hereAn essay inclu.docx6 pages which reach all of requiements below hereAn essay inclu.docx
6 pages which reach all of requiements below hereAn essay inclu.docx
 
54w9Performing Effective Project Monitoring and Risk Management.docx
54w9Performing Effective Project Monitoring and Risk Management.docx54w9Performing Effective Project Monitoring and Risk Management.docx
54w9Performing Effective Project Monitoring and Risk Management.docx
 
5I need a fiive page paper with title page, reference page in APA fo.docx
5I need a fiive page paper with title page, reference page in APA fo.docx5I need a fiive page paper with title page, reference page in APA fo.docx
5I need a fiive page paper with title page, reference page in APA fo.docx
 
6 pages paper for International relations class Knowledgeable Econo.docx
6 pages paper for International relations class Knowledgeable Econo.docx6 pages paper for International relations class Knowledgeable Econo.docx
6 pages paper for International relations class Knowledgeable Econo.docx
 
50 words minimum This weeks audio is very informative but o.docx
50 words minimum This weeks audio is very informative but o.docx50 words minimum This weeks audio is very informative but o.docx
50 words minimum This weeks audio is very informative but o.docx
 
500 word discussion on the passage to answer question at the botto.docx
500 word discussion on the passage to answer question at the botto.docx500 word discussion on the passage to answer question at the botto.docx
500 word discussion on the passage to answer question at the botto.docx
 
5. An electric motor accomplishes what task[removed]convert.docx
5. An electric motor accomplishes what task[removed]convert.docx5. An electric motor accomplishes what task[removed]convert.docx
5. An electric motor accomplishes what task[removed]convert.docx
 
5.4 - Commercial Air Travel during the 1950’s – 1960’sIn this .docx
5.4 - Commercial Air Travel during the 1950’s – 1960’sIn this .docx5.4 - Commercial Air Travel during the 1950’s – 1960’sIn this .docx
5.4 - Commercial Air Travel during the 1950’s – 1960’sIn this .docx
 
500 wordsAPA FormatScenarioYou are a probation officer a.docx
500 wordsAPA FormatScenarioYou are a probation officer a.docx500 wordsAPA FormatScenarioYou are a probation officer a.docx
500 wordsAPA FormatScenarioYou are a probation officer a.docx
 
500 words- no references. Must be original, no plagiarism.docx
500 words- no references. Must be original, no plagiarism.docx500 words- no references. Must be original, no plagiarism.docx
500 words- no references. Must be original, no plagiarism.docx
 
5.5 - Beginnings of the Space ProgramIn this discussion activi.docx
5.5 - Beginnings of the Space ProgramIn this discussion activi.docx5.5 - Beginnings of the Space ProgramIn this discussion activi.docx
5.5 - Beginnings of the Space ProgramIn this discussion activi.docx
 
5.3 - Discussion Ethical issuesReview the pros and cons of glob.docx
5.3 - Discussion Ethical issuesReview the pros and cons of glob.docx5.3 - Discussion Ethical issuesReview the pros and cons of glob.docx
5.3 - Discussion Ethical issuesReview the pros and cons of glob.docx
 
500 words APA formatHow much impact do managers actually have on a.docx
500 words APA formatHow much impact do managers actually have on a.docx500 words APA formatHow much impact do managers actually have on a.docx
500 words APA formatHow much impact do managers actually have on a.docx
 
5.2Complete one of the following options for your Week 5 Assignm.docx
5.2Complete one of the following options for your Week 5 Assignm.docx5.2Complete one of the following options for your Week 5 Assignm.docx
5.2Complete one of the following options for your Week 5 Assignm.docx
 
5.1 DBDisparities exist among racial and ethnic groups with rega.docx
5.1 DBDisparities exist among racial and ethnic groups with rega.docx5.1 DBDisparities exist among racial and ethnic groups with rega.docx
5.1 DBDisparities exist among racial and ethnic groups with rega.docx
 
5. What are the most common types of computer-based information syst.docx
5. What are the most common types of computer-based information syst.docx5. What are the most common types of computer-based information syst.docx
5. What are the most common types of computer-based information syst.docx
 
5.2 - Postwar Commercial AviationIn this discussion activity, .docx
5.2 - Postwar Commercial AviationIn this discussion activity, .docx5.2 - Postwar Commercial AviationIn this discussion activity, .docx
5.2 - Postwar Commercial AviationIn this discussion activity, .docx
 
5-6 paragraphsYou and Officer Landonio are on patrol. Yo.docx
5-6 paragraphsYou and Officer Landonio are on patrol. Yo.docx5-6 paragraphsYou and Officer Landonio are on patrol. Yo.docx
5-6 paragraphsYou and Officer Landonio are on patrol. Yo.docx
 
5-6 paragraphs Interagency is relatively recent as a term, y.docx
5-6 paragraphs Interagency is relatively recent as a term, y.docx5-6 paragraphs Interagency is relatively recent as a term, y.docx
5-6 paragraphs Interagency is relatively recent as a term, y.docx
 

Recently uploaded

MENTAL STATUS EXAMINATION format.docx
MENTAL     STATUS EXAMINATION format.docxMENTAL     STATUS EXAMINATION format.docx
MENTAL STATUS EXAMINATION format.docxPoojaSen20
 
Science 7 - LAND and SEA BREEZE and its Characteristics
Science 7 - LAND and SEA BREEZE and its CharacteristicsScience 7 - LAND and SEA BREEZE and its Characteristics
Science 7 - LAND and SEA BREEZE and its CharacteristicsKarinaGenton
 
URLs and Routing in the Odoo 17 Website App
URLs and Routing in the Odoo 17 Website AppURLs and Routing in the Odoo 17 Website App
URLs and Routing in the Odoo 17 Website AppCeline George
 
Mastering the Unannounced Regulatory Inspection
Mastering the Unannounced Regulatory InspectionMastering the Unannounced Regulatory Inspection
Mastering the Unannounced Regulatory InspectionSafetyChain Software
 
Paris 2024 Olympic Geographies - an activity
Paris 2024 Olympic Geographies - an activityParis 2024 Olympic Geographies - an activity
Paris 2024 Olympic Geographies - an activityGeoBlogs
 
call girls in Kamla Market (DELHI) 🔝 >༒9953330565🔝 genuine Escort Service 🔝✔️✔️
call girls in Kamla Market (DELHI) 🔝 >༒9953330565🔝 genuine Escort Service 🔝✔️✔️call girls in Kamla Market (DELHI) 🔝 >༒9953330565🔝 genuine Escort Service 🔝✔️✔️
call girls in Kamla Market (DELHI) 🔝 >༒9953330565🔝 genuine Escort Service 🔝✔️✔️9953056974 Low Rate Call Girls In Saket, Delhi NCR
 
Software Engineering Methodologies (overview)
Software Engineering Methodologies (overview)Software Engineering Methodologies (overview)
Software Engineering Methodologies (overview)eniolaolutunde
 
The basics of sentences session 2pptx copy.pptx
The basics of sentences session 2pptx copy.pptxThe basics of sentences session 2pptx copy.pptx
The basics of sentences session 2pptx copy.pptxheathfieldcps1
 
How to Configure Email Server in Odoo 17
How to Configure Email Server in Odoo 17How to Configure Email Server in Odoo 17
How to Configure Email Server in Odoo 17Celine George
 
Sanyam Choudhary Chemistry practical.pdf
Sanyam Choudhary Chemistry practical.pdfSanyam Choudhary Chemistry practical.pdf
Sanyam Choudhary Chemistry practical.pdfsanyamsingh5019
 
18-04-UA_REPORT_MEDIALITERAСY_INDEX-DM_23-1-final-eng.pdf
18-04-UA_REPORT_MEDIALITERAСY_INDEX-DM_23-1-final-eng.pdf18-04-UA_REPORT_MEDIALITERAСY_INDEX-DM_23-1-final-eng.pdf
18-04-UA_REPORT_MEDIALITERAСY_INDEX-DM_23-1-final-eng.pdfssuser54595a
 
SOCIAL AND HISTORICAL CONTEXT - LFTVD.pptx
SOCIAL AND HISTORICAL CONTEXT - LFTVD.pptxSOCIAL AND HISTORICAL CONTEXT - LFTVD.pptx
SOCIAL AND HISTORICAL CONTEXT - LFTVD.pptxiammrhaywood
 
mini mental status format.docx
mini    mental       status     format.docxmini    mental       status     format.docx
mini mental status format.docxPoojaSen20
 
Employee wellbeing at the workplace.pptx
Employee wellbeing at the workplace.pptxEmployee wellbeing at the workplace.pptx
Employee wellbeing at the workplace.pptxNirmalaLoungPoorunde1
 
Hybridoma Technology ( Production , Purification , and Application )
Hybridoma Technology  ( Production , Purification , and Application  ) Hybridoma Technology  ( Production , Purification , and Application  )
Hybridoma Technology ( Production , Purification , and Application ) Sakshi Ghasle
 
How to Make a Pirate ship Primary Education.pptx
How to Make a Pirate ship Primary Education.pptxHow to Make a Pirate ship Primary Education.pptx
How to Make a Pirate ship Primary Education.pptxmanuelaromero2013
 
“Oh GOSH! Reflecting on Hackteria's Collaborative Practices in a Global Do-It...
“Oh GOSH! Reflecting on Hackteria's Collaborative Practices in a Global Do-It...“Oh GOSH! Reflecting on Hackteria's Collaborative Practices in a Global Do-It...
“Oh GOSH! Reflecting on Hackteria's Collaborative Practices in a Global Do-It...Marc Dusseiller Dusjagr
 
Introduction to ArtificiaI Intelligence in Higher Education
Introduction to ArtificiaI Intelligence in Higher EducationIntroduction to ArtificiaI Intelligence in Higher Education
Introduction to ArtificiaI Intelligence in Higher Educationpboyjonauth
 

Recently uploaded (20)

MENTAL STATUS EXAMINATION format.docx
MENTAL     STATUS EXAMINATION format.docxMENTAL     STATUS EXAMINATION format.docx
MENTAL STATUS EXAMINATION format.docx
 
Science 7 - LAND and SEA BREEZE and its Characteristics
Science 7 - LAND and SEA BREEZE and its CharacteristicsScience 7 - LAND and SEA BREEZE and its Characteristics
Science 7 - LAND and SEA BREEZE and its Characteristics
 
URLs and Routing in the Odoo 17 Website App
URLs and Routing in the Odoo 17 Website AppURLs and Routing in the Odoo 17 Website App
URLs and Routing in the Odoo 17 Website App
 
Mastering the Unannounced Regulatory Inspection
Mastering the Unannounced Regulatory InspectionMastering the Unannounced Regulatory Inspection
Mastering the Unannounced Regulatory Inspection
 
Paris 2024 Olympic Geographies - an activity
Paris 2024 Olympic Geographies - an activityParis 2024 Olympic Geographies - an activity
Paris 2024 Olympic Geographies - an activity
 
call girls in Kamla Market (DELHI) 🔝 >༒9953330565🔝 genuine Escort Service 🔝✔️✔️
call girls in Kamla Market (DELHI) 🔝 >༒9953330565🔝 genuine Escort Service 🔝✔️✔️call girls in Kamla Market (DELHI) 🔝 >༒9953330565🔝 genuine Escort Service 🔝✔️✔️
call girls in Kamla Market (DELHI) 🔝 >༒9953330565🔝 genuine Escort Service 🔝✔️✔️
 
Software Engineering Methodologies (overview)
Software Engineering Methodologies (overview)Software Engineering Methodologies (overview)
Software Engineering Methodologies (overview)
 
The basics of sentences session 2pptx copy.pptx
The basics of sentences session 2pptx copy.pptxThe basics of sentences session 2pptx copy.pptx
The basics of sentences session 2pptx copy.pptx
 
How to Configure Email Server in Odoo 17
How to Configure Email Server in Odoo 17How to Configure Email Server in Odoo 17
How to Configure Email Server in Odoo 17
 
Sanyam Choudhary Chemistry practical.pdf
Sanyam Choudhary Chemistry practical.pdfSanyam Choudhary Chemistry practical.pdf
Sanyam Choudhary Chemistry practical.pdf
 
18-04-UA_REPORT_MEDIALITERAСY_INDEX-DM_23-1-final-eng.pdf
18-04-UA_REPORT_MEDIALITERAСY_INDEX-DM_23-1-final-eng.pdf18-04-UA_REPORT_MEDIALITERAСY_INDEX-DM_23-1-final-eng.pdf
18-04-UA_REPORT_MEDIALITERAСY_INDEX-DM_23-1-final-eng.pdf
 
SOCIAL AND HISTORICAL CONTEXT - LFTVD.pptx
SOCIAL AND HISTORICAL CONTEXT - LFTVD.pptxSOCIAL AND HISTORICAL CONTEXT - LFTVD.pptx
SOCIAL AND HISTORICAL CONTEXT - LFTVD.pptx
 
mini mental status format.docx
mini    mental       status     format.docxmini    mental       status     format.docx
mini mental status format.docx
 
Employee wellbeing at the workplace.pptx
Employee wellbeing at the workplace.pptxEmployee wellbeing at the workplace.pptx
Employee wellbeing at the workplace.pptx
 
TataKelola dan KamSiber Kecerdasan Buatan v022.pdf
TataKelola dan KamSiber Kecerdasan Buatan v022.pdfTataKelola dan KamSiber Kecerdasan Buatan v022.pdf
TataKelola dan KamSiber Kecerdasan Buatan v022.pdf
 
Hybridoma Technology ( Production , Purification , and Application )
Hybridoma Technology  ( Production , Purification , and Application  ) Hybridoma Technology  ( Production , Purification , and Application  )
Hybridoma Technology ( Production , Purification , and Application )
 
Model Call Girl in Tilak Nagar Delhi reach out to us at 🔝9953056974🔝
Model Call Girl in Tilak Nagar Delhi reach out to us at 🔝9953056974🔝Model Call Girl in Tilak Nagar Delhi reach out to us at 🔝9953056974🔝
Model Call Girl in Tilak Nagar Delhi reach out to us at 🔝9953056974🔝
 
How to Make a Pirate ship Primary Education.pptx
How to Make a Pirate ship Primary Education.pptxHow to Make a Pirate ship Primary Education.pptx
How to Make a Pirate ship Primary Education.pptx
 
“Oh GOSH! Reflecting on Hackteria's Collaborative Practices in a Global Do-It...
“Oh GOSH! Reflecting on Hackteria's Collaborative Practices in a Global Do-It...“Oh GOSH! Reflecting on Hackteria's Collaborative Practices in a Global Do-It...
“Oh GOSH! Reflecting on Hackteria's Collaborative Practices in a Global Do-It...
 
Introduction to ArtificiaI Intelligence in Higher Education
Introduction to ArtificiaI Intelligence in Higher EducationIntroduction to ArtificiaI Intelligence in Higher Education
Introduction to ArtificiaI Intelligence in Higher Education
 

This is likely to be one of the most well-cited pictures o

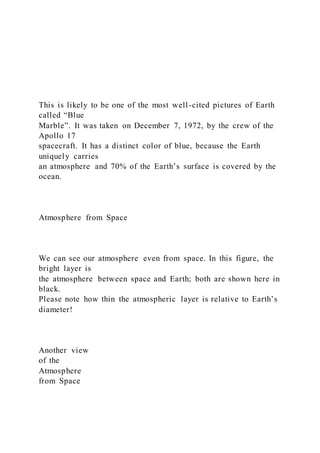
  • 1. This is likely to be one of the most well-cited pictures of Earth called “Blue Marble”. It was taken on December 7, 1972, by the crew of the Apollo 17 spacecraft. It has a distinct color of blue, because the Earth uniquely carries an atmosphere and 70% of the Earth’s surface is covered by the ocean. Atmosphere from Space We can see our atmosphere even from space. In this figure, the bright layer is the atmosphere between space and Earth; both are shown here in black. Please note how thin the atmospheric layer is relative to Earth’s diameter! Another view of the Atmosphere from Space
  • 2. This is a zoomed-in image of the atmosphere. You will notice that there is a gradual color change ranging from a brownish color closer to the Earth’s surface that transitions to a pale blue and eventually fades into space. The atmosphere extends about 10,000km into space. There is no exact top to the atmosphere. Due to the Earth’s gravity, the number of molecules, which individually each carry mass, gradually decreases outward into space. Most of the gas molecules are within the lower atmosphere. 90% of the atmosphere’s mass is in its lower 10km and 99.9997% is within the lower 100km. You will also notice that there are little blobs in the brownish colored layer close to the surface. This layer is called the troposphere, the lowest layer of the atmosphere ranging from 6-10km above sea level. This is where we live, clouds are formed, daily weather is observed, and the majority of the molecules exist. The blobs you see are seemingly giant cumulonimbus – dense towering clouds – often associated with thunderstorms. Composition of the Atmosphere including variable components (by volume)
  • 3. The three elements that make up over 99.9% of the atmosphere – nitrogen, oxygen, and argon. These elements are abundant in the atmosphere and have many uses. Pure nitrogen (N2) is used in its very cold, liquid state as it boils at -195.8 C (or -320F). Ted Williams, a baseball player who played for the Boston Red Sox for 22 years, and deceased in 2002, is preserved in liquid nitrogen since his family members chose to have his remains frozen. Pure oxygen (O2) is used to achieve higher temperatures, to increase the efficiency of waste incinerators. It is also used as an oxidizing agent, and in medical applications to assist and sustain a person’s respiratory functions. Argon (Ar) is a colorless, odorless, nontoxic, and nonreactive gas. It creates inert environments for growing crystals, often used in semiconductors. It protects materials against corrosion. It also fills the air space in double-pane insulating windows. Earth’s climate system and interactions of its components
  • 4. Two key ideas for this course, especially for the first half is: 1st: Climate is regulated by complex interactions amongst components of the Earth’s system. 2nd: Understanding climate change can be reduced to understanding how “the control knobs” function Climate change The knobs that control earth’s climate: • Atmospheric composition (greenhouse effect) • Amount of solar radiation (luminosity) • What parts of Earth get radiation (orbit) • Atmospheric and ocean circulation • Earth’s albedo (fraction of solar energy reflected off earth’s surface) • Volcanoes • Plate tectonics Greenhouse Effect We are here. First, a bit about radiation . . .
  • 5. How the control knobs work Amount of energy reaching earth determines the climate. Dominant source of energy is sunlight, which when reaching Earth can heat the land, ocean, and atmosphere. If a chunk of matter oscillates and interacts with light at all possible frequencies, it is called blackbody. And the light (energy) that is emitted by a blackbody is called blackbody radiation. In this manner, although “blackbody” is originally named for an ideal object, we consider the Earth as a blackbody. In fact, many objects that radiate energy back when they are heated are considered as a blackbody. The Greenhouse Effect Greenhouse gases don’t “trap” heat; they absorb heat and re- radiate it out to space and back to Earth. So, some of that sunlight is reflected back to space by the Earth’s surface, clouds, or ice. But much of the sunlight that reaches Earth is
  • 6. absorbed and warms the planet. When Earth emits the same amount of energy that it absorbs, its energy budget is in balance, and its average temperature remains stable. The discrepancy between incoming solar energy and outgoing radiation energy is the greenhouse effect. Earth’s atmosphere contains greenhouse gases (e.g. CO2, CH4, etc.) that absorb 95% of the longwave (we will learn more about this later) back radiation emitted from the surface. Earth’s radiation budget Here is a breakdown of the numbers… Solar radia)on arriving at the top of Earth’s atmosphere averages 342 W/m2, indicated here as 100% (upper leB). About 30% of the incoming radia)on is reflected and scaHered back into space, and the other 240 W/m2 (70%) enters the climate system. Some of this entering radia=on warms Earth’s surface and causes it to radiate heat upward (right). The greenhouse effect (lower
  • 7. right) retains 96% of the heat radiated back from Earth’s heated surface and warms Earth by 31 C ̊ . 410 http://berkeleyearth.org/2018- temperatures/ (Upper figure) Mean global air temperature variation from 1850 to 2018 In 2018, 9 of the 10 warmest years have occurred since 1990. (Lower figure) Atmospheric CO2 variation during the same interval From 1960 to present: the atmospheric CO2 concentration has been measured in Mauna Loa, Hawaii. Before 1960, the CO2 concentration is a reconstructed value based upon CO2 preserved in ice cores. Ice core records Temp. CO2 Dust Annually
  • 8. laminated bands within ice core Thousands of years ago Why do we use ice core records instead of observed data (which seems to be the more direct and reliable approach)? This is because, unfortunately, we only have a limited number of observed records for us to understand the natural cycle of the Earth’s climate – most of the data are available only for the past 50 years of which a few extend past a couple hundred years. This means, for instance, if we would like to discuss our climate system in relation to the El Nino cycle, which likely occurs every 3-5 years on average, we can only refer to a few of those events. For this reason, we need a longer record than the observational record. By using ice core records, as shown in this figure, we can study and argue climate/environmental variability of the past 400,000 years. If the ice core preserves annual layers (like tree rings), the record you are
  • 9. looking at is basically a sub-seasonal resolution of climate variability. Climate Change in New England Weider and Boutt, 2010 What is happening in New England? This figure shows 12 month moving averages of temperature data measured at 43 observational sites across New England between 1920 and 2009. Please note that this data is an average of 12 months, and any seasonal variability is expressed much less obvious. There maybe a warming trend? This may be correct. However, importantly, local temperature variability can be quite different from global temperature variability – it maybe even cooling in some areas. Receding mountain glacier due to recent warming.
  • 10. 0 1000 2000 3000 4000 5000 6000 7000 1000 1200 1400 1600 1800 2000 P op ul at io n (M ill io ns )
  • 11. Time (Years) World Population (http://www.census.gov/ipc/www/idb/worldpopinfo.html) 1967 1920 1850 Today 7 billion Is this temperature trend related to population growth? Popula'on growth If so, what will the future population be? Check today’s population: https://www.census.gov/popclock/ MMD-A1B 2080-2099 vs 1980-1999 IPCC 2007 Effects on Agriculture and the Ocean? Also figures from the IPCC (Intergovernmental Panel on Climate Change) showing the discrepancy between simulated climate model results 2080-2099
  • 12. and observational data 1980-1999. Precipitation, soil moisture, runoff, and evaporation. Some areas experience drier conditions. Source: IPCC 2007 Black line: observed temperatures Blue: expected changes due to natural factors Pink: expected changes due to natural factors plus greenhouse gases Comparison of observed continental- and global-scale changes in surface temperature with results simulated by climate models using either natural or both natural and anthropogenic forcings. Averages of observations are shown for the period 1906-2005 (black line) plotted against the center of the decade and relative to the corresponding average for 1901-1950. Lines are dashed where spatial coverage is less than 50%. Blue shaded bands show the 5 to 95% range for 19 simulations from five climate models using only natural forcings due to solar activity and volcanoes. Red shaded bands show the 5 to 95% range for 58 simulations from 14 climate models using both natural and anthropogenic forcings (like CO2)
  • 13. Change in Snow Depth CRCM-A2 2070 Results from another climate model showing changes in snow depth in North America. An example of a positive feedback Warming reduces the cover of snow and sea ice in the Arctic from 2005 (right) to 2007 (left), increases the amount of heat absorbed by exposed water, reduces albedo, and thereby further warms the climate. This is called a positive feedback process. We will learn more about “albedo” and “feedback process” later this semester. November Arctic Ocean Ice Extent Source: NSIDC Monthly November ice extent for 1979 to 2014 shows a decline of 4.7% per decade relative to the 1981 to 2010 average.
  • 14. Source: Steffen et al., 2008 Area of Melting on the Greenland Ice Sheet: increasing Greenland ice sheet is also increasingly melting from 1979 to 2008. Maps of maximum annual surface melt on the Greenland Ice Sheet derived from monthly ice surface temperature product of Greenland (2000-2016). Greenland ice sheet is also increasingly melBng! A Multilayer Surface Temperature, Surface Albedo, and Water Vapor Product of Greenland from MODIS, April 2018, Remote Sensing 10(4):555, DOI: 10.3390/rs10040555 This figure shows the amount of ice sheet lost in Greenland and Antarctica between 2002 and 2009. Velicogna (2009), Geophysical Research Letters, v.36. L19503, DOI: 10.1029GL040222 https://www.antarcticglaciers.org/2020/01/what-is-the-ice- volume-of-thwaites-glacier/
  • 15. Ice streams of Antarctica Recent observations show that incursions of warm ocean water cause melting of the undersides of floating ice shelves in West Antarctica. This could cause a rapid and irreversible rise in sea level. Reference: Hillenbrand, CD., Smith, J., Hodell, D. et al. West Antarctic Ice Sheet retreat driven by Holocene warm water incursions. Nature 547, 43– 48 (2017). https://doi.org/10.1038/nature22995 Our own UMass faculty, Prof. DeConto published in Nature journal in 2021 a suggestion that if emissions continue at their current pace, by approximately 2060, the Antarctic Ice Sheet will have crossed a critical threshold that will cause irreversible global sea level rise within a human timescale. Reference: DeConto, R.M., Pollard, D., Alley, R.B. et al. The Paris Climate Agreement and future sea- level rise from Antarctica. Nature 593, 83–89 (2021). https://doi- org.silk.library.umass.edu/10.1038/s41586-021- 03427-0 https://www.antarcticglaciers.org/2020/01/what-is-the-ice- volume-of-thwaites-glacier/ https://doi-org.silk.library.umass.edu/10.1038/s41586-021- 03427-0 Future Sea Level?
  • 16. If we lose all ice in the world – what will happen to the sea level? Bamber et al., 2009 A simula)on model result shows what happens to the sea level, if all sea ice/con)nental ice (ice sheet) fully collapsed. Most of the northern hemisphere experiences an increase in sea level of over 1 m. What happens with 1 m sea level rise? Here are links that include recent research outcome about ice loss from Earth’s ice sheets. Check out the amazing and disturbing videos in this NASA briefing…. Snow over Antarctica Buffered Sea Level Rise during Last Century https://go.nasa.gov/2GeaWZb
  • 17. Carbon Brief.org http://www.carbonbrief.org/blog/2015/08/new-nasa-videos- show-stark-ice- loss-from-earths-ice-sheets/ Annual Arctic sea ice minimum 1979-2018 with area graph https://climate.nasa.gov/climate_resources/155/video-annual- arctic-sea- ice-minimum-1979-2018-with-area-graph/ Antarctic ice loss: 2002-2016 https://climate.nasa.gov/climate_resources/154/video-antarctic- ice-loss- 2002-2016/ https://t.co/9metgs5qRp http://www.carbonbrief.org/blog/2015/08/new-nasa-videos- show-stark-ice-loss-from-earths-ice-sheets/ https://climate.nasa.gov/climate_resources/155/video-annual- arctic-sea-ice-minimum-1979-2018-with-area-graph/ https://climate.nasa.gov/climate_resources/154/video-antarctic- ice-loss-2002-2016/ Changes in Medical Education Scenario Imagine you are a medical apprentice in the 1800s. Envision your medical training during this era under the apprenticeship model. Jump to the 1960s and envision your training under the academic model. Finally, think of what your medical school training might look like today.
  • 18. Of particular interest for today’s training are the many technology innovations for learning in medical schools, including augmented reality (AR), virtual reality (VR), robotic- assisted surgery, and minimally or noninvasive procedure technologies. Today’s training features remote patient monitoring (RPM) and telemedicine through a virtual model of care (VMC), as well as learning to use the human genome for more accurate diagnosing and patient-specific treatments. Instructions Write a 3–4 page paper to analyze the scope of change in medical education from the 1800s to today, the apprenticeship and academic models, and the importance of understanding the history in order to help improve medical education in the future. Do the following: 1. The textbook is suggested as the most efficient resource for this assessment, or use other resources from those provided with this assessment. You may also use resources you find on your own from the History of Health Care Research tab in the Health Care Administration Undergraduate Library Research Guide to research the history of medical education from the 1800s, 1960s, early 2000s, and today. . You will need to include four references in your paper, one of which can be your textbook. . Use the course resources provided for the remaining references, or locate your own resources. · Write an introduction to your paper using the Changes in Medical Education Template [DOCX]. . Include a brief explanation of the purpose of the paper and its main ideas. . Refer to the Writing Support page on Campus for resources to help you as you write and revise your paper. · In The Changing Scope of Medical Education section of the assessment template, analyze the scope of the changes in medical education from the 1800s to today. . How widespread are the newer technologies impacting medical training?
  • 19. . Have there been mandated changes or have there been cultural changes that have impacted medical education? · In the Apprenticeship Model vs. Academic Model section of the assessment template, compare and contrast the apprenticeship and academic models of medical education in the 1800s, 1960s, 2000s, and today. . Describe the apprenticeship model and the academic model. . Compare and contrast the similarities and differences in their features. . Analyze how the models have evolved over time and the impact the evolution of these models has had on the quality of patient care. · In the Importance of Understanding History of Medicine section of the assessment template, explain the importance of understanding the history of medical education in order to help improve medical education in the future. · Write a conclusion to your paper in which you summarize the main themes you addressed. · Cite all the resources you used in your paper in APA 7TH Edition format. Additional Requirements · Your paper should be 3–4 pages, in addition to the title page and references page. · Double space and use Times New Roman, 12-point font, as is provided in the template. · Use a minimum of four resources; you may include the textbook and other course resources. · Respond to all parts of the template, using the headings provided. · Support all points with credible evidence, in the form of APA citations. · Include a references page in APA format with appropriate citations. Competencies Measured By successfully completing this assessment, you will demonstrate your proficiency in the following course
  • 20. competencies and scoring guide criteria: · Competency 3: Analyze the development of medical education in the United States. . Analyze the scope of change in medical education from the 1800s to today. . Compare and contrast the apprenticeship model and the academic model of medical education. . Analyze the impact of the evolution of the models on patient care. . Analyze why it is important to understand the history of medicine in order to improve medical education. · Competency 4: Communicate in a manner that is scholarly, professional, and respectful of the diversity, dignity, and integrity of others. . Articulates meaning relevant to the main topic, scope, and purpose of the prompt. . Applies APA formatting to in-text citations and references. 2 3 Changes in Medical Education Your Full Name (no credentials) Capella University BHA-FPX4002: History of the United States Health Care System
  • 21. Instructor’s Name Date Changes in Medical Education Write your introduction here. Include a brief explanation of the purpose of the paper and its main ideas.The Changing Scope of Medical Education Analyze the scope of change in medical education from the 1800s to today. How widespread are the newer technologies impacting medical training? Have there been mandated changes or have there been cultural changes that have impacted medical education? Apprenticeship Model vs. Academic Model Description and Comparison of Both Models Describe both the apprenticeship and academic models of medical education in the 1800s, 1960s, early 2000s, and today. Compare and contrast the features of both models. Analysis of Evolution and Impact Analyze how the two models have evolved over time and the impact the evolution of these models has had on the quality of patient care. Importance of Understanding History of Medicine Explain why it is important to understa nd the history of medical education in order to help improve medical education in the future. Be sure to provide examples that illustrate your point. Conclusion Summarize the main themes of your paper. References (Include a minimum of four resources, all of which must be cited in the body of your paper.) Young, K. M., & Kroth, P. J. (2018). Sultz & Young's health care USA: Understanding its organization and delivery (9th ed.). Jones & Bartlett Learning.
  • 22. Historical Health Care Trend Analysis In this assessment, you will review the private and public health legislation, regulatory agencies, and quality initiatives that have catapulted the United States into the quality revolution that we are experiencing today. As this quality revolution continues, health care professionals can expect to see more innovations contributing to individual patient and population health quality initiatives, with many more regulations to come. Scenario You are a health care educator for a large integrated accountable care organization (ACO). You are tasked to work with a group of hospital executives to identify milestone events for three eras, the 1800s, 1900s, and 2000s, and identify trends from those events that impacted the health care industry. The trend analysis will consist of three critical measures: access, quality, and costs. Milestone events and trends identified for these three measures over time should include legislation, regulatory agencies, and quality initiatives in the various time periods. The final paper will be used in an annual strategic planning session attended by the ACO and hospital executives to demonstrate how the quality movement has evolved into a quality revolution.Instructions Write a 2–3-page paper in which you explain and analyze health care regulations and medical practice evolutionary changes for access, quality, and cost, including the significant milestone events from different time periods. Complete the following: 1. References and citations: . You are required to reference a total of three scholarly sources in your paper. . Be sure to cite these references within the body of your paper correctly using APA style citations. Refer to Evidence and
  • 23. APA in the Capella Writing Center for help with using APA style. · Complete the Trend Analysis Table: Evolution of Access, Quality, and Cost in Health Care in the appendix for the assessment template. . For each time period, select 2 milestone events or regulations . There should be a total of 18 milestone events or regulations in the completed table. . Include bullet points with notes that describe each event or regulation and how it impacted access, quality, or cost. · Write an introduction for the paper using the Historical Health Care Trend Analysis Template [DOCX]. . Provide a brief explanation of the purpose of this historical trend analysis and how it might be used in your work as a health administrator (1 paragraph). · Use the Trend Analysis Table: Evolution of Access, Quality, and Cost in Health Care table to write the body of your paper. . Complete the Trends and Regulations section in the assessment template. . Provide a brief description of the key measures of health care services, which are access, quality, and cost (1–2 paragraphs). . In the Health Care Access subsection, explain the significant trends and regulatory milestones associated with access to health care over the recent eras (1–2 paragraphs). . What U.S. legislation, regulatory agencies, and quality initiatives from the 1800s, 1900s, and 2000s have influenced access to health care services in the United States? . What does your milestone trend analysis reveal for access to care? . Include citations and references to specific regulations, events, or agencies. · In the Health Care Quality subsection, explain the significant trends and regulatory milestones associated with health care quality over the recent eras (1–2 paragraphs). . What U.S. legislation, regulatory agencies, and quality initiatives from the 1800s, 1900s, and 2000s have influenced
  • 24. care quality in health care services in the United States? . What does your trend analysis reveal for care quality? . Include citations and references to specific regulations, events, or agencies. · In the Health Care Cost subsection, explain the significant trends and regulatory milestones associated with access to health care costs over the recent eras (1–2 paragraphs). . What U.S. legislation, regulatory agencies, and quality initiatives from the 1800s, 1900s, and 2000s have affected health care costs for medical services? . What does your trend analysis reveal for medical service costs? . Include citations and references to specific regulations, events, or agencies. · Complete the Trend Analysis section of the assessment template (1–2 paragraphs). · Analyze the trends and regulations in health care access, quality, and cost to draw conclusions about the evolution of health care regulations and practice throughout the recent eras. · Describe professional experiences or examples to illustrate the trends. · · Write the conclusion for the paper (1 paragraph). · Briefly restate the trends revealed for health care access, quality, and cost. · Draw a conclusion about how the milestones, regulations, and changes have improved, been neutral, or inhibited progress of the U.S. health care system. · Summarize clear and concise conclusions of your trend analysis. Additional Requirements · Your paper should be 2–3 pages, in addition to the title page, appendix, and references page. · Double space your paper, and use Times New Roman, 12-point font, as indicated in the assessment template. · Use a minimum of three resources. This may include your textbook and other course resources.
  • 25. · Complete all parts of the assessment template, using the headings provided in the template. · Support all points with credible evidence, in the form of APA citations. · Include a references page in APA format with appropriate citations. · Complete the Trend Analysis Table: Evolution of Access, Quality, and Cost in Health Care in the appendix of the assessment template.Competencies Measured By successfully completing this assessment, you will demonstrate your proficiency in the following course competencies and scoring guide criteria: · Competency 1: Analyze trends in the U.S. health care system from a historical perspective. . Identify health care legislative, regulatory agency, and quality initiative events in a trend analysis table of different eras. · Competency 2: Explain the development of health regulation and the evolution of medical practice. . Explain the significant trends and regulatory milestones associated with access to health care over the recent eras. . Explain the significant trends and regulatory milestones associated with health care quality over the recent eras. . Explain the significant trends and regulatory milestones associated with health care costs over the recent eras. . Analyze the trends and regulations in health care access, quality, and cost to draw conclusions about the evolution of health care regulations and practice throughout the recent eras.
  • 26. Comparative Analysis: Physician Practice Evolution EXAMPLE PAPER Learner’s Name School of Business, Technology, and Health Care Administration, Capella University BHA4002/BHA-FPX4002: History of the United States Health Care System Capella Instructor’s Name Date Note: This is an example paper written on the evolution of physician practices. The actual assessment is a comparative analysis of the evolution of hospitals. 2 Example-only Comparative Analysis Paper © Capella University, Not for Distribution Comparative Analysis: Physician Practice Evolution
  • 27. In this comparative analysis report, the evolution of physician practice is reviewed from the 1800’s through the 2000s. The purpose of this report is to show the progress of how physician practices, their staff and payment systems have changed over the last three centuries. The irony is that they have changed, and they have also gone full circle as explained below. In the 1800 and 1900 centuries, the relationship with the physician was very personal and patient- centered. The physician knew everything about their patient, and the patient knew everything about their hometown physician. As medicine evolved, physicians became more specialized, and focused on specific diseases. This often removed that personal relationship between physician specialist and patient. The irony is that the 2019 COVID pandemic put a spotlight once again on the primary care physician-patient relationship, but in a much broader context. The pandemic showed us the importance of the primary and community healthcare (P&CHC) systems focus (Lauriola, et al., 2021). The pandemic revealed a weakness in P&CHC worldwide, i.e., it put a focus on hospital and intensive care beds and not on community and primary care. In Lauriola et al. (2021), the
  • 28. authors propose that the pandemic has shown us that P&CHC is where the focus needs to be though local community problem-solving to safeguard communities, which brings us back to the primary care physician and infrastructure at the community level, but in a context of global world health (Lauriola et al., 2021). Comparative Grid and Analysis In Appendix A, the table entitled The Physician Practice Evolution and Changes shows how the physician practice has progressed. There are several major milestones that stand out in the table which includes the evolution of the physicians’ offices, the training of their staff, and how they were paid compared to payment systems today. The Physician Practice In the 1800s, physicians would often go to see the patient at their home (Nespor, 2009). Physicians were solo practitioners around the turn of the 19th century. By the mid-1900s physicians were more likely to be in a group practice of two or more providers (Kroth & Young, 2018). In the early 1990s, healthcare markets began to consolidate nationwide due to
  • 29. rising healthcare costs and reduced reimbursement. By the 1990s group practices began to integrate horizontally into Independent Practice 3 Example-only Comparative Analysis Paper © Capella University, Not for Distribution Associations (IPAs) (Kroth & Young, 2018). The IPAs then vertically integrated with hospitals and formed Physician-Hospital Organizations (PHOs). The PHOs were established to retain and gain market share through managed care contracting and used shared purchasing groups to achieve cost-savings (Kroth & Young, 2018; Williams & Cuneo,1997). Physician Staff In the 1800s, the physician most often worked as a solo practitioner without an assistant. If they had an assistant, it was someone that they personally trained (Nespor, 2015). By the 1960s, due to population growth and the demand for health services, physicians time became a scarce commodity, and
  • 30. the nurse practitioner movement began (Kroth & Young, 2018). This movement persists today because of population demand and the projected physician shortages (AAMC, 2021). Payment Systems From the 1800s to the early 1900s, physicians were paid in small amounts of cash, or in food and services from their patients (Allen, 2016). As healthcare costs rose between 1960-2000, physicians’ fees declined. The physicians’ reimbursement changed from fee- for-service to discounted fee-for-service and capitation (Kroth & Young, 2018). Capitation is a flat prepaid fee to providers per member per month (PMPM) from the managed care organizations (MCOs) (Kroth & Young, 2018). Comparative Analysis Summary In the 1800s, the physician’s office was often their home. By the 1960s offices were centrally located and often group practices with two or more physicians. In the 1800, physicians extenders did not exist. In the 1960s and still today the educational programs for NP and PA are well established and the physician extender, working under the supervision of the physician, is common.
  • 31. One of the biggest changes in the physician practice has been in the reimbursement for their services. In the 1800s, physicians received payment in cash or food and services. Blue Cross (BC) was established in 1929, Medicare and Medicaid in 1965 as fee for service payers. However, by the early 1990s markets consolidated and managed care organizations were on the rise promoting care quality and cost containment. 4 Example-only Comparative Analysis Paper © Capella University, Not for Distribution Conclusion In conclusion, the evolution of the physicians practice has been progressively positive, and the improvements have established higher quality of care in medical practices today. The changes in the physician’s medical practice have been and will continue to be
  • 32. dynamic and persistent. However, the medical industry is unable to ignore what the 2019 COVID pandemic has revealed, i.e., the importance of the primary and community healthcare (P&CHC) systems focus. Although, the primary care and specialty care physicians will continue to manage patient care and prevention at the community level they will need to do so within a broader world-health context. 5 Example-only Comparative Analysis Paper © Capella University, Not for Distribution References Allen, E. (2016, April 28). Paying the doctor in 18th-century Philadelphia. Library of Congress. https://blogs.loc.gov/loc/2016/04/paying-the-doctor-in-18th- century-philadelphia/ Association of American Medical Colleges. (2021, June 11). AAMC report reinforces mounting physician shortage. https://www.aamc.org/news-insights/press-
  • 33. releases/aamc-report-reinforces-mounting- physician-shortage Berenson, R. A., & Rich, E. C. (2010). US approaches to physician payment: The deconstruction of primary care. Journal of General Internal Medicine, 25(6), 613– 618. https://doi.org/10.1007/s11606-010-1295-z Kroth, P. J., & Young, K. M. (2018). Sultz & Young's health care USA: Understanding its organization and delivery (9th ed.). Jones & Bartlett. Lauriola, P., Martín-Olmedo, P., Leonardi, G. S., Bouland, C., Verheij, R., Dückers, M., van Tongeren, M., Laghi, F., van den Hazel, P., Gokdemir, O., Segredo, E., Etzel, R. A., Abelsohn, A., Bianchi, F., Romizi, R., Miserotti, G., Romizi, F., Bortolotti, P., Vinci, E., Giustetto, G., … Zeka, A. (2021). On the importance of primary and community healthcare in relation to global health and environmental threats: lessons from the COVID-19 crisis. BMJ Global Health, 6(3), e004111. https://doi.org/10.1136/bmjgh-2020-004111 Nespor, C. (2009, March 11). 19th century doctors in the U.S. Melnick Medical (History) Museum.
  • 34. https://melnickmedicalmuseum.com/2009/03/11/19th-century- doctors-in-the-us/ Nespor, C. (2015, October 28). Doctors’ offices. Melnick Medical (History) Museum. https://melnickmedicalmuseum.com/tag/doctors-offices/ Williams, W. C., III, & Cuneo, K. F. (1997). Physician-hospital organizations and PHO executives. What lies ahead for the PHO? Physician Executive, 23(2), 13–15. http://web.b.ebscohost.com.library.capella.edu/ehost/ 6 Example-only Comparative Analysis Paper © Capella University, Not for Distribution Appendix A The Physician Practice Evolution and Changes Theme 1800s 1960s 2000s The Physician’s Office • Often the
  • 35. providers home • Often the patients home (Nespor, 2009). • Single Physician Office (Nespor, 2009). • Small group Practice of 2-4 physicians (Kroth & Young, 2018). • Independent Physician Associations (IPAs). • Consolidation of market with larger physician groups contracted with Hospitals, i.e., Physician Hospital organizations (PHOs). (Kroth & Young, 2018). The Physician Assistant • None with formal training. • Trained by the physician to assist them (Nespor,
  • 36. 2015). • Office staff, may include RN, LPN, or MA • Often trained by the physician to assist them (Kroth & Young, 2018). • Specialization, Physician extenders, Nurse practitioners (NP) and Physician Assistants (PA) • Lab Technicians, Radiology Technologists (Kroth & Young, 2018). The Physician Payment Systems • Small cash payments • Goods, such as coffee, tea, wine, and beer; and services such as carpentry, painting and so on were
  • 37. offered as payment (Allen, 2016). • Fee-for-Service: Private pay. • Early insurance payments form BCBS (1929), • 1965 and beyond, Medicare and Medicaid (Kroth & Young, 2018). • Medicare Physicians Fee Schedule (PFS), Resource-Based Relative Value Scale (RBRVS), • Capitation, one fee per member per month (PMPM) (Kroth & Young, 2018).
  • 38. Historical Trend Analysis Your Full Name (no credentials) Capella University BHA-FPX4002: History of the United States Health Care System Instructor’s Name 1 2 Date Historical Trend Analysis Write your introduction here. Provide a brief explanation of the purpose of this historical trend analysis and how it might be used in your work as a health administrator (1 paragraph). Where appropriate, reference significant health care milestones, regulations, and measures for access, quality, and cost. Trends and Regulations Provide a brief description of the key measures of health care services, which are access, quality, and cost (1–2 paragraphs). Health Care Access Explain why access to health care is important and what it means. What U.S. legislation, regulatory agencies, and quality initiatives for the 1800s, 1900s and 2000s have influenced access to health care services in the United States. What does your milestone trend analysis reveal for access to care? (1–2 paragraphs) Health Care Quality Explain what quality health care is and why it is important. What U.S. legislation, regulatory agencies, and quality initiatives for the 1800s, 1900s and 2000s have influenced care
  • 39. quality in health care services in the United States. What does your trend analysis reveal for care quality? (1–2 paragraphs) Health Care Cost Explain what health care cost is and why it is important. What U.S. legislation, regulatory agencies, and quality initiatives for the 1800s, 1900s and 2000s have affected health care costs for medical services. What does your trend analysis reveal for medical service costs? (1–2 paragraphs) Trend Analysis Analyze the trends and regulations in health care access, quality, and cost to draw conclusions about the evolution of health care regulations and practice throughout the recent eras (1–2 paragraphs). Describe professional experiences or examples to illustrate the trends. Include citations and references to specific regulations, events, or agencies. Conclusion Summarize clear and concise conclusions of your trend analysis (1 paragraph). What are the trends revealed for health care access, quality, and cost? Draw a conclusion about how the changes have improved, been neutral, or inhibited progress of the U.S. health care system. References Kroth, P. J., & Young, K. M. (2018). Sultz & Young's health care USA: Understanding its organization and delivery (9th ed.). Jones & Bartlett. Appendix Trend Analysis Table: Evolution of Access, Quality, and Cost in Health Care Milestones Health Care Access Health Care Quality Health Care Costs
  • 40. 1800s Regulatory Legislation, Agencies, or Quality Initiatives Year, Milestone · Note · Note Year, Milestone · Note · Note Year, Milestone · Note · Note Year, Milestone · Note · Note Year, Milestone · Note · Note Year, Milestone · Note · Note 1900s Regulatory Legislation, Agencies, or Quality Initiatives Year, Milestone · Note · Note Year, Milestone · Note · Note Year, Milestone · Note · Note Year, Milestone · Note · Note
  • 41. Year, Milestone · Note · Note Year, Milestone · Note · Note 2000s Regulatory Legislation, Agencies, or Quality Initiatives Year, Milestone · Note · Note Year, Milestone · Note · Note Year, Milestone · Note · Note Year, Milestone · Note · Note Year, Milestone · Note · Note Year, Milestone · Note · Note
  • 42. Evolution of the Hospital Industry: A Comparative Analysis Your Full Name (no credentials) Capella University BHA-FPX4002: History of the United States Health Care System Instructor’s Name Date 2 2 Evolution of the Hospital Industry: A Comparative Analysis Write your introduction here. Include a brief explanation of the purpose of the paper and main ideas. Reference significant trends that you noticed as appropriate (1 paragraph). Hospital Care Evolution Provide a brief overview of the evolution of hospital care from the 1800s to the 1960s to today (1 short paragraph). Hospital Environment Describe your findings about hospital environme nts from the 1800s, 1960s, and 2000s (1 paragraph). Staff Education Describe your findings about hospital environments from the 1800s, 1960s, and 2000s (1 paragraph). Level of Care Describe your findings about hospital environments from the 1800s, 1960s, and 2000s (1 paragraph). Paying for Your Care Describe your findings about hospital environments from the
  • 43. 1800s, 1960s, and 2000s (1 paragraph). Comparative Analysis Write a brief summary of your comparisons and analysis about the significance of the key changes from the different time periods. Draw conclusions about how the hospital industry has evolved from the 1800s, to the 1960s, to today, and about the significance of the key milestones from the different time periods. Give specific examples of the impact on the quality of patient care during these time frames (1–2 paragraphs). Conclusion Summarize clear and concise conclusions drawn from your comparisons and analysis about the different time periods and the hospital environment, staff education, level of care, and payment for care topics. Explain why it is important to study the history of hospital care for your profession (1 paragraph). References (Include a minimum of three resources, all of which must be cited in the body of your paper.) Young, K. M., & Kroth, P. J. (2018). Health care USA: Understanding its Organization and delivery (9th ed.). Jones & Bartlett Learning. Appendix Comparative Analysis Table: Hospital Care Evolution Instructions: Fill in the chart with bullet points that describe the key milestones (events, regulations, laws, etc.) and the supporting details to explain the topics in each cell. Use your textbook and at least two other resources from the course resources for this assessment or your own research, and document where you found the information using accurate APA citations.
  • 44. Subject/Topic 1800s 1960s 2000s Hospital Environment (Describe the overall hospital environment.) Medical Staff Education Level (Describe the care providers and their education levels.) Level of Care (Describe the quality of care for each century and if it improved.) Paying for Care (Describe how care was paid for.) Evolution of the Hospital Industry: A Comparative Analysis Instructions Write a 2–3 page paper about the similarities and differences in hospital care from the different time periods (1800s, 1960s, and
  • 45. today), as well as the conclusions you drew from your analysis. Include a research table in the appendix of your paper. Complete the following: 1. Research how the hospital industry has evolved in terms of hospital environment, medical staff education, level of care in hospitals, and payment systems. . You will need to reference a total of three scholarly sources in your paper. . Be sure to cite these references within the body of your paper correctly using APA 7th Edition style citations. · Complete the Comparative Analysis Table: Hospital Care Evolution, located in the appendix of the Comparative Analysis Template [DOCX]. . Provide two descriptive changes for each time period under each of the headings. . Add bullet points to each cell in the table to document the descriptive changes that you have found for each topic. . Document the source where you found the information for each cell in the table, using APA-style citations. · Write an introduction to the paper using the Comparative Analysis Template [DOCX]. . Include a brief explanation of the purpose of the paper and main ideas. . Reference significant trends that you noticed as appropriate. . Refer to the Writing Support page on Campus for resources to help you as you write and revise your paper. · Write the body of the paper. . Write the Hospital Care Evolution section in the assessment template, using the information from the Comparative Analysis Table you completed. . Describe your findings about each topic in the different time periods under each subtopic heading. . Explain the trends in hospital environment, medical staff education, level of care in hospitals, and the payment systems in a short paragraph (3–4 sentences) for each topic, using the subheadings provided in the assessment template.
  • 46. . Cite all references used within the body of your paper using APA-style citations. · Write the Comparative Analysis section (1–2 paragraphs) in the assessment template. . Write a brief summary of your comparisons and analysis about the significance of the key changes from the different time periods. . Draw conclusions about how the hospital industry has evolved from the 1800s to the 1960s to today and about the significance of the key milestones from the different time periods. . Give specific examples of the impact on the quality of patient care during these time frames. · Write a conclusion paragraph where you summarize the main ideas included in the paper. · Explain why it is important to study the history of hospital care for your profession. Additional Requirements · Your paper should be 2–3 pages, in addition to the title page, appendix, and reference page. · Double space your paper, and use Times New Roman, 12-point font, as indicated in the assessment template. · Use a minimum of three resources. · Complete all parts of the assessment template, using the headings provided in the template. · Support all points with credible evidence, in the form of APA citations. · Include a references page in APA format with appropriate citations. · Complete the Comparative Analysis Table: Hospital Care Evolution table in the appendix of the assessment template. Competencies Measured By successfully completing this assessment, you will
  • 47. demonstrate your proficiency in the following course competencies and scoring guide criteria: · Competency 1: Analyze trends in the U.S. health care system from a historical perspective. . Compare and contrast the hospital environments of the 1800s, 1960s, and today. . Compare and contrast the level of care provided in hospitals of the 1800s, 1960s, and today. . Compare and contrast the payment systems in the hospitals of the 1800s, 1960s, and today. . Draw conclusions about how the hospital industry has evolved from the 1800s, to the 1960s, to today. · Competency 3: Analyze the development of medical education in the United States. . Compare and contrast the staff education level in hospitals of the 1800s, 1960s, and today. · Competency 4: Communicate in a manner that is scholarly, professional, and respectful of the diversity, dignity, and integrity of others. . Appropriately addresses all components of the assessment prompt, using the assessment description to structure text. . Apply APA 7th Edition formatting to in-text citations and references. Arctic Climate Change The difference during summer is increasing as the sea ice extension is decreasing in relation to the recent past. http://nsidc.org/arcticseaicenews/
  • 48. In lecture 1, we learned about the seasonal migration of Arctic sea ice extension. In this figure, it is very clear that 2012 was exceptional because the Arctic sea ice during that summer was at the greatest minimum ever observed, dropping far below the mean of the long term trend. Let’s take a look what happened after, particularly in 2016. (National Snow and Ice Data Center) This figure is based on a report of sea ice extension in November 2016. At the end of summer in 2016, the minimum sea ice extension was the second lowest after the 2012 extension (left red arrow). As the season migrates and turns colder, the sea ice did not grow back as fast as it should have relative to all previously measured patterns (right red arrow). By November, the sea ice extension was the lowest ever recorded in November. What was happening in 2016? Daily mean temperatures for the Arctic area north of the 80th northern parallel. (Danish Meteorological Institute) Arctic temperatures are about 20 degrees Celsius higher than normal above 80 degrees North Latitude! (Nov 2016).
  • 49. This figure shows daily temperature measurements in the Arctic at 80 degrees north in 2016 (red line) along with a computer simulation of temperature patterns based on long- term temperature measurements of the Arctic region (green line). The blue line is the point of freezing (0 degree Celsius). Please note that Y-axis identifies temperature shown in units Kelvin (K). Kelvin is a commonly used unit of measurement in science for temperature. Please see the following slide for more detail. The X-axis identifies the number of days in 2016. For example, the day 1 indicates January 1st, and the day 365 equates to December 31st. As you can see, there is seasonal variation. You will also notice that, most of the year, the temperature remains below the freezing level (blue line), although it will slightly exceed freezing for a short period of time during summer. In November of 2016, the temperature north of 80 degrees latitude was around -5 degrees C. This is below freezing (not by much), but is anomalous to the normal temperature of around - 25 degrees C (see vertical blue dashed line). The temperature difference between the long term mean (green line) and the observed temperature (red line) was as great as 20 degrees!! (continue)
  • 50. (continued) Why was this happening? Why did it happen in the Arctic? This phenomenon is known as polar amplification and it is important that we learn about this concept to understand how and why changes in our climate system affect different parts of the world unequally. For now, maintain an awareness of polar amplification as we will learn more about this concept in the following weeks. In the meantime, please take a moment to think about whether such daily temperature changes north of 80 degrees latitude are considered “climate” or “weather”? Further, please check the latest news from Arctic Sea Ice News and Analysis for additional information: https://nsidc.org/arcticseaicenews/ A recent science study reports that rapid warming in the Arctic is a likely driver of the recent extreme winter weather in the US. https://www.science.org/doi/10.11 26/science.abi9167?utm_campaign =SciMag&utm_source=Social&utm_ medium=Twitter https://nsidc.org/arcticseaicenews/ https://www.science.org/doi/10.1126/science.abi9167?utm_cam paign=SciMag&utm_source=Social&utm_medium=Twitter
  • 51. Fahrenheit is a temperature scale based on one proposed in 1724 by the German physicist Daniel Gabriel Fahrenheit. 0 F was the lowest temperature Dr. Fahrenheit could measure, 100 F is the average human core body temperature. In scientific measurement, Kelvin is more common because by definition 0 Kelvin is called absolute zero. Absolute zero is theoretically the lowest possible temperature where all molecules seize their motion (almost no heat is emitted by the molecule). In this slide, temperatures in Fahrenheit, Kelvin, and Celsius are compared in the same scale. Weather Forecasting • Weather affects nearly everyone, every day. • Weather forecasts are issued: o To save lives o Reduce property damage o Reduce crop damage o To let the general public know what to expect • Forecasts are often utilized to make many important decisions on a daily basis
  • 52. • So how is it done, and how is it done correctly? National Weather Service Mission: • The NWS provides weather, hydrologic, and climate forecasts and warnings for the US, its territories, adjacent waters, and ocean areas for the protection of life and property and the enhancement of the national economy. Tools available to a forecaster… • Weather Observations (including surface data, satellite data, and radar data) • Commercial aircraft data • Wind profilers • Numerical Model Output …There are a lot of sources for data! Forecasting technique - Persistence 13Image from WW2010 Online Guide The most primitive method of forecasting is to observe and
  • 53. estimate that there will be no changes to the present. Today is sunny, therefore, tomorrow will also be sunny. This may work relatively well in a dry and arid region, but does it work in the New England region? Probably not. The Trend Technique 15Image from Meteorology Today by C. Donald Ahrens Another method of forecasting that has been used in the more recent past is to understand trends. As we all know, however, weather systems migrate from west to east in the mid latitude, where we live, due to prevailing wind called the westerly (we will cover this in the following weeks). The atmospheric pressure system, in general, crosses over North America in 3 to 5 days. With this, the system travels approximately 800 miles per day. With this understanding, we can broadly predict when a storm will approach a specified region. Can this be used to make an accurate prediction? Although this maybe not be a desirable way to forecast for a long-term period, it may work for a shorter and current time interval.
  • 54. The Analogue Technique 17 The analogue technique is a combination of climate and weather. Based on long- term observations, you might be able to identify a clear pattern in the atmospheric system. For instance, you may notice that, statistically, when a dry and cold weather pattern is observed in the northwest (high pressure system), there is a tendency for stormy weather in the northeast (low pressure system). This method could be useful and may produce relatively reliable results for slightly longer time periods (few days to a week). Accuracy and skill in forecasting After you learn about forecasting techniques, you may be asking yourself – what is an ”accurate” forecast? • What is an accurate forecast? o Your forecast for tonight’s minimum temp is 0F If the actual minimum was 1F, is it inaccurate?? If the actual minimum was 10F, is it inaccurate?? o Accuracy (in forecasting) is arbitrary and relative – it is not
  • 55. clearly or objectively defined. 19 Modern weather forecasts are based on model forecasts – Numerical Weather Prediction In order to increase accuracy, we heavily rely on numerical weather prediction. • Predict the state of the atmosphere (e.g., pressure, temperature, precip, winds, etc) in time • Use mathematical equations – initialized with observational data …Why are models often wrong? 20 Problems with numerical modeling 21 • Models represent a “simplified” atmosphere – not every real process in atmosphere can be resolved in models. • Many are not global in coverage • The initial atmospheric state is not well-known
  • 56. • The data may also have errors in it • The model equations compute quantities at grid points (30- 50km). • The atmosphere is fundamentally chaotic! So, the atmosphere is fundamentally chaotic and this is why weather forecasting, although state of the art, is still not perfect. Therefore, in order to understand the climate system, scientists focus on key phenomena and/or relationships that effectively control or alter the climate system of the Earth. Here, we call them the “climate knobs” and let’s talk more about it in the next lecture. Here is a news from weather forecast development: Artificial Intelligence May Be Key to Better Weather Forecasts Recent advances in machine learning hold great potential for converting a deluge of data into weather forecasts that are fast, accurate, and detailed. By Sid-Ahmed Boukabara, Vladimir Krasnopolsky, Jebb Q. Stewart, Stephen G. Penny, Ross N. Hoffman, and Eric Maddy, 1 August 2019 https://eos.org/opinions/artificial-intelligence-may-be-key-to- better-weather-forecasts
  • 57. mailto:[email protected] https://eos.org/opinions/artificial-intelligence-may-be-key-to- better-weather-forecasts https://www.ncdc.noaa.gov/billions/overview “In 2021, there were 20 weather/climate disaster events with losses exceeding $1 billion each to affect the United States.” “Overall, these events resulted in the deaths of 688 people and had significant economic effects on the areas impacted.” https://www.ncdc.noaa.gov/billions/overview https://www.noaa.gov/news/2021-was-worlds-6th- warmest-year-on-record 2021 was world’s 6th-warmest year says NOAA https://medialibrary.climatecentral.org/resources/2020-in- review-global-temperature-rankings – Could we have predicted that 2021 would become the 6nd warmest year on record or predict what 2022 temperatures will look like when the report becomes available? The answer is no. However, you can look into the long-term trend and anticipate what likely will happen in the future! (weather vs climate) https://www.noaa.gov/news/2021-was-worlds-6th-warmest-year-
  • 58. on-record https://medialibrary.climatecentral.org/resources/2020-in- review-global-temperature-rankings Please take a moment to read the article published in March 2017 about our perceptions of climate change. This was before the catastrophes caused by Hurricane Harvey and Hurricane Irma in 2017. How Americans Think About Climate Change, in Six Maps By NADJA POPOVICH, JOHN SCHWARTZ and TATIANA SCHLOSSBERG MARCH 21, 2017 https://www.nytimes.com/interactive/201 7/03/21/climate/how-americans-think- about-climate-change-in-six-maps.html https://www.nytimes.com/interactive/2017/03/21/climate/how - americans-think-about-climate-change-in-six-maps.html Example Test 1 question: Climate differs from weather in that A. climate is a broad composite of temperature conditions, while weather addresses temperature as well as precipitation, snow and ice cover, and wind conditions. B. climate change occurs over longer durations than do weather changes.
  • 59. C. climate change is exclusively global, whereas weather is exclusively regional. D. climate and weather do not differ, they are interchangeable terms. At last, here is an example questions in preparation for the test. The questions in test 1 will be similar in format to this question, but not necessarily the same question. The answer is B.