


![References
Bluman, A. (2012). Elementary statistics: A step by step approach (8th ed.) [International
edition]. New York, NY: Mc-Graw Hill.
Fraenkel, J. R., & Wallen, N. E. (2006). How to design and evaluate research in education (6th ed.).
New York, NY: Mc-Graw Hill
Saunders, M., Lewis, P., & Thornhill, A. (2012). Research methods for business students (6th ed.).
Harlow, England: Prentice Hall.
25](https://image.slidesharecdn.com/7-160824112855/75/7-lo1-lo4-sampling-25-2048.jpg)

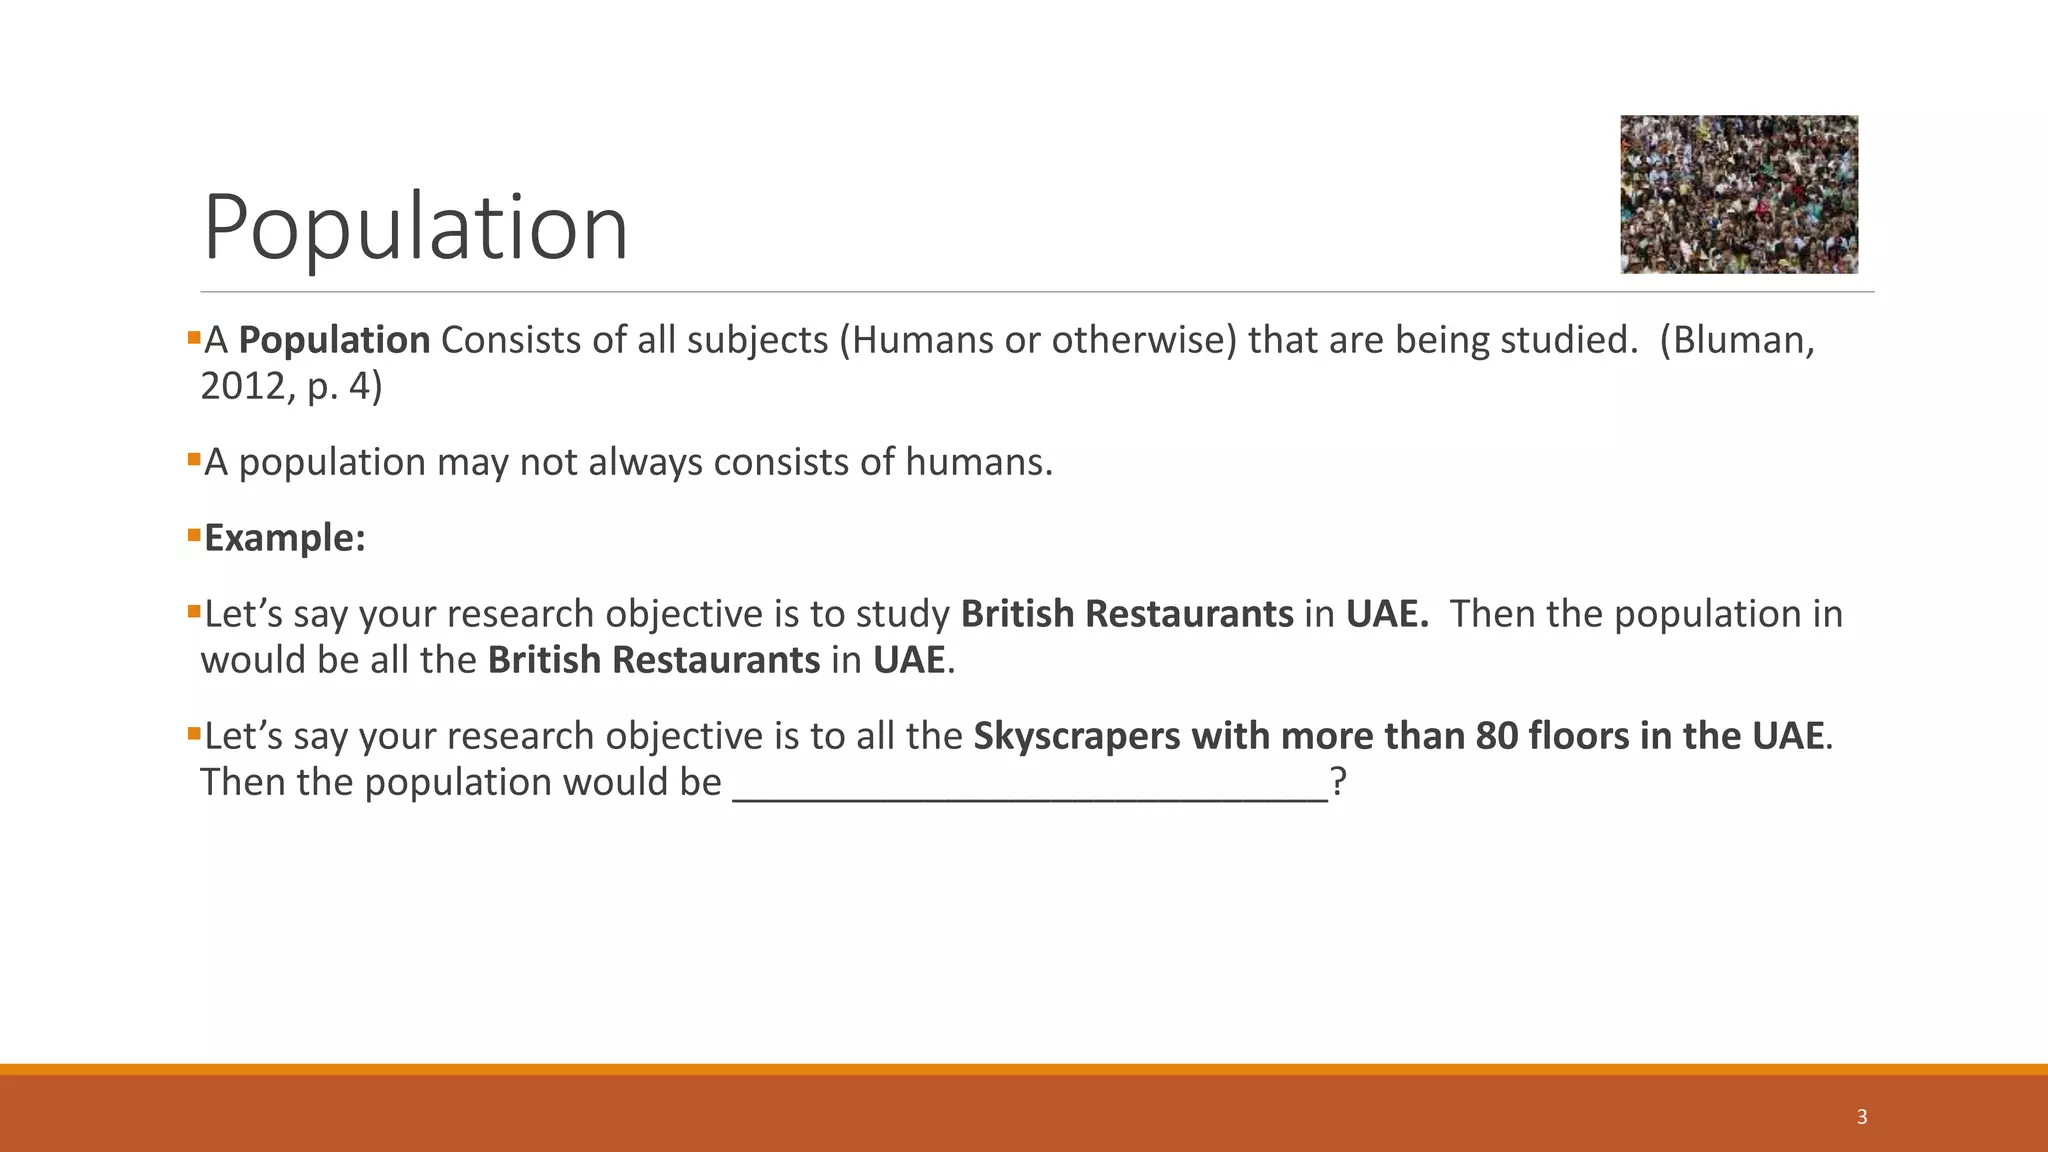
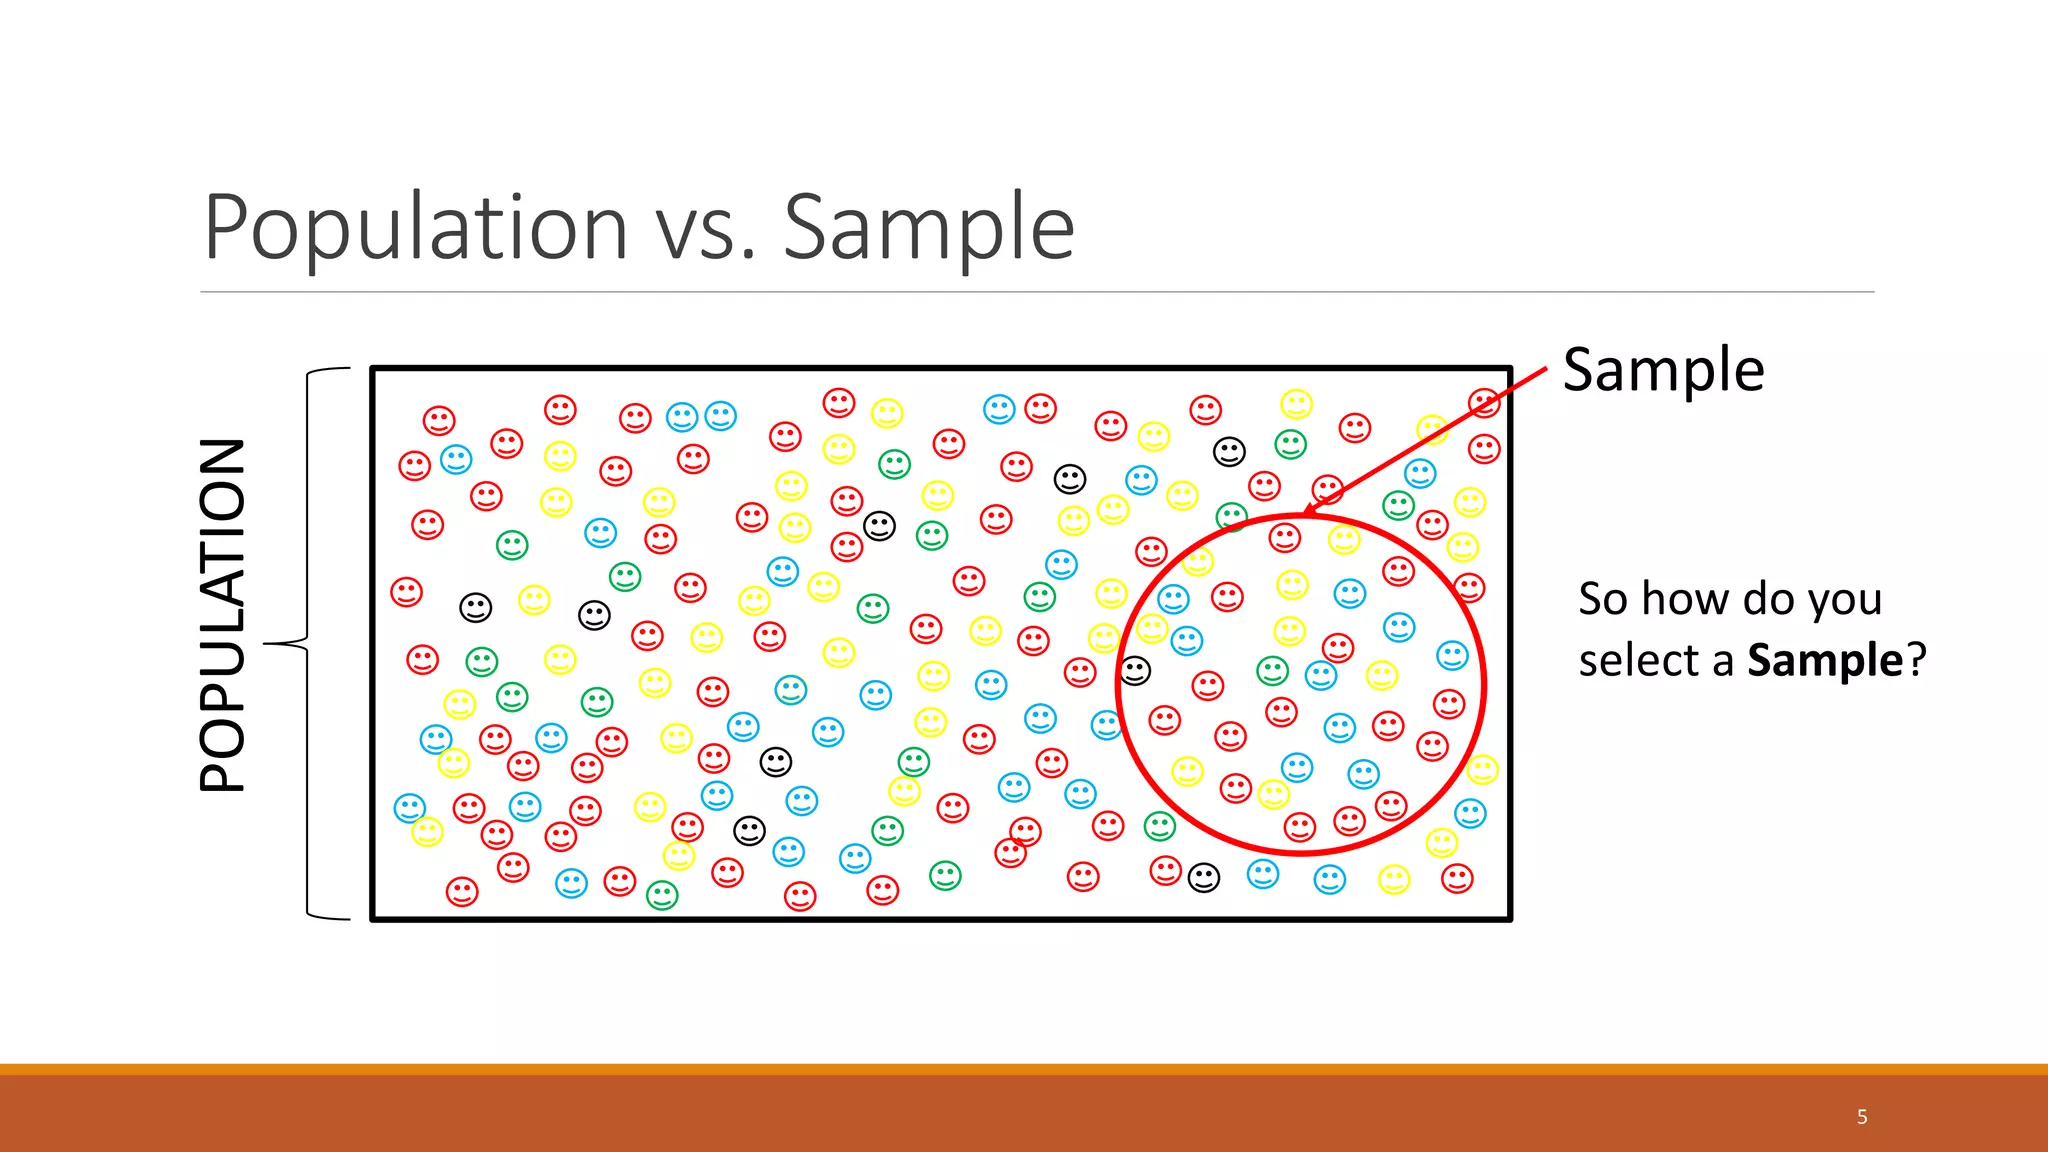
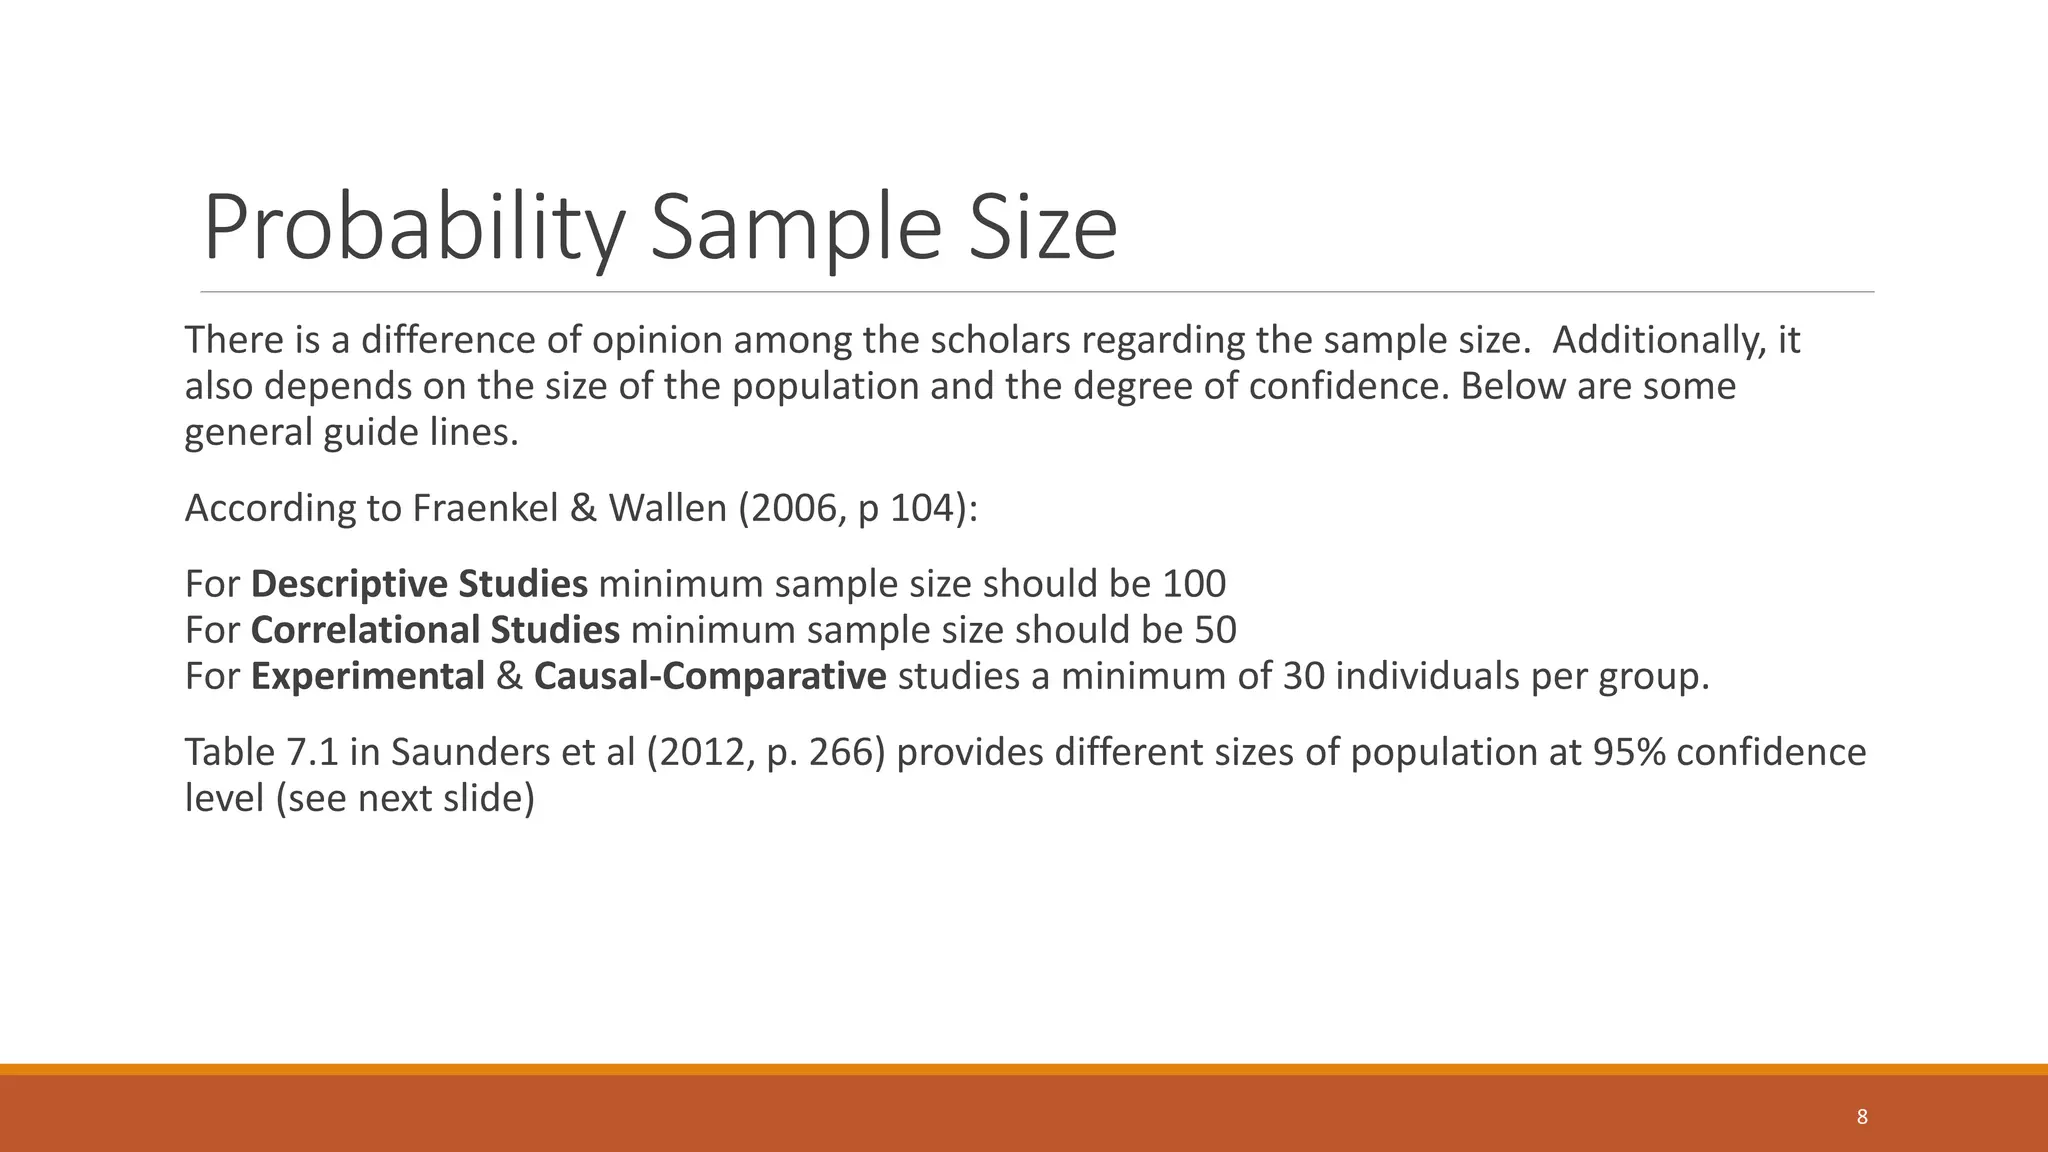
This document discusses various sampling techniques used in statistics. It defines key statistical concepts like population, sample, descriptive statistics, and inferential statistics. It then explains different types of sampling techniques including probability sampling methods like simple random sampling, systematic sampling, stratified sampling, cluster sampling and non-probability sampling methods like quota sampling, purposive sampling, volunteer sampling, and convenience sampling. For each technique, it provides examples and considerations for selecting an appropriate sampling method.


![Research Design [Creswell]](https://cdn.slidesharecdn.com/ss_thumbnails/eng60115jan2013-1-130115121702-phpapp01-thumbnail.jpg?width=640&height=640&fit=bounds)


![Energy ppt[1]](https://cdn.slidesharecdn.com/ss_thumbnails/energyppt1-120304131809-phpapp02-thumbnail.jpg?width=640&height=640&fit=bounds)


