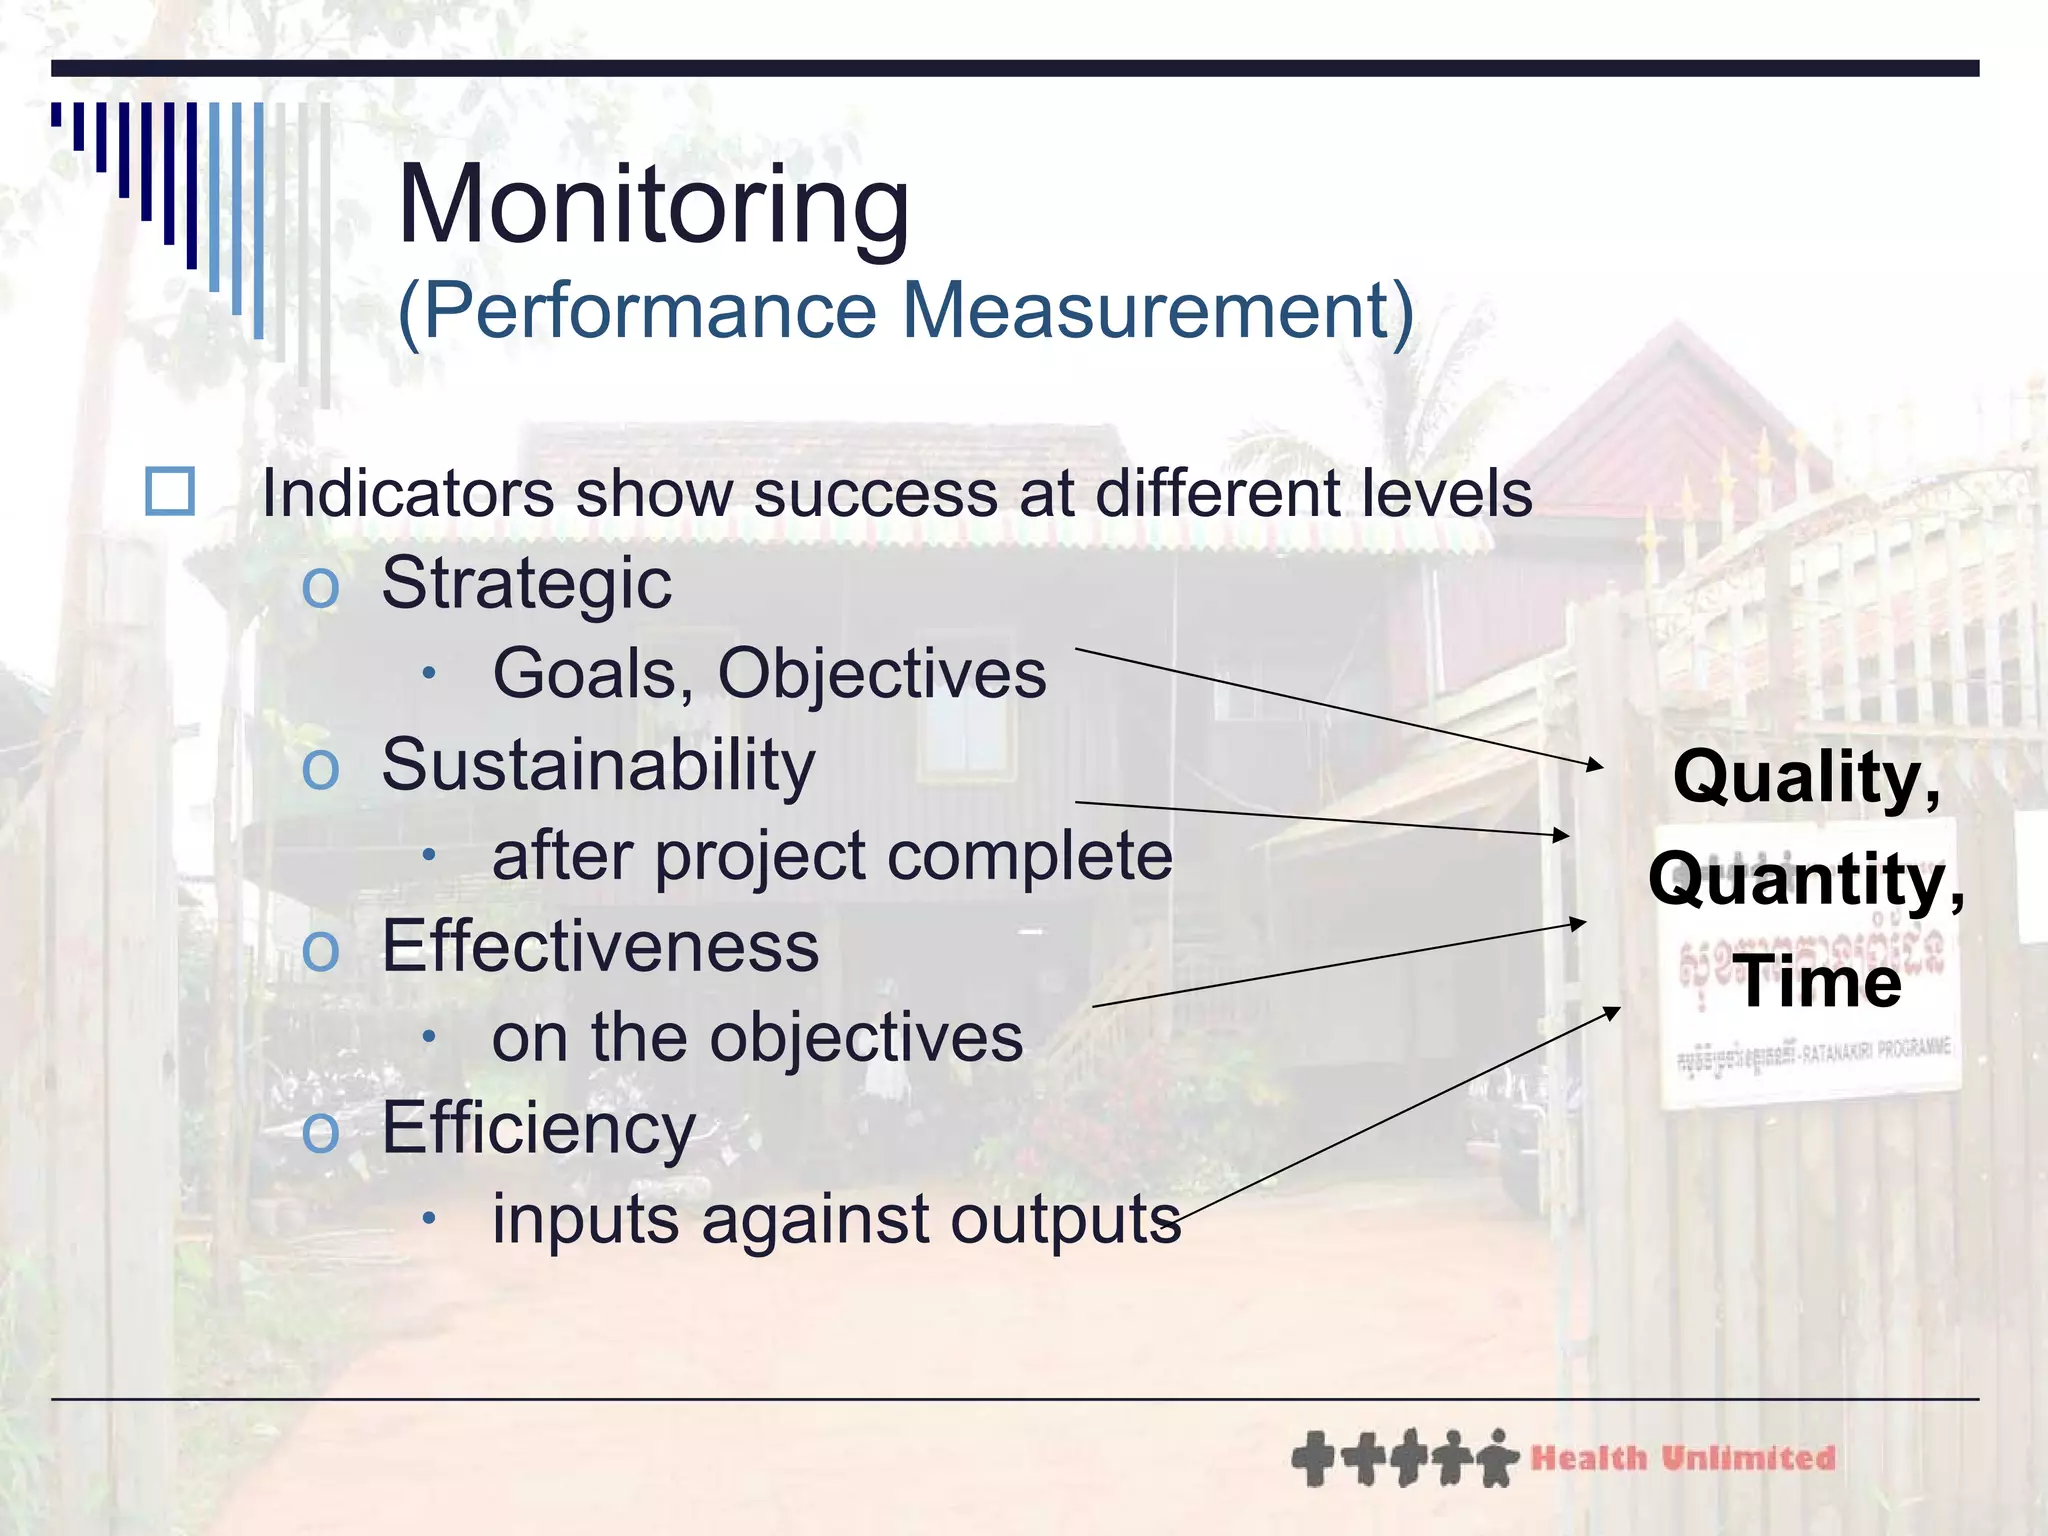
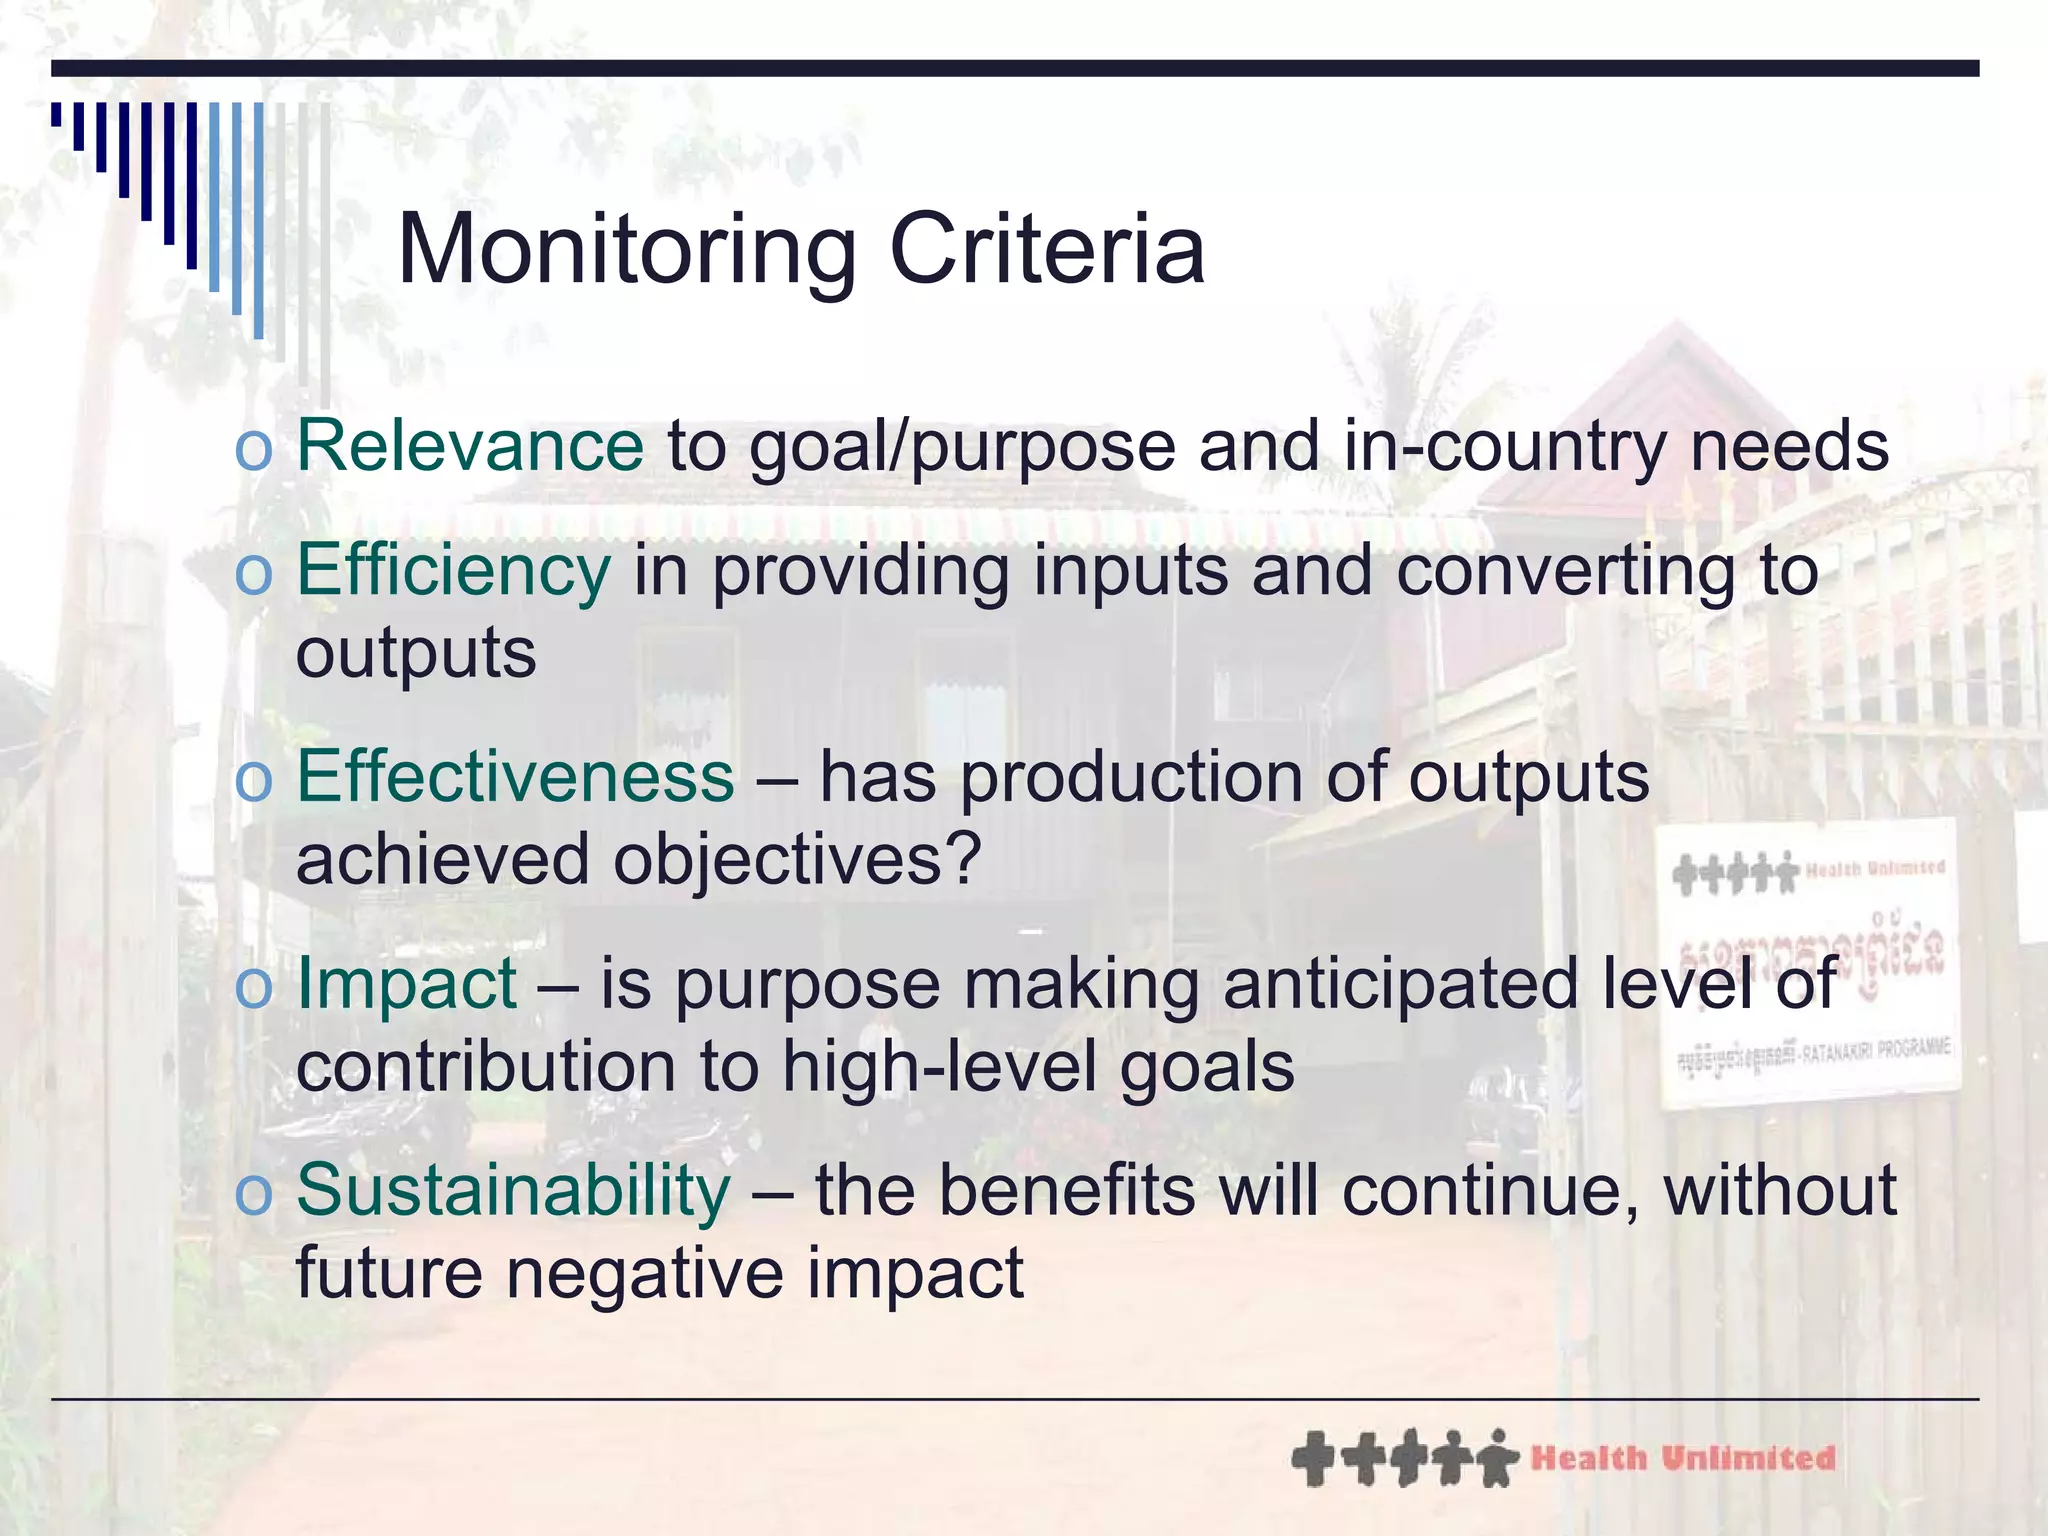
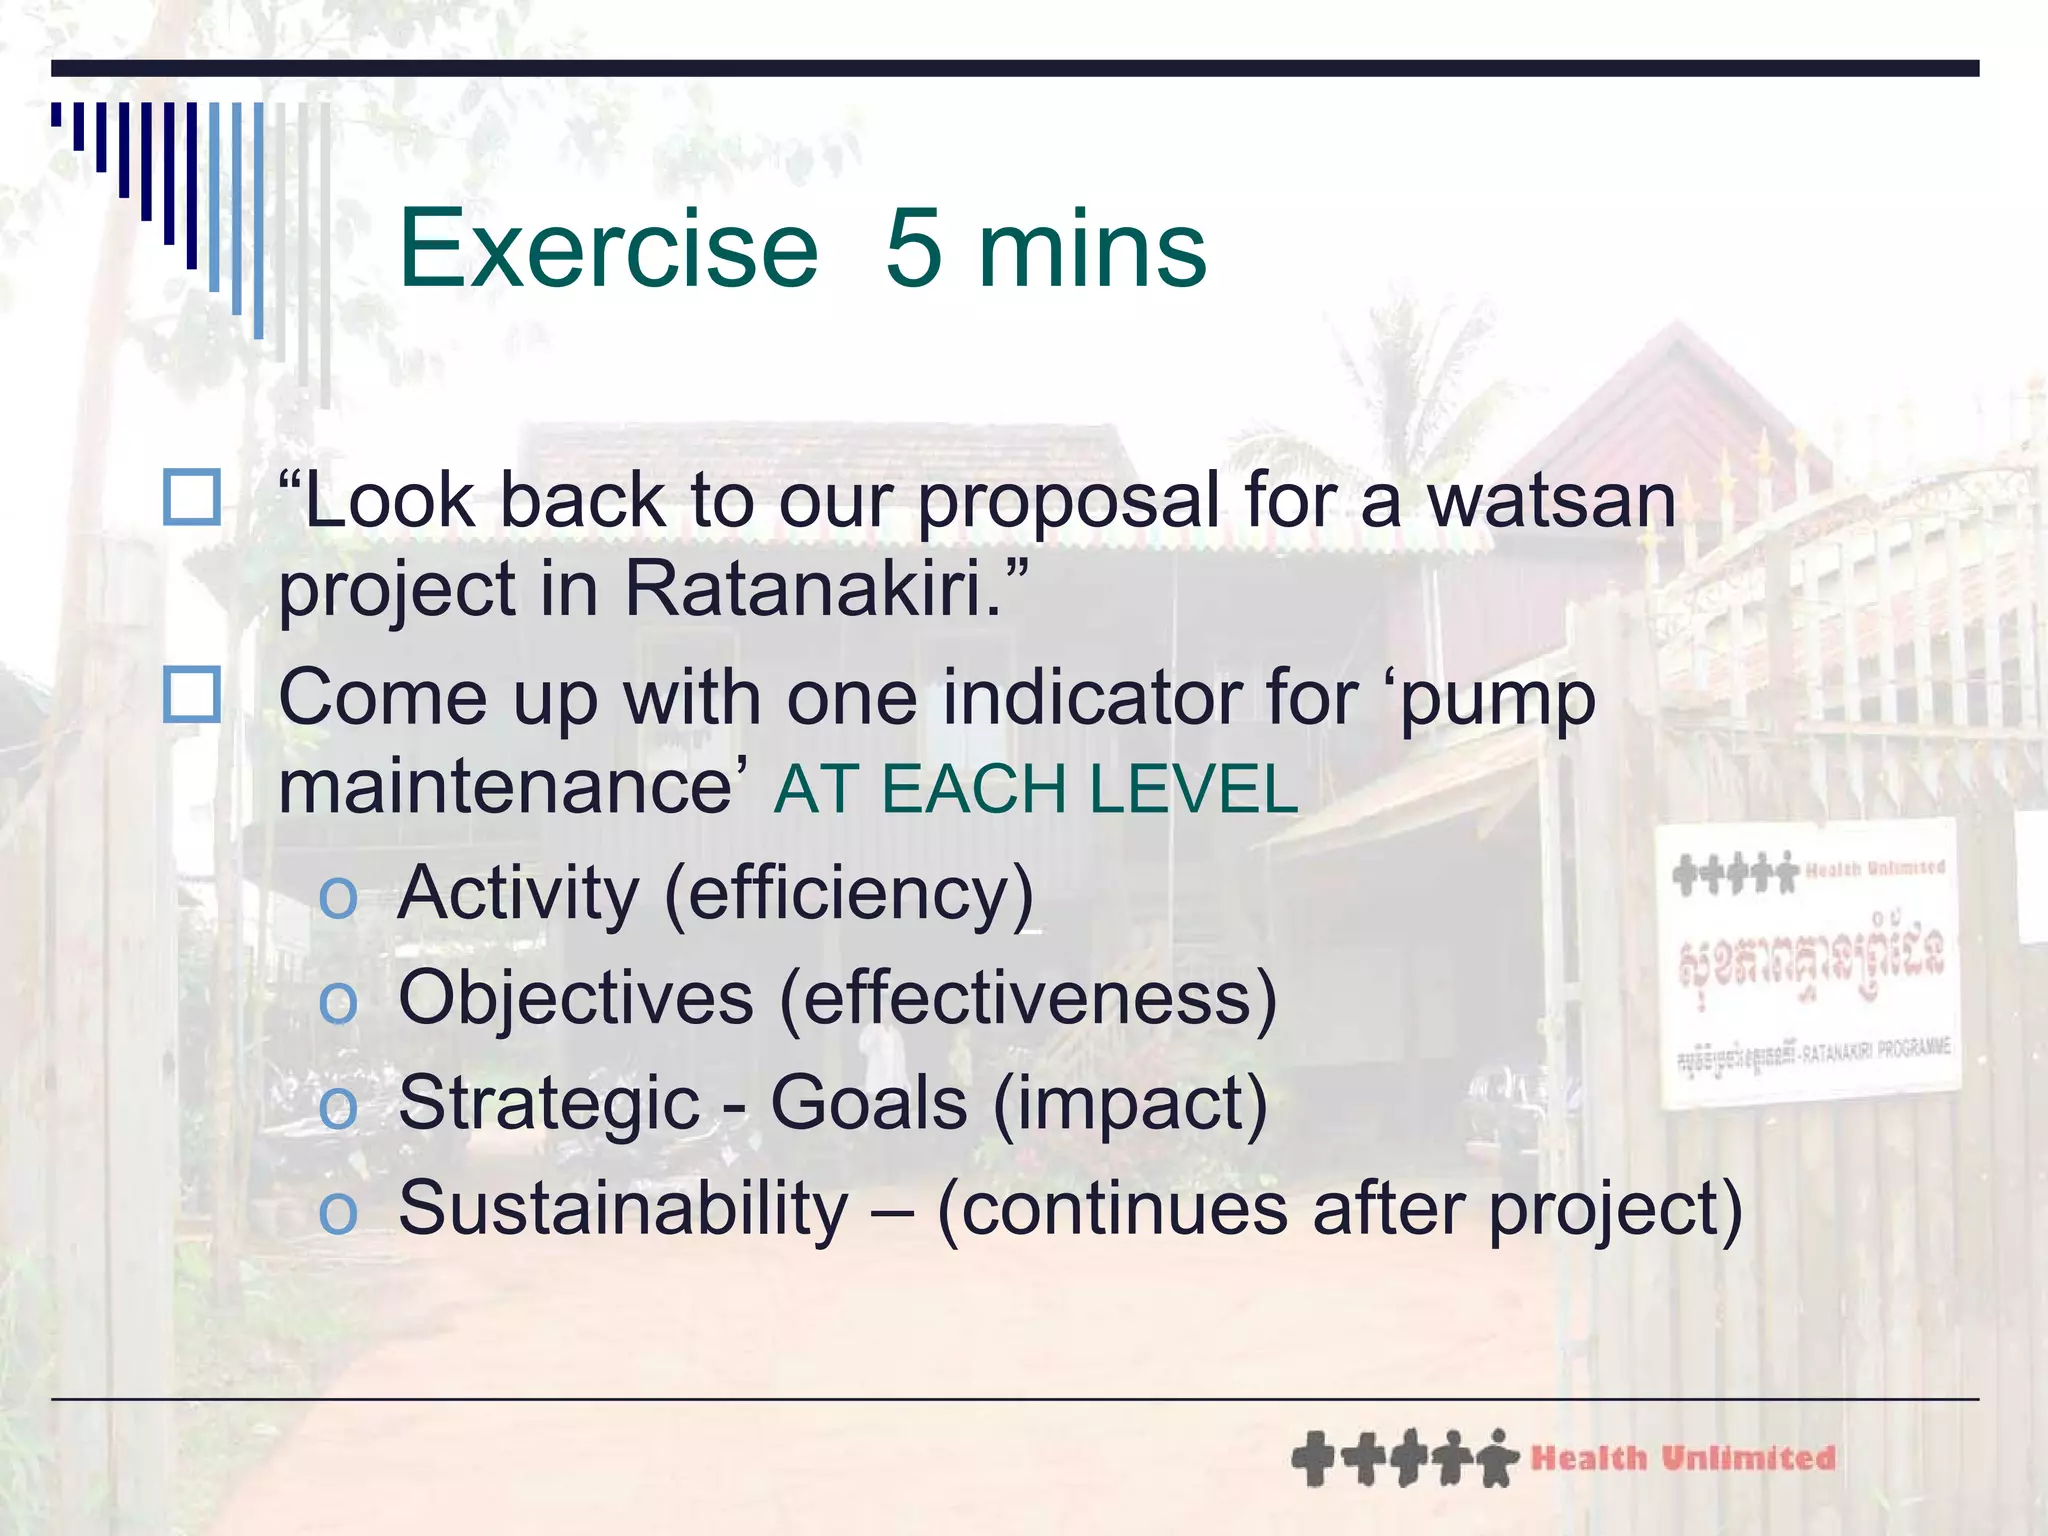
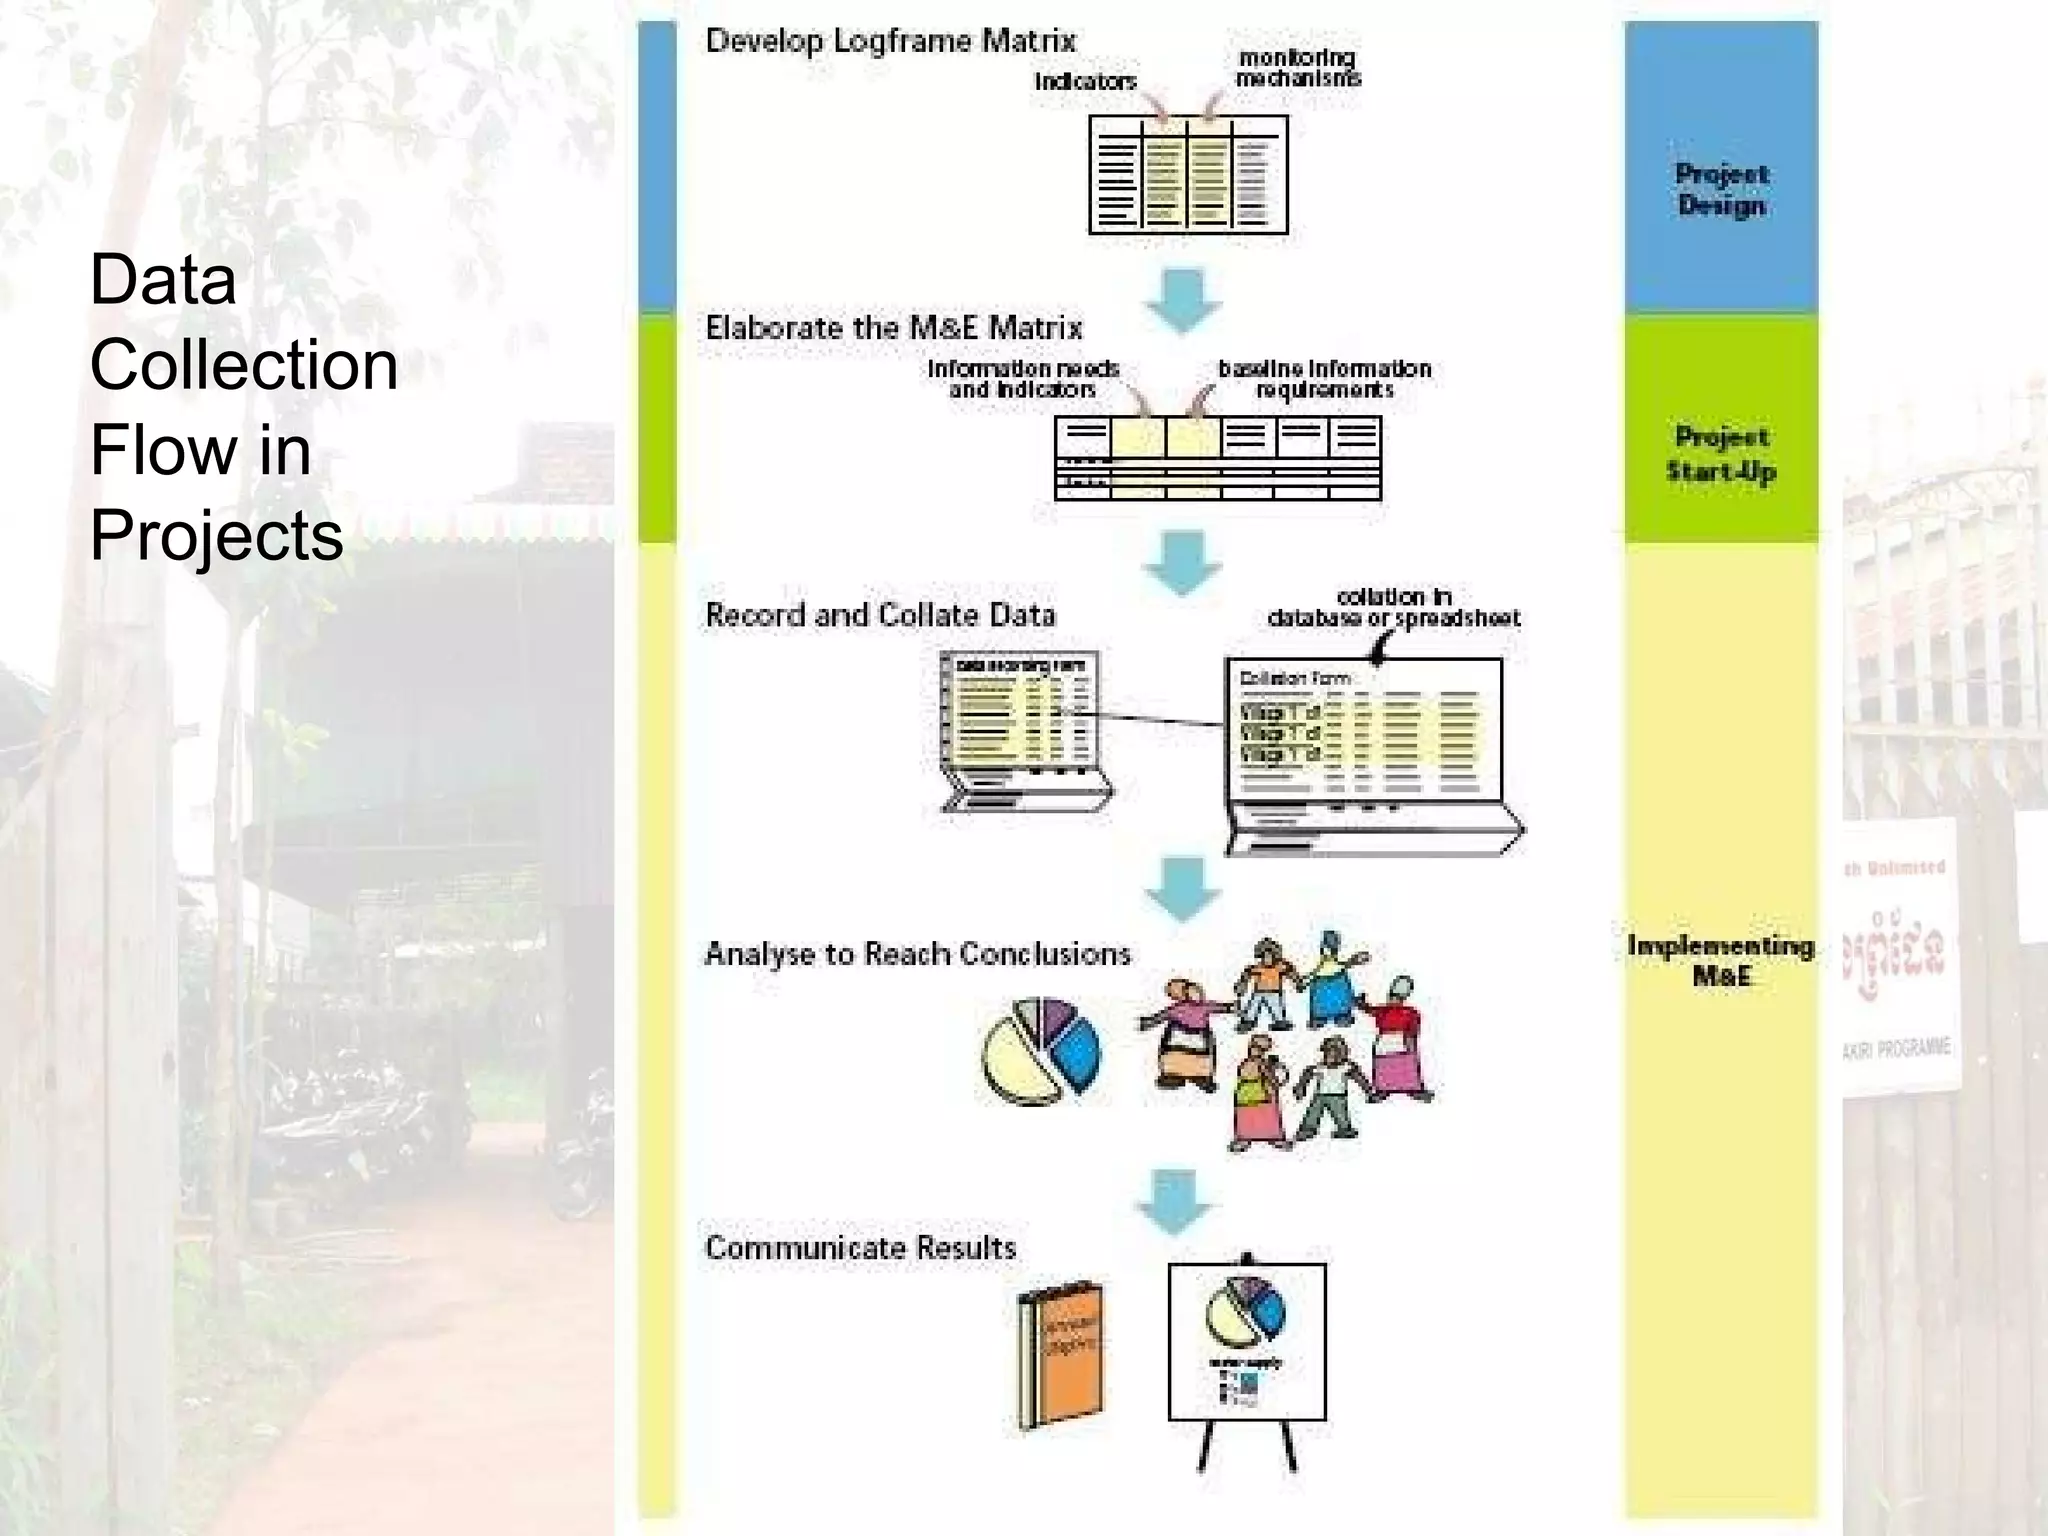
Development Project Planning 5 Monitoring and Evaluation Indicators
This Session Recap – about M&E and Indicators M&E Planning  Some Indicators  choosing  setting up
Monitoring Performance Measurement  of the  Process against the sections of the Logical Framework routine Inputs Outputs Outcomes ( Results Based Management )
What Indicators Show Utilisation Shows if a service is being used, e.g. •  Number of people attending a nutrition course Utilisation Coverage Shows what proportion of people / groups in need receive a service, e.g. •  Proportion of schools with an AIDS awareness club Coverage Performance shows how well something was done, e.g. •  Number of reported cases of STIs Performance Shows what a service has done or provided, e.g. •  Number of condoms distributed Activity or Output Shows what goes in to providing a service - the resources used, e.g. •  Amount spent on travel per week Inputs
Monitoring  (Performance Measurement) Indicators show success at different levels Strategic Goals, Objectives Sustainability after project complete Effectiveness on the objectives Efficiency inputs against outputs  Quality,  Quantity,  Time
Monitoring Criteria Relevance  to goal/purpose and in-country needs Efficiency  in providing inputs and converting to outputs Effectiveness  – has production of outputs achieved objectives? Impact  – is purpose making anticipated level of contribution to high-level goals Sustainability  – the benefits will continue, without future negative impact
Exercise  5 mins “ Look back to our proposal for a watsan project in Ratanakiri.” Come up with one indicator for ‘pump maintenance’  AT EACH LEVEL   Activity (efficiency) Objectives (effectiveness) Strategic - Goals (impact) Sustainability – (continues after project)
Data Collection Flow in Projects
What should you monitor and how?   You should monitor information that will help you to track what you are doing and to measure the success of your work.  So you should review your objectives and indicators and decide what information needs to be collected to allow the indicators to be measured.  You should only collect information that you will use.
Evaluation “episodic” – happens at certain times, not routine Looks at the  Impact  (Impact Assessment)
Evaluation:  Impact Assessment Approach Impact from beneficiaries’ point of view What do they think is significant? To whom is it important? Ex-ante and Ex-post Criteria Efficiency – relate inputs to outputs Effectiveness- extent to which achieved objectives Consistency- methods/approaches with objectives Impact – change to lives/environment
Audit Mainly look at financial operations and statements compliance with legal and contractual obligations external, imposed Can have “Performance Audits” efficiency and good management Data Quality audits
What is an Indicator ? a  variable  … that  measures one aspect  of a project that is  directly related  to the program’s objectives.
Break Please – back here ON TIME !
A good indicator should: produce the same results when used repeatedly to measure the same condition or event; measure only the condition or event it is intended to measure; show changes in the state or condition over time; have reasonable measurement costs; and be defined in clear and unambiguous terms.
Good Indicator  - is… Valid  - measures what it is intended to  Reliable  - accurate, repeatable Precise  - measures intended condition only Independent  - gives a line of possible results Timely  - available when needed Comparable  - with other similar situations Varies  - shows changes in the metric over time; Costed  - reasonable measurement costs; and Defined  - in clear and unambiguous terms.
Other Factors In Indicator Choice Data availability Resources Program needs Donor requirements
Indicators:  An Example Objective:  Polluted water put into the Bassac is reduced Select the indicator:  Concentration of heavy metals ( Pb, Cd, Hg ) Define the targets: the quantity:  Co ncentration  of heavy metal compounds ( Pb, Cd, Hg )  is r educed  by   75 %   from year 2008 levels  …   the quality:  ...  to meet the limits  for  irrigation  water  . .. the target group:  ...   used by the farmers of Phan village,  ... the place :  ...  in  Buphon District,  ... the time:  ...  2 years after the project has started  .
Reporting Times ● Health services statistics ● Health facility surveys ● Program monitoring Continuously Input/Process ● Surveillance ● Population-based surveys ● Special studies 2 to 5 years Impact ● Population-based surveys ● Health facility surveys ● Special studies 1 to 3 years Outcome ● Health services statistics ● Health facility surveys ● Program monitoring Quarterly, semi-annually, or annually Output Examples of Data Collection Methods Frequency of Reporting Level of Indicator
Means of Verification M&E plans should include multiple data sources.  they should include indicators that use data from each sector, and  include data from the program facilities, population measures, and special surveys. The M&E plan should clearly state the sources for collecting data and how often the data should be collected.
Means of Verification Data source must be: Available time cost Accurate Showing what you want to show Show what is really there
Exercise Look at our watsan logframe Fill in the MoV column
Data Systems Tools: Progress reports Team meetings, team briefing reports HIS records
Evaluation Plan A part of the project documents Use to plan staff needs and budget
Contents of a Typical Evaluation Plan (1) Brief project description Objectives of the project Objectives of the evaluation
Contents of a Typical Evaluation Plan (2) Evaluation methodology – type of evaluation, indicators for each objective, data collection methods, sample size, methods of sampling / selecting participants Resources needed, timetable, and budget – material, human, financial, transportation and logistics Planned use of results – for example, improve the project mid-course, plan future projects, guide decision-making
Thankyou   GrKuN
Produced by Tony Hobbs Health Unlimited,  Ratanakiri, Cambodia www.healthunlimited.org With the support of  Australian Volunteers International www.australianvolunteers.com © 2009 HU. Use with Acknowledgement

7 M&E: Indicators

  • 1.
    Development Project Planning5 Monitoring and Evaluation Indicators
  • 2.
    This Session Recap– about M&E and Indicators M&E Planning Some Indicators choosing setting up
  • 3.
    Monitoring Performance Measurement of the Process against the sections of the Logical Framework routine Inputs Outputs Outcomes ( Results Based Management )
  • 4.
    What Indicators ShowUtilisation Shows if a service is being used, e.g. • Number of people attending a nutrition course Utilisation Coverage Shows what proportion of people / groups in need receive a service, e.g. • Proportion of schools with an AIDS awareness club Coverage Performance shows how well something was done, e.g. • Number of reported cases of STIs Performance Shows what a service has done or provided, e.g. • Number of condoms distributed Activity or Output Shows what goes in to providing a service - the resources used, e.g. • Amount spent on travel per week Inputs
  • 5.
    Monitoring (PerformanceMeasurement) Indicators show success at different levels Strategic Goals, Objectives Sustainability after project complete Effectiveness on the objectives Efficiency inputs against outputs Quality, Quantity, Time
  • 6.
    Monitoring Criteria Relevance to goal/purpose and in-country needs Efficiency in providing inputs and converting to outputs Effectiveness – has production of outputs achieved objectives? Impact – is purpose making anticipated level of contribution to high-level goals Sustainability – the benefits will continue, without future negative impact
  • 7.
    Exercise 5mins “ Look back to our proposal for a watsan project in Ratanakiri.” Come up with one indicator for ‘pump maintenance’ AT EACH LEVEL Activity (efficiency) Objectives (effectiveness) Strategic - Goals (impact) Sustainability – (continues after project)
  • 8.
  • 9.
    What should youmonitor and how? You should monitor information that will help you to track what you are doing and to measure the success of your work. So you should review your objectives and indicators and decide what information needs to be collected to allow the indicators to be measured. You should only collect information that you will use.
  • 10.
    Evaluation “episodic” –happens at certain times, not routine Looks at the Impact (Impact Assessment)
  • 11.
    Evaluation: ImpactAssessment Approach Impact from beneficiaries’ point of view What do they think is significant? To whom is it important? Ex-ante and Ex-post Criteria Efficiency – relate inputs to outputs Effectiveness- extent to which achieved objectives Consistency- methods/approaches with objectives Impact – change to lives/environment
  • 12.
    Audit Mainly lookat financial operations and statements compliance with legal and contractual obligations external, imposed Can have “Performance Audits” efficiency and good management Data Quality audits
  • 13.
    What is anIndicator ? a variable … that measures one aspect of a project that is directly related to the program’s objectives.
  • 14.
    Break Please –back here ON TIME !
  • 15.
    A good indicatorshould: produce the same results when used repeatedly to measure the same condition or event; measure only the condition or event it is intended to measure; show changes in the state or condition over time; have reasonable measurement costs; and be defined in clear and unambiguous terms.
  • 16.
    Good Indicator - is… Valid - measures what it is intended to Reliable - accurate, repeatable Precise - measures intended condition only Independent - gives a line of possible results Timely - available when needed Comparable - with other similar situations Varies - shows changes in the metric over time; Costed - reasonable measurement costs; and Defined - in clear and unambiguous terms.
  • 17.
    Other Factors InIndicator Choice Data availability Resources Program needs Donor requirements
  • 18.
    Indicators: AnExample Objective: Polluted water put into the Bassac is reduced Select the indicator: Concentration of heavy metals ( Pb, Cd, Hg ) Define the targets: the quantity: Co ncentration of heavy metal compounds ( Pb, Cd, Hg ) is r educed by 75 % from year 2008 levels … the quality: ... to meet the limits for irrigation water . .. the target group: ... used by the farmers of Phan village, ... the place : ... in Buphon District, ... the time: ... 2 years after the project has started .
  • 19.
    Reporting Times ●Health services statistics ● Health facility surveys ● Program monitoring Continuously Input/Process ● Surveillance ● Population-based surveys ● Special studies 2 to 5 years Impact ● Population-based surveys ● Health facility surveys ● Special studies 1 to 3 years Outcome ● Health services statistics ● Health facility surveys ● Program monitoring Quarterly, semi-annually, or annually Output Examples of Data Collection Methods Frequency of Reporting Level of Indicator
  • 20.
    Means of VerificationM&E plans should include multiple data sources. they should include indicators that use data from each sector, and include data from the program facilities, population measures, and special surveys. The M&E plan should clearly state the sources for collecting data and how often the data should be collected.
  • 21.
    Means of VerificationData source must be: Available time cost Accurate Showing what you want to show Show what is really there
  • 22.
    Exercise Look atour watsan logframe Fill in the MoV column
  • 23.
    Data Systems Tools:Progress reports Team meetings, team briefing reports HIS records
  • 24.
    Evaluation Plan Apart of the project documents Use to plan staff needs and budget
  • 25.
    Contents of aTypical Evaluation Plan (1) Brief project description Objectives of the project Objectives of the evaluation
  • 26.
    Contents of aTypical Evaluation Plan (2) Evaluation methodology – type of evaluation, indicators for each objective, data collection methods, sample size, methods of sampling / selecting participants Resources needed, timetable, and budget – material, human, financial, transportation and logistics Planned use of results – for example, improve the project mid-course, plan future projects, guide decision-making
  • 27.
    Thankyou GrKuN
  • 28.
    Produced by TonyHobbs Health Unlimited, Ratanakiri, Cambodia www.healthunlimited.org With the support of Australian Volunteers International www.australianvolunteers.com © 2009 HU. Use with Acknowledgement

Editor's Notes

  • #2 Watsan Proposal from last session Print evaluation plan
  • #4 Focussing on the PROCESS
  • #6 Focussing on the PROCESS Start at the bottom and work up We can look at monitoring the same way … (next slide)
  • #7 Prerequisites: baseline studies, effectiveness questionnaires interviews, efficiency largely quantitative – Cost Benefit Analysis Think creatively about sources of data and methods of collection Participatory impact monitoring: return to combination of monitoring and evaluation but not so donor-led Cost: 2-3% for agric/rural dev project 5% complex or urban projects
  • #11 Focussing on the IMPACTS At evaluation level a social cost-benefit analysis as well as cost-benefit analysis is useful Roche’s model assumes sustainability – generic indicators Rights, Livelihoods, Knowledge, Resources
  • #12 Focussing on the IMPACTS At evaluation level a social cost-benefit analysis as well as cost-benefit analysis is useful Roche’s model assumes sustainability – generic indicators Rights, Livelihoods, Knowledge, Resources
  • #14 No detail – go on to next 3 slides
  • #16 This is often expressed as.. (go to next slide)
  • #19 (check the availability of baseline information)
  • #22 Accurate – not just correct, but reflecting the intended output
  • #29 Watsan Proposal from last session Print evaluation plan