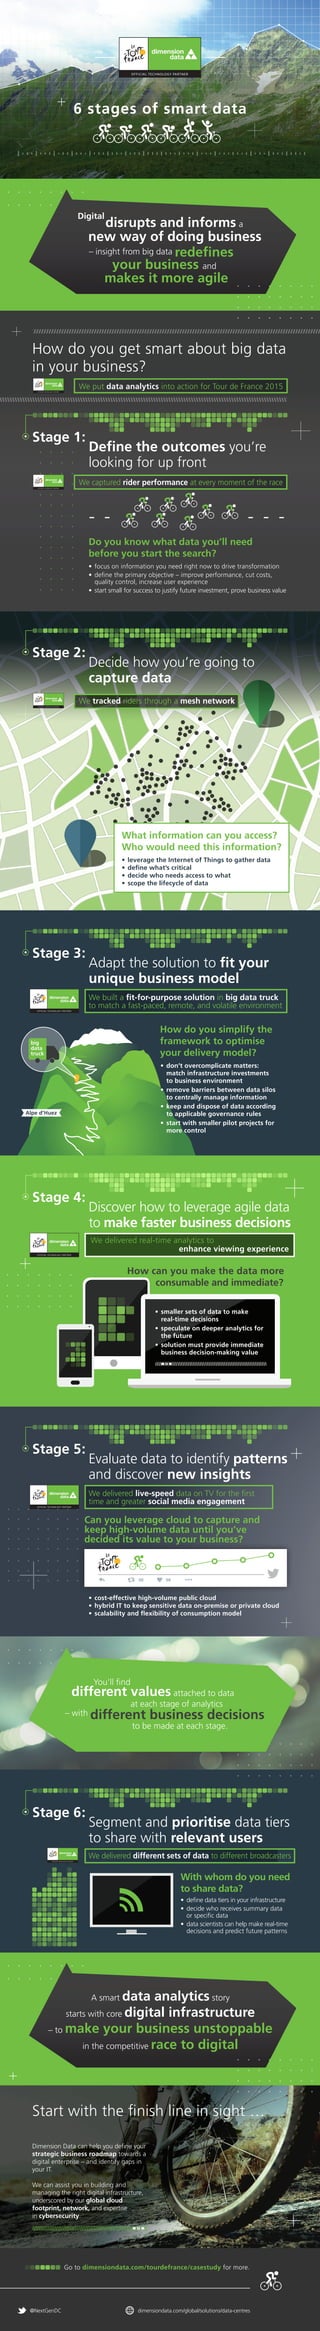
How do you get smart about big data in your business? This is how we put data analytics into action at the Tour de France 2015. Follow these 6 simple steps to achieve smarter data.
Strengthening Cybersecurity at the tour de franceDImension Data
Here's a look at how we successfully thwarted all attempts to breach our perimeter, and intruder activity during the Tour de France.
Between March and July 2015, we saw a 56% increase in reconnaissance scans targeting Dimension Data's website - none were successful.
Digital technology revolutionised the viewing experience of the tour de franceDImension Data
How did A.S.O and Dimension Data find new ways of engaging billions of Tour de France fans around the world? We focused our digital and transformational technology on four areas: digital infrastructure, cloud, cyber security and workspaces for tomorrow. This is how we did it.
Cloud is critical to competing in the digital economy. Today, your customers search for, discover, interact with, and buy products and services differently. Is your business ready to adapt? Cloud puts you on the path to digital innovation… and extending and deepening your customer relationships.
Here's a breakdown of how Cloud gives you speed-to-market, agility, security, availability and resilience.
Zurich case study how to move a data centre in 8 daysDImension Data
Dimension Data helped Zurich improve its ability to look after its financial services customers around the world, using technology to do it. Check out this infographic to see how this was acheived
How the IoT market may change our digital life thanks to the Data Tsunami it ...Dataconomy Media
Laurent Marchou is the IoT & Robotics Director running the open-innovation product marketing team of Orange Innovation Department (Technocentre) thanks to products like Datavenue, Ub-y or LoRa starter kit. He loves working on disruption topics and was in charge of Broadband offers for Wanadoo (a long long time ago :) ) and Product Marketing Manager on mobile market. Laurent is graduate from ESME Engineering School (Telecom Dept with TelecomParisTech) and from HEC with an advance certificate (Business Unit Management)
2018 GIS in the Rockies Vendor Showcase (Th): Solving Real World Issues With ...GIS in the Rockies
With the proliferation of location-aware mobile devices and the emergence of everyday analytics, geospatial technology now spans every market, crosses national boundaries, and affects every trending issue. There is no doubt that cloud-based solutions are increasing in demand, requiring next generation, customizable technology to harness multisource data and transform it into focused solutions to be consumed by users of every level. The M.App Portfolio platform is designed to create smart, lightweight, customized market applications that address unique business and industry problems by combining geospatial analytics with cloud technology, as well as enterprise-level deployment environments. These applications, known as Hexagon Smart M.Apps, link sophisticated analytics and spatial models to geospatially relevant information, conveying data about solutions through intuitive, customizable, interactive and innovative displays. In this presentation, you will see several Smart M.Apps in action to better understand how this platform is changing the way we visualize, interpret, and interact with spatial information. Learn how Hexagon Geospatial has teamed with the World Antiquities Coalition to use Smart M.App technology to track missing and stolen cultural artifacts. See how the Green Space Analyzer provides a new way for decision makers to influence policy. Understand how a Smart M.App helps count endangered species in Africa. See how Smart M.Apps address the problems of refugee camps and can be used in country-wide census. Hexagon Geospatial’s technology provides the ability to address the challenge of linking business information with multisource multi-sensor data, in near real-time to answer questions and make decisions about our dynamically changing Earth.
Combining Analytics and Experience For Digital DifferentiationAT Internet
Intervention de James McCormick, Principal Anlayst, Forrester Research lors du Digital Analytics Forum, événement AT Internet du 25 octobre 2016.
À l'ère des stratégies customer-centric, les entreprises doivent adopter une approche guidée par l'analytics pour proposer aux clients une expérience optimale pendant les phases d'engagement sur leurs dispositifs digitaux.
STRATIS, named one of Entrepreneur Magazine’s “Best Companies in America,” two years running, enables smart apartments and intelligent buildings. As the only system of its kind built for the complexities of MultiFamily and Student Housing, STRATIS leads the global movement for smart cities in the commercial residential sector. Since launch in 2015, STRATIS has installed in 200,000 units across more than 40 states. STRATIS is headquartered in Philadelphia, PA.
To get more information visit: STRATISIoT.com.
Follow us at @STRATISIoT and like our page at FB.com/STRATISIoT
Case study: Building a Holistic View of Data - Big Data Expo 2019webwinkelvakdag
Many organisations will be grappling with large, distributed and high-load data systems. Over time they have become complex, hard to maintain, and don’t provide a consolidated view of data available to the organisation. These were the challenges faced by Liberty Global who, together with EPAM, have tackled these issues by creating an Operational Data Hub - a centralized operational data framework to replace multiple monitoring solutions.
The Rise of Enterprise Data Stories in Data Visualization by Erik Laurijssen ...Patrick Van Renterghem
Presentation by Erik Laurijssen (CEO, Datylon): "The Rise of Data Stories in the Enterprise for Data Visualization" at the BI & Data Analytics Summit on June 13th in Diegem (Belgium)
Grid Analytics Europe 2016: "Open for Business", April 2016OMNETRIC
Presentation by Franz Winterauer at Grid Analytics Europe 2016 for the Analytics Technology Innovation Panel – learning from the application of advanced and open-source analytics technologies and tools in the large-scale implementation of utility grid analytics programmes.
Altis Webinar: Use Cases For The Modern Data PlatformAltis Consulting
Several organisations have mentioned issues that they have found from choosing the wrong use cases to start their journey with a modern data platform.
In this session, NZ Regional Manager Alex Gray will cover some of those issues faced by organisations & how to pick the right use cases to get you started successfully on your journey.
The search for new business ideas and new business models is hit-or-miss in most corporations
When good ideas do emerge, they’re often doomed because the company is organized to support one way of doing business and doesn’t have the processes or metrics to support a new one.
All business sizes can benefit from better use of their data to gain insights, how the cloud can help overcome common data challenges and accelerate transformation with the cloud technology
https://www.rapyder.com/cloud-data-analytics-services/
Project Deliverable 4 Analytics, Interfaces, and Cloud Technolo.docxwkyra78
Project Deliverable 4: Analytics, Interfaces, and Cloud Technology
By: Justin M. Blazejewski
CIS 499
Professor Dr. Janet Durgin
25 November 2012
Main screen
Overview | Export data | Tools | Realtime | Logout
Current month
Last
Month
Trends
c
Top selling products
Low selling products
Overview
Realtime information
Overview | Export data | Tools | Realtime | Logout
Unique ID
Activity
Result
Overview | Export data | Tools | Realtime | Logout
Reporting tools
Statistical tools
Trends
Sales 1st Qtr 2nd Qtr 3rd Qtr 4th Qtr 8.1999999999999993 3.2 1.4 1.2 Sales 1st Qtr 2nd Qtr 3rd Qtr 4th Qtr 8.1999999999999993 3.2 1.4 1.2 Series 1 Category 1 Category 2 Category 3 Category 4 4.3 2.5 3.5 4.5 Series 2 Category 1 Category 2 Category 3 Category 4 2.4 4.4000000000000004 1.8 2.8 Series 3 Category 1 Category 2 Category 3 Category 4 2 2 3 5 Series 1 Category 1 Category 2 Category 3 Category 4 4.3 2.5 3.5 4.5 Series 2 Category 1 Category 2 Category 3 Category 4 2.4 4.4000000000000004 1.8 2.8 Series 3 Category 1 Category 2 Category 3 Category 4 2 2 3 5
Project Deliverable 4: Analytics, Interfaces, and Cloud Technology
By: Justin M. Blazejewski
CIS 499
Professor Dr. Janet Durgin
25 November 2012
Introduction
Business Analytics means the practice of iterative and methodological examination of a business’s data with a special emphasis on statistic making. Business Analytics can further help businesses automate and optimize their business processes. Companies in which data plays a pivotal role, treats its data as a corporate assets and leverages it for gaining competitive advantage. A successful business analytics would typically depend on data quality, highly skillful and experienced professionals who understand the technologies, knows how to work with it and also understands the organizations processes in depth. Apart from this, the organization should have a capable infrastructure to support the operations of business analytics.
Usage of Business Analysis is done for the following purposes:
· Exploration of data so as to find patterns and trends
· Identifying relationships in key data variables for forecasting. For instance next probable purchase by the customer
· Drilling down to the results to find out why a particular incident took place. This approach is done by performing statistical analysis and quantitative analysis with business analytical tools
· Predicting future results by employing predictive modeling and predictive analytics
· Testing previous decisions using A/B and Multivariate testing
· Assisting business in decision making such as figuring out the amount of discount to be given for a new customer
Post identifying of business goal, an analysis methodology needs to be selected and the data is acquired to support the analysis. This data acquisition normally involves extracting data from systems that may be spread throughout different locations an ...
Foundational Strategies for Trust in Big Data Part 1: Getting Data to the Pla...Precisely
Teams working on new business initiatives, whether for enhancing customer engagement, creating new value, or addressing compliance considerations, know that a successful strategy starts with the synchronization of operational and reporting data from across the organization into a centralized repository for use in advanced analytics and other projects. However, the range and complexity of data sources as well as the lack of specialized skills needed to extract data from critical legacy systems often causes inefficiencies and gaps in the data being used by the business.
The first part of our webcast series on Foundation Strategies for Trust in Big Data provides insight into how Syncsort Connect with its design once, deploy anywhere approach supports a repeatable pattern for data integration by enabling enterprise architects and developers to ensure data from ALL enterprise data sources– from mainframe to cloud – is available in the downstream data lakes for use in these key business initiatives.
Noble-D, a cloud focused analytics consulting firmnoble-d
Noble-D is a cloud focused analytics consulting firm that offers strategy, architecture, design, engineer, support and talent acquisition services to their clients. Formed by senior analytics executives from the industry, Noble-D is a firm driven by a mission that every company, regardless of their size must have access to cloud enabled computing resources to compete fairly in global marketplace.
Big Data Everywhere Chicago: Platfora - Practices for Customer Analytics on H...BigDataEverywhere
Hadoop use cases have historically trended towards cost reduction through data warehouse offload. More recently, an uptick around customer-centric use cases have proven the ability for Hadoop to drive top-line revenue. In this session, Platfora solution architect Rob Rosen will discuss how the ability to coreelate multi-structured data in Hadoop leads to greater customer adoption, expanded cross-selling and reduced customer churn for enterprises deploying Hadoop-centric data lakes.
Data Strategy - Executive MBA Class, IE Business SchoolGam Dias
For today's enterprise Data is now very much a corporate asset, vital to delivering products and services efficiently and cost effectively. There are few organizations that can survive without harnessing data in some way.
Viewed as a strategic asset, data can be a source of new internal efficiencies, improved competitive advantage or a source of entirely new products that can be targeted at your existing or new customers.
This slide deck contains the highlights of a one day course on Data Strategy taught as part of the Executive MBA Program at IE Business School in Madrid.
The Path to Data and Analytics ModernizationAnalytics8
Learn about the business demands driving modernization, the benefits of doing so, and how to get started.
Can your data and analytics solutions handle today’s challenges?
To stay competitive in today’s market, companies must be able to use their data to make better decisions. However, we are living in a world flooded by data, new technologies, and demands from the business for better and more advanced analytics. Most companies do not have the modern technologies and processes in place to keep up with these growing demands. They need to modernize how they collect, analyze, use, and share their data.
In this webinar, we discuss how you can build modern data and analytics solutions that are future ready, scalable, real-time, high speed, and agile and that can enable better use of data throughout your company.
We cover:
-The business demands and industry shifts that are impacting the need to modernize
-The benefits of data and analytics modernization
-How to approach data and analytics modernization- steps you need to take and how to get it right
-The pillars of modern data management
-Tips for migrating from legacy analytics tools to modern, next-gen platforms
-Lessons learned from companies that have gone through the modernization process
Big Data, Big Thinking: Untapped OpportunitiesSAP Technology
In this webinar factsheet, SAP’s Rohit Nagarajan and Suni Verma from Ernst & Young explore Big Data in India, adoption patterns across the globe, and how you can embark on your own Big Data journey.
The content of the document, "Implementing Data Mesh: Six Ways That Can Improve the Odds of Your Success," is a whitepaper authored by Ranganath Ramakrishna from LTIMindtree. The whitepaper introduces the concept of Data Mesh, a socio-technical paradigm that aims to help organizations fully leverage the value of their analytical data.
End-User Computing Insights: A study of digital maturityDImension Data
Dimension Data has gained valuable insights through working with top global clients in the domain of end-user computing over the past five years.
Our report delivers these insights to your business – so you can benchmark your journey and take the next steps in end-user computing with confidence.
Nearly 8 out of 10 organisations say that
collaboration has resulted in improving the
work experience for remote workers.
A move to the cloud promises has many benefits – but what if you’re not able to move all your unified communications to the cloud? Find out how Cisco Spark Hybrid by Dimension Data
can reinvent collaboration for your business.
In this infographic, telling better stories with data and the Tour de France 2016. Here's what you can look forward to. About the race; New ways of capturing race data; New insights into race tactics and more data; New ways of analysing race data; and more....
Creating workspaces for tomorrow at the greatest cycling event in the worldDImension Data
The Tour de France is a fast-paced and dynamic environment to work in. See how Dimension Data used next-generation communication, collaboration, and mobility technology to allow technical teams to work together seamlessly around the clock, across time zones, and from various locations along the route.
High-performance solutions for an international universityDImension Data
An international, research-oriented university in Europe was moving to a single high-tech site and needed an accessible, secure and high-performance network to attract top class lecturers, researchers, engineers and collaborators.
This is how we delivered for them.
What's inhibiting your business productivityDImension Data
How do you transition from a traditional environment to a next generation productivity platform? Make your people more productive with an end-user computing solution that suits your business, work culture, systems … and budget!
Click here for more on increasing your productivity: http://bit.ly/1Xr4Whr
Technology is transforming the way we live, work and and interact. It's time to prepare for the digital enterprise. Dimension Data's Communications BU is enabling collaborative workspaces and embracing digital transformation.
How information saves lives in a paperless hospital. Dimension Data helped AME Africa to transform Inkosi Albert Luthuli Hospital from a digital hospital to a fully virtualised, paperless environment. At each step in the treatment process, all patient records are electronically updated and immediately accessible to all clinicians treating the patient.
An analysis of security trends in the Financial Services industry. 56% of attacks originate from IP addresses within the US but attackers could be anywhere in the world.
How we helped Fujifilm keep its customers' special memories safeDImension Data
In a world of cell phones and social media, Fujifilm wanted to give its customers instant and easy access to their photographic memories and special moments, from anywhere and any device, with the least amount of risk. Learn more here: http://blog.dimensiondata.com/2015/06/how-we-helped-fujifilm-keep-its-customers-special-memories-safe/
World’s first Cloud-enabled G20 Leaders’ SummitDImension Data
Dimension Data delivers World’s first Cloud-enabled G20 Leaders’ Summit.
The video can be viewed at
https://www.youtube.com/watch?v=dhDq4zGikMU&feature=youtu.be
2015 Global Threat Intelligence Report - an analysis of global security trendsDImension Data
The 2015 Global Threat Intelligence Report is an annual report which gives an overview of the biggest threats, and most prominent trends in the cyber security landscape.
Dimension Data Department Prime Minister and cabinet G20 case studyDImension Data
World’s first Cloud-enabled G20 Leaders’ Summit
Dimension Data was awarded the contract to deliver and support the G20 network and desktop environment, known as G-Net. The overarching goal was for technology to be an enabler to the event: flawless connectivity and virtual desktop experience for media and delegates was fundamental to the event’s success. View the video
Collaboration between the IT security industry and government holds the key to transforming threat information into actionable ‘threat intelligence’.
In the wake of recent statements by President Obama regarding the need for industry and government to collaborate more closely to combat cybersecurity threats, the key players in the industry are putting the sharing of cybersecurity data firmly on the agenda.
2015 Global Contact Centre Benchmarking Report key findingsDImension Data
Key findings from the 2015 Global Contact Centre Benchmarking Report. Based on data collected from 901 organisations from 72 countries, this report presents a comprehensive global overview of the state of multichannel interactions, and customer management in contact centres.
For further information, and to get your copy of the Report, visit: www.dimensiondata.com/ccbenchmarking
Dimension Data has been recognised as one of only 5 Top Global Top EmployersDImension Data
Dimension Data has been recognized as a Global Top Employer, demonstrating out commitment to creating the best possible work environment for our people.
Virtualisation to cloud - are we there yet?DImension Data
Your journey from virtualisation to the cloud can be a
long, winding road, or a superhighway. It all depends
on who you choose as a travelling companion.
Learn more here: http://www.dimensiondata.com/Global/Latest-Thinking/Are-We-There-Yet-Virtualisation-to-Cloud/Pages/home.aspx
Cure your monday morning networking headachesDImension Data
If you’re an ICT network technician, manager, or decision-maker, Mondays usually come with a heavier workload and intense pressure to sort out the problems that have crept up over the weekend.
Learn more here: http://www.dimensiondata.com/Global/Latest-Thinking/Monday-morning-networking-headaches/Pages/Home.aspx
Dimension Data – doing business with the biggestDImension Data
299 Dimension Data clients rank in the Fortune Global list.
The Fortune Global 500 for 2014 ranks the top 500 corporations worldwide, based on 2013 revenues.
Our clients continue to dominate on this influential list, compiled and published by Fortune magazine.
Connector Corner: Automate dynamic content and events by pushing a buttonDianaGray10
Here is something new! In our next Connector Corner webinar, we will demonstrate how you can use a single workflow to:
Create a campaign using Mailchimp with merge tags/fields
Send an interactive Slack channel message (using buttons)
Have the message received by managers and peers along with a test email for review
But there’s more:
In a second workflow supporting the same use case, you’ll see:
Your campaign sent to target colleagues for approval
If the “Approve” button is clicked, a Jira/Zendesk ticket is created for the marketing design team
But—if the “Reject” button is pushed, colleagues will be alerted via Slack message
Join us to learn more about this new, human-in-the-loop capability, brought to you by Integration Service connectors.
And...
Speakers:
Akshay Agnihotri, Product Manager
Charlie Greenberg, Host
DevOps and Testing slides at DASA ConnectKari Kakkonen
My and Rik Marselis slides at 30.5.2024 DASA Connect conference. We discuss about what is testing, then what is agile testing and finally what is Testing in DevOps. Finally we had lovely workshop with the participants trying to find out different ways to think about quality and testing in different parts of the DevOps infinity loop.
JMeter webinar - integration with InfluxDB and GrafanaRTTS
Watch this recorded webinar about real-time monitoring of application performance. See how to integrate Apache JMeter, the open-source leader in performance testing, with InfluxDB, the open-source time-series database, and Grafana, the open-source analytics and visualization application.
In this webinar, we will review the benefits of leveraging InfluxDB and Grafana when executing load tests and demonstrate how these tools are used to visualize performance metrics.
Length: 30 minutes
Session Overview
-------------------------------------------
During this webinar, we will cover the following topics while demonstrating the integrations of JMeter, InfluxDB and Grafana:
- What out-of-the-box solutions are available for real-time monitoring JMeter tests?
- What are the benefits of integrating InfluxDB and Grafana into the load testing stack?
- Which features are provided by Grafana?
- Demonstration of InfluxDB and Grafana using a practice web application
To view the webinar recording, go to:
https://www.rttsweb.com/jmeter-integration-webinar
Essentials of Automations: Optimizing FME Workflows with ParametersSafe Software
Are you looking to streamline your workflows and boost your projects’ efficiency? Do you find yourself searching for ways to add flexibility and control over your FME workflows? If so, you’re in the right place.
Join us for an insightful dive into the world of FME parameters, a critical element in optimizing workflow efficiency. This webinar marks the beginning of our three-part “Essentials of Automation” series. This first webinar is designed to equip you with the knowledge and skills to utilize parameters effectively: enhancing the flexibility, maintainability, and user control of your FME projects.
Here’s what you’ll gain:
- Essentials of FME Parameters: Understand the pivotal role of parameters, including Reader/Writer, Transformer, User, and FME Flow categories. Discover how they are the key to unlocking automation and optimization within your workflows.
- Practical Applications in FME Form: Delve into key user parameter types including choice, connections, and file URLs. Allow users to control how a workflow runs, making your workflows more reusable. Learn to import values and deliver the best user experience for your workflows while enhancing accuracy.
- Optimization Strategies in FME Flow: Explore the creation and strategic deployment of parameters in FME Flow, including the use of deployment and geometry parameters, to maximize workflow efficiency.
- Pro Tips for Success: Gain insights on parameterizing connections and leveraging new features like Conditional Visibility for clarity and simplicity.
We’ll wrap up with a glimpse into future webinars, followed by a Q&A session to address your specific questions surrounding this topic.
Don’t miss this opportunity to elevate your FME expertise and drive your projects to new heights of efficiency.
Let's dive deeper into the world of ODC! Ricardo Alves (OutSystems) will join us to tell all about the new Data Fabric. After that, Sezen de Bruijn (OutSystems) will get into the details on how to best design a sturdy architecture within ODC.
LF Energy Webinar: Electrical Grid Modelling and Simulation Through PowSyBl -...DanBrown980551
Do you want to learn how to model and simulate an electrical network from scratch in under an hour?
Then welcome to this PowSyBl workshop, hosted by Rte, the French Transmission System Operator (TSO)!
During the webinar, you will discover the PowSyBl ecosystem as well as handle and study an electrical network through an interactive Python notebook.
PowSyBl is an open source project hosted by LF Energy, which offers a comprehensive set of features for electrical grid modelling and simulation. Among other advanced features, PowSyBl provides:
- A fully editable and extendable library for grid component modelling;
- Visualization tools to display your network;
- Grid simulation tools, such as power flows, security analyses (with or without remedial actions) and sensitivity analyses;
The framework is mostly written in Java, with a Python binding so that Python developers can access PowSyBl functionalities as well.
What you will learn during the webinar:
- For beginners: discover PowSyBl's functionalities through a quick general presentation and the notebook, without needing any expert coding skills;
- For advanced developers: master the skills to efficiently apply PowSyBl functionalities to your real-world scenarios.
Neuro-symbolic is not enough, we need neuro-*semantic*Frank van Harmelen
Neuro-symbolic (NeSy) AI is on the rise. However, simply machine learning on just any symbolic structure is not sufficient to really harvest the gains of NeSy. These will only be gained when the symbolic structures have an actual semantics. I give an operational definition of semantics as “predictable inference”.
All of this illustrated with link prediction over knowledge graphs, but the argument is general.
State of ICS and IoT Cyber Threat Landscape Report 2024 previewPrayukth K V
The IoT and OT threat landscape report has been prepared by the Threat Research Team at Sectrio using data from Sectrio, cyber threat intelligence farming facilities spread across over 85 cities around the world. In addition, Sectrio also runs AI-based advanced threat and payload engagement facilities that serve as sinks to attract and engage sophisticated threat actors, and newer malware including new variants and latent threats that are at an earlier stage of development.
The latest edition of the OT/ICS and IoT security Threat Landscape Report 2024 also covers:
State of global ICS asset and network exposure
Sectoral targets and attacks as well as the cost of ransom
Global APT activity, AI usage, actor and tactic profiles, and implications
Rise in volumes of AI-powered cyberattacks
Major cyber events in 2024
Malware and malicious payload trends
Cyberattack types and targets
Vulnerability exploit attempts on CVEs
Attacks on counties – USA
Expansion of bot farms – how, where, and why
In-depth analysis of the cyber threat landscape across North America, South America, Europe, APAC, and the Middle East
Why are attacks on smart factories rising?
Cyber risk predictions
Axis of attacks – Europe
Systemic attacks in the Middle East
Download the full report from here:
https://sectrio.com/resources/ot-threat-landscape-reports/sectrio-releases-ot-ics-and-iot-security-threat-landscape-report-2024/
GraphRAG is All You need? LLM & Knowledge GraphGuy Korland
Guy Korland, CEO and Co-founder of FalkorDB, will review two articles on the integration of language models with knowledge graphs.
1. Unifying Large Language Models and Knowledge Graphs: A Roadmap.
https://arxiv.org/abs/2306.08302
2. Microsoft Research's GraphRAG paper and a review paper on various uses of knowledge graphs:
https://www.microsoft.com/en-us/research/blog/graphrag-unlocking-llm-discovery-on-narrative-private-data/
1. A smart data analytics story
starts with core digital infrastructure
– to make your business unstoppable
in the competitive race to digital
different values attached to data
at each stage of analytics
– with different business decisions
to be made at each stage.
6 stages of smart data
@NextGenDC dimensiondata.com/global/solutions/data-centres
Go to dimensiondata.com/tourdefrance/casestudy for more.
Dimension Data can help you define your
strategic business roadmap towards a
digital enterprise – and identify gaps in
your IT.
We can assist you in building and
managing the right digital infrastructure,
underscored by our global cloud
footprint, network, and expertise
in cybersecurity.
Digital
disrupts and informs a
new way of doing business
– insight from big data redefines
your business and
makes it more agile
How do you get smart about big data
in your business?
Do you know what data you’ll need
before you start the search?
• focus on information you need right now to drive transformation
• define the primary objective – improve performance, cut costs,
quality control, increase user experience
• start small for success to justify future investment, prove business value
Stage 1 :
Define the outcomes you’re
looking for up front
Stage 2 :
Decide how you’re going to
capture data
What information can you access?
Who would need this information?
How do you simplify the
framework to optimise
your delivery model?
• leverage the Internet of Things to gather data
• define what’s critical
• decide who needs access to what
• scope the lifecycle of data
• don’t overcomplicate matters:
match infrastructure investments
to business environment
• remove barriers between data silos
to centrally manage information
• keep and dispose of data according
to applicable governance rules
• start with smaller pilot projects for
more control
Stage 3 :
Adapt the solution to fit your
unique business model
Stage 4 :
Discover how to leverage agile data
to make faster business decisions
We built a fit-for-purpose solution in big data truck
to match a fast-paced, remote, and volatile environment
We delivered real-time analytics to
enhance viewing experience
Alpe d’Huez
big
data
truck
How can you make the data more
consumable and immediate?
• smaller sets of data to make
real-time decisions
• speculate on deeper analytics for
the future
• solution must provide immediate
business decision-making value
Stage 5 :
Evaluate data to identify patterns
and discover new insights
We delivered live-speed data on TV for the first
time and greater social media engagement
Can you leverage cloud to capture and
keep high-volume data until you’ve
decided its value to your business?
• cost-effective high-volume public cloud
• hybrid IT to keep sensitive data on-premise or private cloud
• scalability and flexibility of consumption model
You’ll find
Stage 6 :
Segment and prioritise data tiers
to share with relevant users
We delivered different sets of data to different broadcasters
With whom do you need
to share data?
• define data tiers in your infrastructure
• decide who receives summary data
or specific data
• data scientists can help make real-time
decisions and predict future patterns
Start with the finish line in sight …
We captured rider performance at every moment of the race
We put data analytics into action for Tour de France 2015
We tracked riders through a mesh network