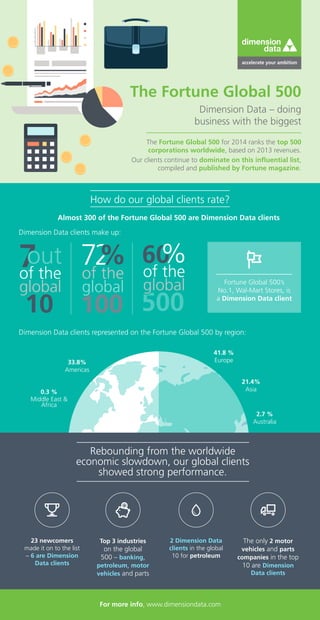
299 Dimension Data clients rank in the Fortune Global list.
The Fortune Global 500 for 2014 ranks the top 500 corporations worldwide, based on 2013 revenues.
Our clients continue to dominate on this influential list, compiled and published by Fortune magazine.
Automotive Industry In Mexico. Segment Analysis of Luxury Carsscmsnoida5
The internationalization strategy of the luxury
car companies in México is usually performed
through direct export, since it only involves the sale
of products made by firms in their home country to
customers in other countries. But the Audi brand
is the first to build a plant in Mexico, which has
an investment of over one billion dollars and will
generate 8,000 jobs, either directly or indirectly;
currently in the second stage, which is to build
the warehouses that have the assembly plant, the
first in the country to arm luxury SUVs.
Dimension Data Department Prime Minister and cabinet G20 case studyDImension Data
World’s first Cloud-enabled G20 Leaders’ Summit
Dimension Data was awarded the contract to deliver and support the G20 network and desktop environment, known as G-Net. The overarching goal was for technology to be an enabler to the event: flawless connectivity and virtual desktop experience for media and delegates was fundamental to the event’s success. View the video
Consumer Credit Market PPT: Demand, Trends and Business Opportunities 2022-27IMARC Group
Looking forward, the consumer credit market value is projected to reach a strong growth during the forecast period (2022-2027).
More info:- https://www.imarcgroup.com/consumer-credit-market
Consumer Credit Market PPT: Growth, Outlook, Demand, Keyplayer Analysis and O...IMARC Group
The global consumer credit market size reached US$ 11.0 Billion in 2022. Looking forward, IMARC Group expects the market to reach US$ 14.5 Billion by 2028, exhibiting a growth rate (CAGR) of 4.8% during 2023-2028.
More Info:- https://www.imarcgroup.com/consumer-credit-market
Up 7% BrandZ™ Top 100 Rises 7 percent With growth across categories Year of recovery, refinement and relevance There was a new tone. It fit the new normal. Both brands and consumers adjusted to constant uncertainty and sober expectations about economic growth.
They fit into the calculus of consumption the impact on the natural environment, personal health, and human well being along the supply chain. Shaped by these considerations, brand value appreciated. The value of the BrandZ™ Top 100 Most Valuable Global Brands rose 7 percent to $2.6 trillion last year, compared with a flat performance a year ago. All but two of the 13 categories analyzed in this report improved in brand value.
Technology and oil and gas declined modestly. These results indicate that strong brands continue to regain value lost during the recession and now, in some cases, surpass their pre-recession levels. The total brand value of the BrandZ™ Top 100 Strong Brands Portfolio has improved 77 percent since 2006. In addition, the BrandZ™ Top 100 Strong Brands Port-folio, comprised of diverse public companies, appreciated 58 percent during that eight-year period, compared with a market value gain of only 23 percent by the S&P 500. Despite a sharp decline in the growth of its brand value last year, Apple remained number one in the BrandZ™ Top 100 ranking, on the strength of the meaningful difference of its brand. Google moved to the number two position, marginally surpassing IBM, which continues to be the world’s most valuable B2B brand. These brands demonstrate both the capacity to grow brand strength quickly (Apple was founded in 1976, Google in 1998) and sustain it over time (IBM celebrated its centennial in 2011).
Three key themes emerge from the BrandZ™ Top 100 Most Valuable Global Brands 2013: Recovery The economy continued to improve— not everywhere, but in the US. All categories experienced healthy sales. Refinement With confidence still fragile, brands resisted introducing break-through innovations and instead encouraged consumer spending with incremental product and service improvements.
Relevance Reaching these more reflective consumers required offering products and services that not only projected mass appeal, but also promised personal relevance for the individual. BrandZ™ Portfolio outperforms S&P 500 Over the past seven years, the S&P 500 increased 23 percent in market value. In contrast, the BrandZ™ Portfolio of the strongest brands appreciated 58 percent.
The global payroll outsourcing market size reached US$ 8.9 Billion in 2022. Looking forward, IMARC Group expects the market to reach US$ 12.1 Billion by 2028, exhibiting a growth rate (CAGR) of 5.24% during 2023-2028.
More Info:- https://www.imarcgroup.com/payroll-outsourcing-market
Supply Chain Metrics That Matter-A Focus on the Automotive Industry-8 OCT 2013Lora Cecere
The automotive industry is a low margin and concentrated industry with few players. It is a complex business.
Unlike other industries with low margins, the automotive industry has not yet developed supply chain resiliency to weather fluctuations in demand. Over the last decade plus—while other low margin industries have refined processes and technologies to improve profitability and manage cycles and complexity—the automotive industry remains stuck in backwards thinking and old paradigms. This is especially true of the North American automotive companies.
The global revenue management market generated revenue of US$ 14.2 billion in 2020 and is expected to reach US$ 22.0 billion by 2025 with a CAGR of 9.2% in the forecast period. The revenue management market report offers a comprehensive market analysis of the different segments and regions that lets readers make crucial business-related decisions with a wealth of information enclosed in this report. An increase in customer awareness, a rise in demand for system integration, a rising need for competitive pricing strategies, and also growth in the distribution of ancillaries through e-travel platforms help driving market growth. The research report offers both qualitative and quantitative information on the global revenue management market. In qualitative terms, the revenue management market report provides insights into numerous factors, such as market determinants, value chain analysis, emerging trends, growth opportunity analysis, porters five-force model analysis and macro-economic factors, segment analysis, regional analysis at a granular level. Similarly, in quantitative terms, the report provides historical and forecast market numbers of revenue management in various segments such as by component, deployment model, enterprise size, and industry at global, regional, and country-level. Also, the report provides a detailed analysis of the market vendors and their product offerings. The report also covers details of the competitive market environment and includes information on the capabilities and competencies of market vendors.
Home Internet & Communication Errand Service Market
Errand Service Market Report 2023 (Global Edition)
Companies: TaskRabbit (United States), Uber Technologies Inc (Postmates) (United States), Errand Plus and Personal Services (United Kingdom), Oak Business Consultant LLC (United States), Errand Up (United States), DoorDash, Inc. (United States), Naborforce (United States), Errands 24/7 (United States), Almost Anything Inc (United States), Errand360 (Nigeria)
Type: Corporate Errands, Employee Errands, Executive Errands
Application:
Individual, Business
Service: Pick up / Drop off Service, Grocery Shopping, Pet Sitting, Car Cleaning and Servicing, Emergency & Healthcare Services, Others
Booking Medium: App, Web-based, Telephonic
The global workforce analytics market generated revenue of US$ 606.5 million in 2020 and is expected to reach US$ 1,160.3 million by 2025 with a CAGR of 13.9% in the forecast period. The workforce analytics market report offers a comprehensive market analysis of the different segments and regions that lets readers make crucial business-related decisions with a wealth of information enclosed in this report.The research report offers both qualitative and quantitative information on the global workforce analytics market. In qualitative terms, the workforce analytics market report provides insights into numerous factors, such as market determinants, value chain analysis, emerging trends, growth opportunity analysis, porters five-force model analysis and macro-economic factors, segment analysis, regional analysis at a granular level. Similarly, in quantitative terms, the report provides historical and forecast market numbers of workforce analytics in various segments such as by component, deployment model, enterprise size and industry at global, regional, and country-level.In addition, the report provides a detailed analysis of the market vendors and their product offerings. The report also covers details of the competitive market environment and includes information on the capabilities and competencies of market vendors.
Financial Analytics Market PPT 2021-26 | Enhancing Huge Growth and Latest Tr...IMARC Group
According to the latest report by IMARC Group,finds that the global financial analytics market exhibited strong growth during 2015-2020.
Financial analytics helps in collecting, monitoring, visualizing, analyzing and predicting data for evaluating the financial performance of a department or company and making better decisions.
This edition of Media Digest covers a broad economic outlook and highlights from the Bellwether Review, OCS6 - Posterscope’s 6th edition of its Out-of-Home Consumer survey - that launched in February, recent mobile insights, consumer and digital trends for 2014, as well as the latest insights from our trading partners.
End-User Computing Insights: A study of digital maturityDImension Data
Dimension Data has gained valuable insights through working with top global clients in the domain of end-user computing over the past five years.
Our report delivers these insights to your business – so you can benchmark your journey and take the next steps in end-user computing with confidence.
Nearly 8 out of 10 organisations say that
collaboration has resulted in improving the
work experience for remote workers.
A move to the cloud promises has many benefits – but what if you’re not able to move all your unified communications to the cloud? Find out how Cisco Spark Hybrid by Dimension Data
can reinvent collaboration for your business.
More Related Content
Similar to Dimension Data – doing business with the biggest
Consumer Credit Market PPT: Demand, Trends and Business Opportunities 2022-27IMARC Group
Looking forward, the consumer credit market value is projected to reach a strong growth during the forecast period (2022-2027).
More info:- https://www.imarcgroup.com/consumer-credit-market
Consumer Credit Market PPT: Growth, Outlook, Demand, Keyplayer Analysis and O...IMARC Group
The global consumer credit market size reached US$ 11.0 Billion in 2022. Looking forward, IMARC Group expects the market to reach US$ 14.5 Billion by 2028, exhibiting a growth rate (CAGR) of 4.8% during 2023-2028.
More Info:- https://www.imarcgroup.com/consumer-credit-market
Up 7% BrandZ™ Top 100 Rises 7 percent With growth across categories Year of recovery, refinement and relevance There was a new tone. It fit the new normal. Both brands and consumers adjusted to constant uncertainty and sober expectations about economic growth.
They fit into the calculus of consumption the impact on the natural environment, personal health, and human well being along the supply chain. Shaped by these considerations, brand value appreciated. The value of the BrandZ™ Top 100 Most Valuable Global Brands rose 7 percent to $2.6 trillion last year, compared with a flat performance a year ago. All but two of the 13 categories analyzed in this report improved in brand value.
Technology and oil and gas declined modestly. These results indicate that strong brands continue to regain value lost during the recession and now, in some cases, surpass their pre-recession levels. The total brand value of the BrandZ™ Top 100 Strong Brands Portfolio has improved 77 percent since 2006. In addition, the BrandZ™ Top 100 Strong Brands Port-folio, comprised of diverse public companies, appreciated 58 percent during that eight-year period, compared with a market value gain of only 23 percent by the S&P 500. Despite a sharp decline in the growth of its brand value last year, Apple remained number one in the BrandZ™ Top 100 ranking, on the strength of the meaningful difference of its brand. Google moved to the number two position, marginally surpassing IBM, which continues to be the world’s most valuable B2B brand. These brands demonstrate both the capacity to grow brand strength quickly (Apple was founded in 1976, Google in 1998) and sustain it over time (IBM celebrated its centennial in 2011).
Three key themes emerge from the BrandZ™ Top 100 Most Valuable Global Brands 2013: Recovery The economy continued to improve— not everywhere, but in the US. All categories experienced healthy sales. Refinement With confidence still fragile, brands resisted introducing break-through innovations and instead encouraged consumer spending with incremental product and service improvements.
Relevance Reaching these more reflective consumers required offering products and services that not only projected mass appeal, but also promised personal relevance for the individual. BrandZ™ Portfolio outperforms S&P 500 Over the past seven years, the S&P 500 increased 23 percent in market value. In contrast, the BrandZ™ Portfolio of the strongest brands appreciated 58 percent.
The global payroll outsourcing market size reached US$ 8.9 Billion in 2022. Looking forward, IMARC Group expects the market to reach US$ 12.1 Billion by 2028, exhibiting a growth rate (CAGR) of 5.24% during 2023-2028.
More Info:- https://www.imarcgroup.com/payroll-outsourcing-market
Supply Chain Metrics That Matter-A Focus on the Automotive Industry-8 OCT 2013Lora Cecere
The automotive industry is a low margin and concentrated industry with few players. It is a complex business.
Unlike other industries with low margins, the automotive industry has not yet developed supply chain resiliency to weather fluctuations in demand. Over the last decade plus—while other low margin industries have refined processes and technologies to improve profitability and manage cycles and complexity—the automotive industry remains stuck in backwards thinking and old paradigms. This is especially true of the North American automotive companies.
The global revenue management market generated revenue of US$ 14.2 billion in 2020 and is expected to reach US$ 22.0 billion by 2025 with a CAGR of 9.2% in the forecast period. The revenue management market report offers a comprehensive market analysis of the different segments and regions that lets readers make crucial business-related decisions with a wealth of information enclosed in this report. An increase in customer awareness, a rise in demand for system integration, a rising need for competitive pricing strategies, and also growth in the distribution of ancillaries through e-travel platforms help driving market growth. The research report offers both qualitative and quantitative information on the global revenue management market. In qualitative terms, the revenue management market report provides insights into numerous factors, such as market determinants, value chain analysis, emerging trends, growth opportunity analysis, porters five-force model analysis and macro-economic factors, segment analysis, regional analysis at a granular level. Similarly, in quantitative terms, the report provides historical and forecast market numbers of revenue management in various segments such as by component, deployment model, enterprise size, and industry at global, regional, and country-level. Also, the report provides a detailed analysis of the market vendors and their product offerings. The report also covers details of the competitive market environment and includes information on the capabilities and competencies of market vendors.
Home Internet & Communication Errand Service Market
Errand Service Market Report 2023 (Global Edition)
Companies: TaskRabbit (United States), Uber Technologies Inc (Postmates) (United States), Errand Plus and Personal Services (United Kingdom), Oak Business Consultant LLC (United States), Errand Up (United States), DoorDash, Inc. (United States), Naborforce (United States), Errands 24/7 (United States), Almost Anything Inc (United States), Errand360 (Nigeria)
Type: Corporate Errands, Employee Errands, Executive Errands
Application:
Individual, Business
Service: Pick up / Drop off Service, Grocery Shopping, Pet Sitting, Car Cleaning and Servicing, Emergency & Healthcare Services, Others
Booking Medium: App, Web-based, Telephonic
The global workforce analytics market generated revenue of US$ 606.5 million in 2020 and is expected to reach US$ 1,160.3 million by 2025 with a CAGR of 13.9% in the forecast period. The workforce analytics market report offers a comprehensive market analysis of the different segments and regions that lets readers make crucial business-related decisions with a wealth of information enclosed in this report.The research report offers both qualitative and quantitative information on the global workforce analytics market. In qualitative terms, the workforce analytics market report provides insights into numerous factors, such as market determinants, value chain analysis, emerging trends, growth opportunity analysis, porters five-force model analysis and macro-economic factors, segment analysis, regional analysis at a granular level. Similarly, in quantitative terms, the report provides historical and forecast market numbers of workforce analytics in various segments such as by component, deployment model, enterprise size and industry at global, regional, and country-level.In addition, the report provides a detailed analysis of the market vendors and their product offerings. The report also covers details of the competitive market environment and includes information on the capabilities and competencies of market vendors.
Financial Analytics Market PPT 2021-26 | Enhancing Huge Growth and Latest Tr...IMARC Group
According to the latest report by IMARC Group,finds that the global financial analytics market exhibited strong growth during 2015-2020.
Financial analytics helps in collecting, monitoring, visualizing, analyzing and predicting data for evaluating the financial performance of a department or company and making better decisions.
This edition of Media Digest covers a broad economic outlook and highlights from the Bellwether Review, OCS6 - Posterscope’s 6th edition of its Out-of-Home Consumer survey - that launched in February, recent mobile insights, consumer and digital trends for 2014, as well as the latest insights from our trading partners.
Similar to Dimension Data – doing business with the biggest (20)
End-User Computing Insights: A study of digital maturityDImension Data
Dimension Data has gained valuable insights through working with top global clients in the domain of end-user computing over the past five years.
Our report delivers these insights to your business – so you can benchmark your journey and take the next steps in end-user computing with confidence.
Nearly 8 out of 10 organisations say that
collaboration has resulted in improving the
work experience for remote workers.
A move to the cloud promises has many benefits – but what if you’re not able to move all your unified communications to the cloud? Find out how Cisco Spark Hybrid by Dimension Data
can reinvent collaboration for your business.
In this infographic, telling better stories with data and the Tour de France 2016. Here's what you can look forward to. About the race; New ways of capturing race data; New insights into race tactics and more data; New ways of analysing race data; and more....
Digital technology revolutionised the viewing experience of the tour de franceDImension Data
How did A.S.O and Dimension Data find new ways of engaging billions of Tour de France fans around the world? We focused our digital and transformational technology on four areas: digital infrastructure, cloud, cyber security and workspaces for tomorrow. This is how we did it.
Creating workspaces for tomorrow at the greatest cycling event in the worldDImension Data
The Tour de France is a fast-paced and dynamic environment to work in. See how Dimension Data used next-generation communication, collaboration, and mobility technology to allow technical teams to work together seamlessly around the clock, across time zones, and from various locations along the route.
Cloud is critical to competing in the digital economy. Today, your customers search for, discover, interact with, and buy products and services differently. Is your business ready to adapt? Cloud puts you on the path to digital innovation… and extending and deepening your customer relationships.
Here's a breakdown of how Cloud gives you speed-to-market, agility, security, availability and resilience.
6 stages of smart data at the Tour de FranceDImension Data
How do you get smart about big data in your business? This is how we put data analytics into action at the Tour de France 2015. Follow these 6 simple steps to achieve smarter data.
Zurich case study how to move a data centre in 8 daysDImension Data
Dimension Data helped Zurich improve its ability to look after its financial services customers around the world, using technology to do it. Check out this infographic to see how this was acheived
Strengthening Cybersecurity at the tour de franceDImension Data
Here's a look at how we successfully thwarted all attempts to breach our perimeter, and intruder activity during the Tour de France.
Between March and July 2015, we saw a 56% increase in reconnaissance scans targeting Dimension Data's website - none were successful.
High-performance solutions for an international universityDImension Data
An international, research-oriented university in Europe was moving to a single high-tech site and needed an accessible, secure and high-performance network to attract top class lecturers, researchers, engineers and collaborators.
This is how we delivered for them.
What's inhibiting your business productivityDImension Data
How do you transition from a traditional environment to a next generation productivity platform? Make your people more productive with an end-user computing solution that suits your business, work culture, systems … and budget!
Click here for more on increasing your productivity: http://bit.ly/1Xr4Whr
Technology is transforming the way we live, work and and interact. It's time to prepare for the digital enterprise. Dimension Data's Communications BU is enabling collaborative workspaces and embracing digital transformation.
How information saves lives in a paperless hospital. Dimension Data helped AME Africa to transform Inkosi Albert Luthuli Hospital from a digital hospital to a fully virtualised, paperless environment. At each step in the treatment process, all patient records are electronically updated and immediately accessible to all clinicians treating the patient.
An analysis of security trends in the Financial Services industry. 56% of attacks originate from IP addresses within the US but attackers could be anywhere in the world.
How we helped Fujifilm keep its customers' special memories safeDImension Data
In a world of cell phones and social media, Fujifilm wanted to give its customers instant and easy access to their photographic memories and special moments, from anywhere and any device, with the least amount of risk. Learn more here: http://blog.dimensiondata.com/2015/06/how-we-helped-fujifilm-keep-its-customers-special-memories-safe/
World’s first Cloud-enabled G20 Leaders’ SummitDImension Data
Dimension Data delivers World’s first Cloud-enabled G20 Leaders’ Summit.
The video can be viewed at
https://www.youtube.com/watch?v=dhDq4zGikMU&feature=youtu.be
2015 Global Threat Intelligence Report - an analysis of global security trendsDImension Data
The 2015 Global Threat Intelligence Report is an annual report which gives an overview of the biggest threats, and most prominent trends in the cyber security landscape.
Collaboration between the IT security industry and government holds the key to transforming threat information into actionable ‘threat intelligence’.
In the wake of recent statements by President Obama regarding the need for industry and government to collaborate more closely to combat cybersecurity threats, the key players in the industry are putting the sharing of cybersecurity data firmly on the agenda.
Accelerate your Kubernetes clusters with Varnish CachingThijs Feryn
A presentation about the usage and availability of Varnish on Kubernetes. This talk explores the capabilities of Varnish caching and shows how to use the Varnish Helm chart to deploy it to Kubernetes.
This presentation was delivered at K8SUG Singapore. See https://feryn.eu/presentations/accelerate-your-kubernetes-clusters-with-varnish-caching-k8sug-singapore-28-2024 for more details.
UiPath Test Automation using UiPath Test Suite series, part 4DianaGray10
Welcome to UiPath Test Automation using UiPath Test Suite series part 4. In this session, we will cover Test Manager overview along with SAP heatmap.
The UiPath Test Manager overview with SAP heatmap webinar offers a concise yet comprehensive exploration of the role of a Test Manager within SAP environments, coupled with the utilization of heatmaps for effective testing strategies.
Participants will gain insights into the responsibilities, challenges, and best practices associated with test management in SAP projects. Additionally, the webinar delves into the significance of heatmaps as a visual aid for identifying testing priorities, areas of risk, and resource allocation within SAP landscapes. Through this session, attendees can expect to enhance their understanding of test management principles while learning practical approaches to optimize testing processes in SAP environments using heatmap visualization techniques
What will you get from this session?
1. Insights into SAP testing best practices
2. Heatmap utilization for testing
3. Optimization of testing processes
4. Demo
Topics covered:
Execution from the test manager
Orchestrator execution result
Defect reporting
SAP heatmap example with demo
Speaker:
Deepak Rai, Automation Practice Lead, Boundaryless Group and UiPath MVP
Dev Dives: Train smarter, not harder – active learning and UiPath LLMs for do...UiPathCommunity
💥 Speed, accuracy, and scaling – discover the superpowers of GenAI in action with UiPath Document Understanding and Communications Mining™:
See how to accelerate model training and optimize model performance with active learning
Learn about the latest enhancements to out-of-the-box document processing – with little to no training required
Get an exclusive demo of the new family of UiPath LLMs – GenAI models specialized for processing different types of documents and messages
This is a hands-on session specifically designed for automation developers and AI enthusiasts seeking to enhance their knowledge in leveraging the latest intelligent document processing capabilities offered by UiPath.
Speakers:
👨🏫 Andras Palfi, Senior Product Manager, UiPath
👩🏫 Lenka Dulovicova, Product Program Manager, UiPath
Connector Corner: Automate dynamic content and events by pushing a buttonDianaGray10
Here is something new! In our next Connector Corner webinar, we will demonstrate how you can use a single workflow to:
Create a campaign using Mailchimp with merge tags/fields
Send an interactive Slack channel message (using buttons)
Have the message received by managers and peers along with a test email for review
But there’s more:
In a second workflow supporting the same use case, you’ll see:
Your campaign sent to target colleagues for approval
If the “Approve” button is clicked, a Jira/Zendesk ticket is created for the marketing design team
But—if the “Reject” button is pushed, colleagues will be alerted via Slack message
Join us to learn more about this new, human-in-the-loop capability, brought to you by Integration Service connectors.
And...
Speakers:
Akshay Agnihotri, Product Manager
Charlie Greenberg, Host
The Art of the Pitch: WordPress Relationships and SalesLaura Byrne
Clients don’t know what they don’t know. What web solutions are right for them? How does WordPress come into the picture? How do you make sure you understand scope and timeline? What do you do if sometime changes?
All these questions and more will be explored as we talk about matching clients’ needs with what your agency offers without pulling teeth or pulling your hair out. Practical tips, and strategies for successful relationship building that leads to closing the deal.
Smart TV Buyer Insights Survey 2024 by 91mobiles.pdf91mobiles
91mobiles recently conducted a Smart TV Buyer Insights Survey in which we asked over 3,000 respondents about the TV they own, aspects they look at on a new TV, and their TV buying preferences.
Key Trends Shaping the Future of Infrastructure.pdfCheryl Hung
Keynote at DIGIT West Expo, Glasgow on 29 May 2024.
Cheryl Hung, ochery.com
Sr Director, Infrastructure Ecosystem, Arm.
The key trends across hardware, cloud and open-source; exploring how these areas are likely to mature and develop over the short and long-term, and then considering how organisations can position themselves to adapt and thrive.
Essentials of Automations: Optimizing FME Workflows with ParametersSafe Software
Are you looking to streamline your workflows and boost your projects’ efficiency? Do you find yourself searching for ways to add flexibility and control over your FME workflows? If so, you’re in the right place.
Join us for an insightful dive into the world of FME parameters, a critical element in optimizing workflow efficiency. This webinar marks the beginning of our three-part “Essentials of Automation” series. This first webinar is designed to equip you with the knowledge and skills to utilize parameters effectively: enhancing the flexibility, maintainability, and user control of your FME projects.
Here’s what you’ll gain:
- Essentials of FME Parameters: Understand the pivotal role of parameters, including Reader/Writer, Transformer, User, and FME Flow categories. Discover how they are the key to unlocking automation and optimization within your workflows.
- Practical Applications in FME Form: Delve into key user parameter types including choice, connections, and file URLs. Allow users to control how a workflow runs, making your workflows more reusable. Learn to import values and deliver the best user experience for your workflows while enhancing accuracy.
- Optimization Strategies in FME Flow: Explore the creation and strategic deployment of parameters in FME Flow, including the use of deployment and geometry parameters, to maximize workflow efficiency.
- Pro Tips for Success: Gain insights on parameterizing connections and leveraging new features like Conditional Visibility for clarity and simplicity.
We’ll wrap up with a glimpse into future webinars, followed by a Q&A session to address your specific questions surrounding this topic.
Don’t miss this opportunity to elevate your FME expertise and drive your projects to new heights of efficiency.
Securing your Kubernetes cluster_ a step-by-step guide to success !KatiaHIMEUR1
Today, after several years of existence, an extremely active community and an ultra-dynamic ecosystem, Kubernetes has established itself as the de facto standard in container orchestration. Thanks to a wide range of managed services, it has never been so easy to set up a ready-to-use Kubernetes cluster.
However, this ease of use means that the subject of security in Kubernetes is often left for later, or even neglected. This exposes companies to significant risks.
In this talk, I'll show you step-by-step how to secure your Kubernetes cluster for greater peace of mind and reliability.
State of ICS and IoT Cyber Threat Landscape Report 2024 previewPrayukth K V
The IoT and OT threat landscape report has been prepared by the Threat Research Team at Sectrio using data from Sectrio, cyber threat intelligence farming facilities spread across over 85 cities around the world. In addition, Sectrio also runs AI-based advanced threat and payload engagement facilities that serve as sinks to attract and engage sophisticated threat actors, and newer malware including new variants and latent threats that are at an earlier stage of development.
The latest edition of the OT/ICS and IoT security Threat Landscape Report 2024 also covers:
State of global ICS asset and network exposure
Sectoral targets and attacks as well as the cost of ransom
Global APT activity, AI usage, actor and tactic profiles, and implications
Rise in volumes of AI-powered cyberattacks
Major cyber events in 2024
Malware and malicious payload trends
Cyberattack types and targets
Vulnerability exploit attempts on CVEs
Attacks on counties – USA
Expansion of bot farms – how, where, and why
In-depth analysis of the cyber threat landscape across North America, South America, Europe, APAC, and the Middle East
Why are attacks on smart factories rising?
Cyber risk predictions
Axis of attacks – Europe
Systemic attacks in the Middle East
Download the full report from here:
https://sectrio.com/resources/ot-threat-landscape-reports/sectrio-releases-ot-ics-and-iot-security-threat-landscape-report-2024/
Slack (or Teams) Automation for Bonterra Impact Management (fka Social Soluti...Jeffrey Haguewood
Sidekick Solutions uses Bonterra Impact Management (fka Social Solutions Apricot) and automation solutions to integrate data for business workflows.
We believe integration and automation are essential to user experience and the promise of efficient work through technology. Automation is the critical ingredient to realizing that full vision. We develop integration products and services for Bonterra Case Management software to support the deployment of automations for a variety of use cases.
This video focuses on the notifications, alerts, and approval requests using Slack for Bonterra Impact Management. The solutions covered in this webinar can also be deployed for Microsoft Teams.
Interested in deploying notification automations for Bonterra Impact Management? Contact us at sales@sidekicksolutionsllc.com to discuss next steps.
FIDO Alliance Osaka Seminar: The WebAuthn API and Discoverable Credentials.pdf
Dimension Data – doing business with the biggest
1. Dimension Data – doing business with the biggest
Once again, it ranks the top 500 corporations worldwide based on 2013 revenues.
Compiled by Fortune Magazine, one of the financial world’s most respected publications, a spot on this influential list remains a reliable benchmark for a company’s economic health and competitive edge in a global market.
The Fortune Global 500
How do our global clients rate?
Rebounding from the worldwide economic slowdown, our global clients showed strong performance.
The Fortune Global 500 for 2014 ranks the top 500 corporations worldwide, based on 2013 revenues.
Our clients continue to dominate on this influential list, compiled and published by Fortune magazine.
Almost 300 of the Fortune Global 500 are Dimension Data clients
23 newcomers made it on to the list – 6 are Dimension Data clients
Top 3 industries on the global 500 – banking, petroleum, motor vehicles and parts
The only 2 motor vehicles and parts companies in the top 10 are Dimension Data clients
Dimension Data clients make up:
Dimension Data clients represented on the Fortune Global 500 by region:
100
of the
72
global
500
of the
60
global
10
of the
7
global
out
0.3 %
Middle East & Africa
21.4%
Asia
41.8 %
Europe
33.8% Americas
2.7 %
Australia
2 Dimension Data clients in the global 10 for petroleum
For more info, www.dimensiondata.com
Fortune Global 500’s No.1, Wal-Mart Stores, is a Dimension Data client