Download to read offline
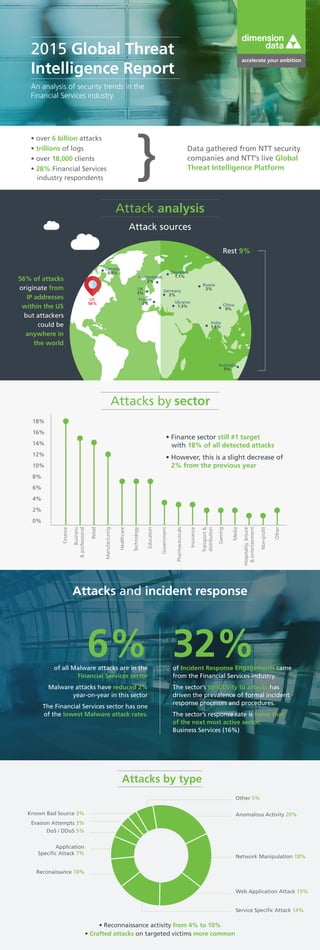
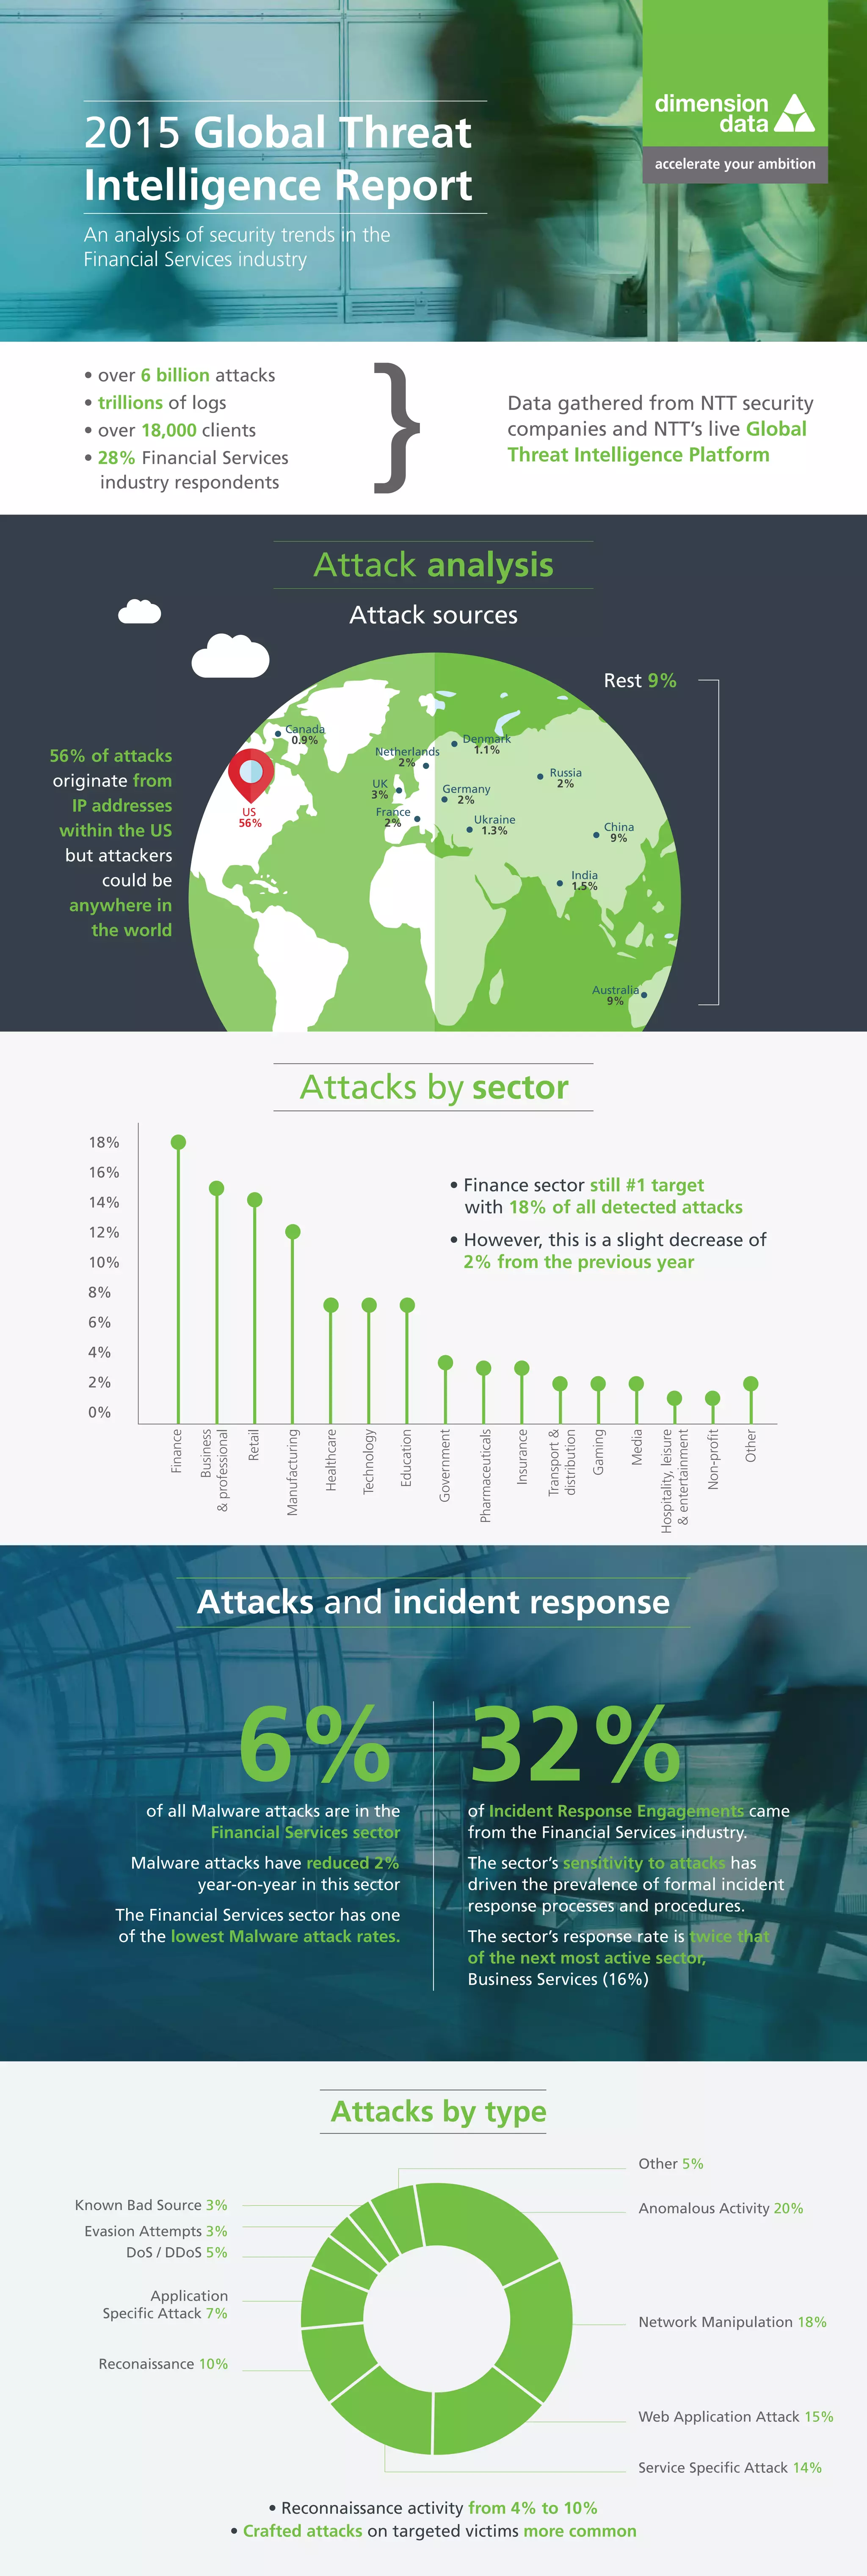

The 2015 Global Threat Intelligence Report highlights that the financial services industry is the most targeted sector, accounting for 18% of all detected attacks, with a decrease of 2% compared to the previous year. Over 6 billion attacks were noted, primarily originating from the US, and the financial services sector demonstrated a strong incident response capability despite 74% of organizations lacking a formal incident response plan. The report emphasizes a shift in attacks from applications to end-user systems, with the majority of vulnerabilities related to personal devices increasingly exploited by cybercriminals.


![Mobile Workspaces Go Where You Go [Infographic]](https://cdn.slidesharecdn.com/ss_thumbnails/mobileworkspacesgowhereyougo-141212171346-conversion-gate01-thumbnail.jpg?width=640&height=640&fit=bounds)
![7 Best Practices to Protect Critical Business Information [Infographic]](https://cdn.slidesharecdn.com/ss_thumbnails/cso-security-infographic-140224155745-phpapp01-thumbnail.jpg?width=640&height=640&fit=bounds)


