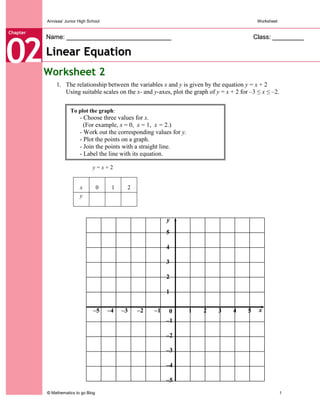
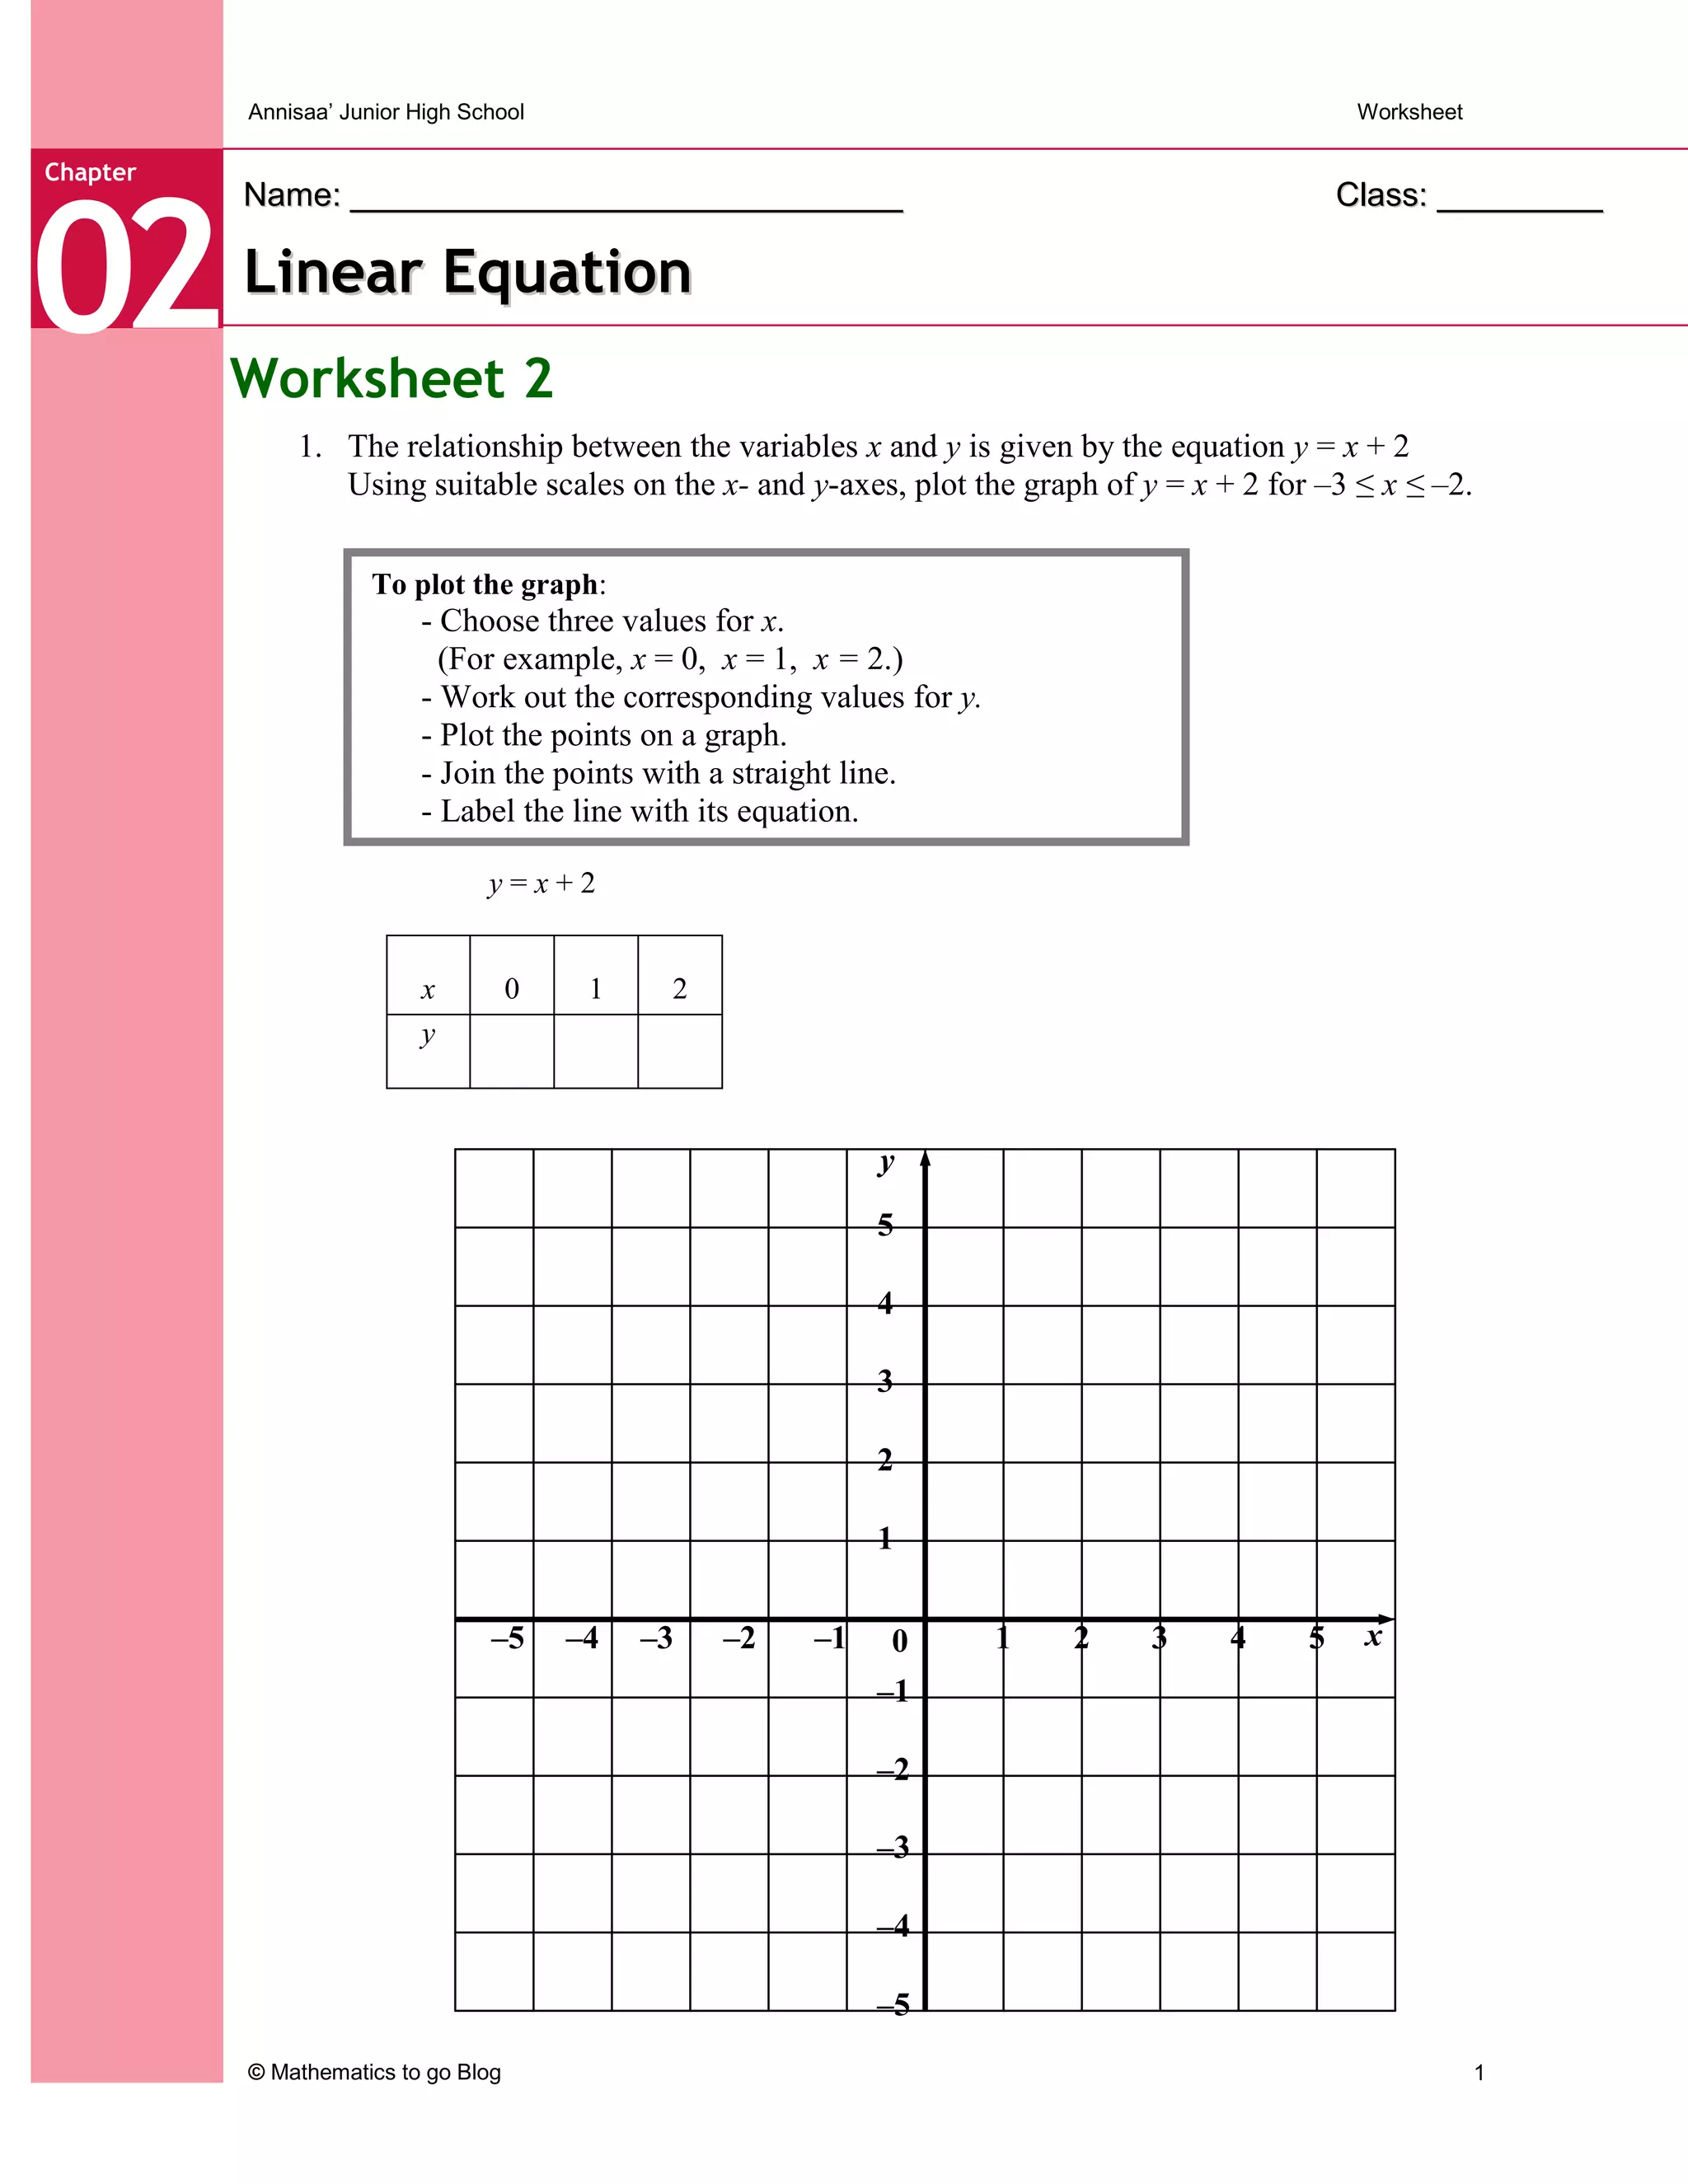
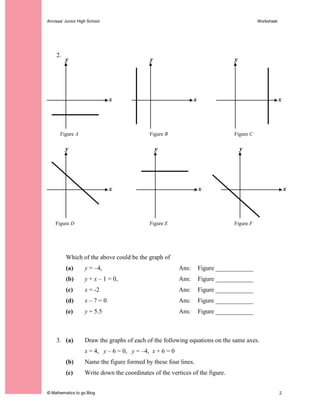
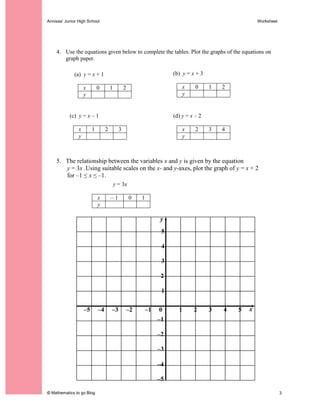
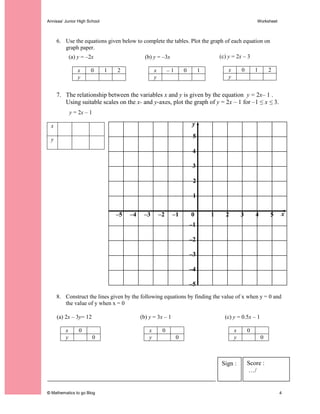
Linear EquationName: ______________________________Class: _________20Chapter<br />Worksheet 2<br />The relationship between the variables x and y is given by the equation y = x + 2 Using suitable scales on the x- and y-axes, plot the graph of y = x + 2 for –3 ≤ x ≤ –2.<br />To plot the graph:- Choose three values for x.  (For example, x = 0,  x = 1,  x = 2.)- Work out the corresponding values for y.- Plot the points on a graph.- Join the points with a straight line.- Label the line with its equation.<br />                y = x + 2x012y<br />y<br />5<br />4<br />3<br />2<br />1<br /> –2 –3      –4 –50–1 x43521<br />–1 <br />–2 <br />–3 <br />–4 <br />–5<br /> y x y xFigure BFigure CFigure A y x <br /> <br /> <br /> <br /> <br /> <br /> <br /> <br /> <br />Figure CFigure AFigure B <br /> <br /> y x y x y x<br /> <br /> <br /> <br /> <br /> <br /> <br /> <br /> <br /> <br /> <br />Figure DFigure FFigure E <br /> <br />Which of the above could be the graph of <br />y = –4,Ans:Figure ____________<br />y + x – 1 = 0, Ans:Figure ____________<br />x = -2Ans:Figure ____________<br /> (d)x – 7 = 0Ans:Figure ____________<br /> (e)y = 5.5 Ans:Figure ____________<br /> <br /> <br />(a)Draw the graphs of each of the following equations on the same axes.x = 4,   y – 6 = 0,   y = –4,  x + 6 = 0<br />(b)Name the figure formed by these four lines.<br />(c)Write down the coordinates of the vertices of the figure.<br />Use the equations given below to complete the tables. Plot the graphs of the equations on graph paper.  <br />(b)  y = x + 3x012y(a)  y = x + 1x012y<br />(d) y = x – 2x234y(c)  y = x – 1x123y<br />The relationship between the variables x and y is given by the equation   y = 3x .Using suitable scales on the x- and y-axes, plot the graph of y = x + 2 <br /> for –1 ≤ x ≤ –1.<br />                 y = 3xx– 101y<br />  y<br />   5<br />   4<br />   3<br /> 2<br />1<br />0–4 –3 –1 –2 –543521x<br />–1 <br />–2 <br />–3 <br />–4 <br />–5<br />Use the equations given below to complete the tables. Plot the graph of each equation on <br />      graph paper.  <br />(c) y = 2x – 3x012y(a) y = –2xx012y(b) y = –3xx– 101y<br />The relationship between the variables x and y is given by the equation  y = 2x– 1 .                       y = 2x – 1 xy      Using suitable scales on the x- and y-axes, plot the graph of y = 2x – 1 for –1 ≤ x ≤ 3.<br />  y–2 –1 –4 –3 –5 2–1 –2 –3 –4 –54035 52413 1x<br />Construct the lines given by the following equations by finding the value of x when y = 0 and the value of y when x = 0<br />(a) 2x – 3y= 12x0y0(b) y = 3x – 1x0y0(c) y = 0.5x – 1x0y0<br />Score : …/Sign :<br />
ws2 Linear Equation
ws2 Linear Equation
ws2 Linear Equation

ws2 Linear Equation

  • 1.
    Linear EquationName: ______________________________Class:_________20Chapter<br />Worksheet 2<br />The relationship between the variables x and y is given by the equation y = x + 2 Using suitable scales on the x- and y-axes, plot the graph of y = x + 2 for –3 ≤ x ≤ –2.<br />To plot the graph:- Choose three values for x. (For example, x = 0, x = 1, x = 2.)- Work out the corresponding values for y.- Plot the points on a graph.- Join the points with a straight line.- Label the line with its equation.<br /> y = x + 2x012y<br />y<br />5<br />4<br />3<br />2<br />1<br /> –2 –3 –4 –50–1 x43521<br />–1 <br />–2 <br />–3 <br />–4 <br />–5<br /> y x y xFigure BFigure CFigure A y x <br /> <br /> <br /> <br /> <br /> <br /> <br /> <br /> <br />Figure CFigure AFigure B <br /> <br /> y x y x y x<br /> <br /> <br /> <br /> <br /> <br /> <br /> <br /> <br /> <br /> <br />Figure DFigure FFigure E <br /> <br />Which of the above could be the graph of <br />y = –4,Ans:Figure ____________<br />y + x – 1 = 0, Ans:Figure ____________<br />x = -2Ans:Figure ____________<br /> (d)x – 7 = 0Ans:Figure ____________<br /> (e)y = 5.5 Ans:Figure ____________<br /> <br /> <br />(a)Draw the graphs of each of the following equations on the same axes.x = 4, y – 6 = 0, y = –4, x + 6 = 0<br />(b)Name the figure formed by these four lines.<br />(c)Write down the coordinates of the vertices of the figure.<br />Use the equations given below to complete the tables. Plot the graphs of the equations on graph paper. <br />(b) y = x + 3x012y(a) y = x + 1x012y<br />(d) y = x – 2x234y(c) y = x – 1x123y<br />The relationship between the variables x and y is given by the equation y = 3x .Using suitable scales on the x- and y-axes, plot the graph of y = x + 2 <br /> for –1 ≤ x ≤ –1.<br /> y = 3xx– 101y<br /> y<br /> 5<br /> 4<br /> 3<br /> 2<br />1<br />0–4 –3 –1 –2 –543521x<br />–1 <br />–2 <br />–3 <br />–4 <br />–5<br />Use the equations given below to complete the tables. Plot the graph of each equation on <br /> graph paper. <br />(c) y = 2x – 3x012y(a) y = –2xx012y(b) y = –3xx– 101y<br />The relationship between the variables x and y is given by the equation y = 2x– 1 . y = 2x – 1 xy Using suitable scales on the x- and y-axes, plot the graph of y = 2x – 1 for –1 ≤ x ≤ 3.<br /> y–2 –1 –4 –3 –5 2–1 –2 –3 –4 –54035 52413 1x<br />Construct the lines given by the following equations by finding the value of x when y = 0 and the value of y when x = 0<br />(a) 2x – 3y= 12x0y0(b) y = 3x – 1x0y0(c) y = 0.5x – 1x0y0<br />Score : …/Sign :<br />