Download as PDF, PPTX


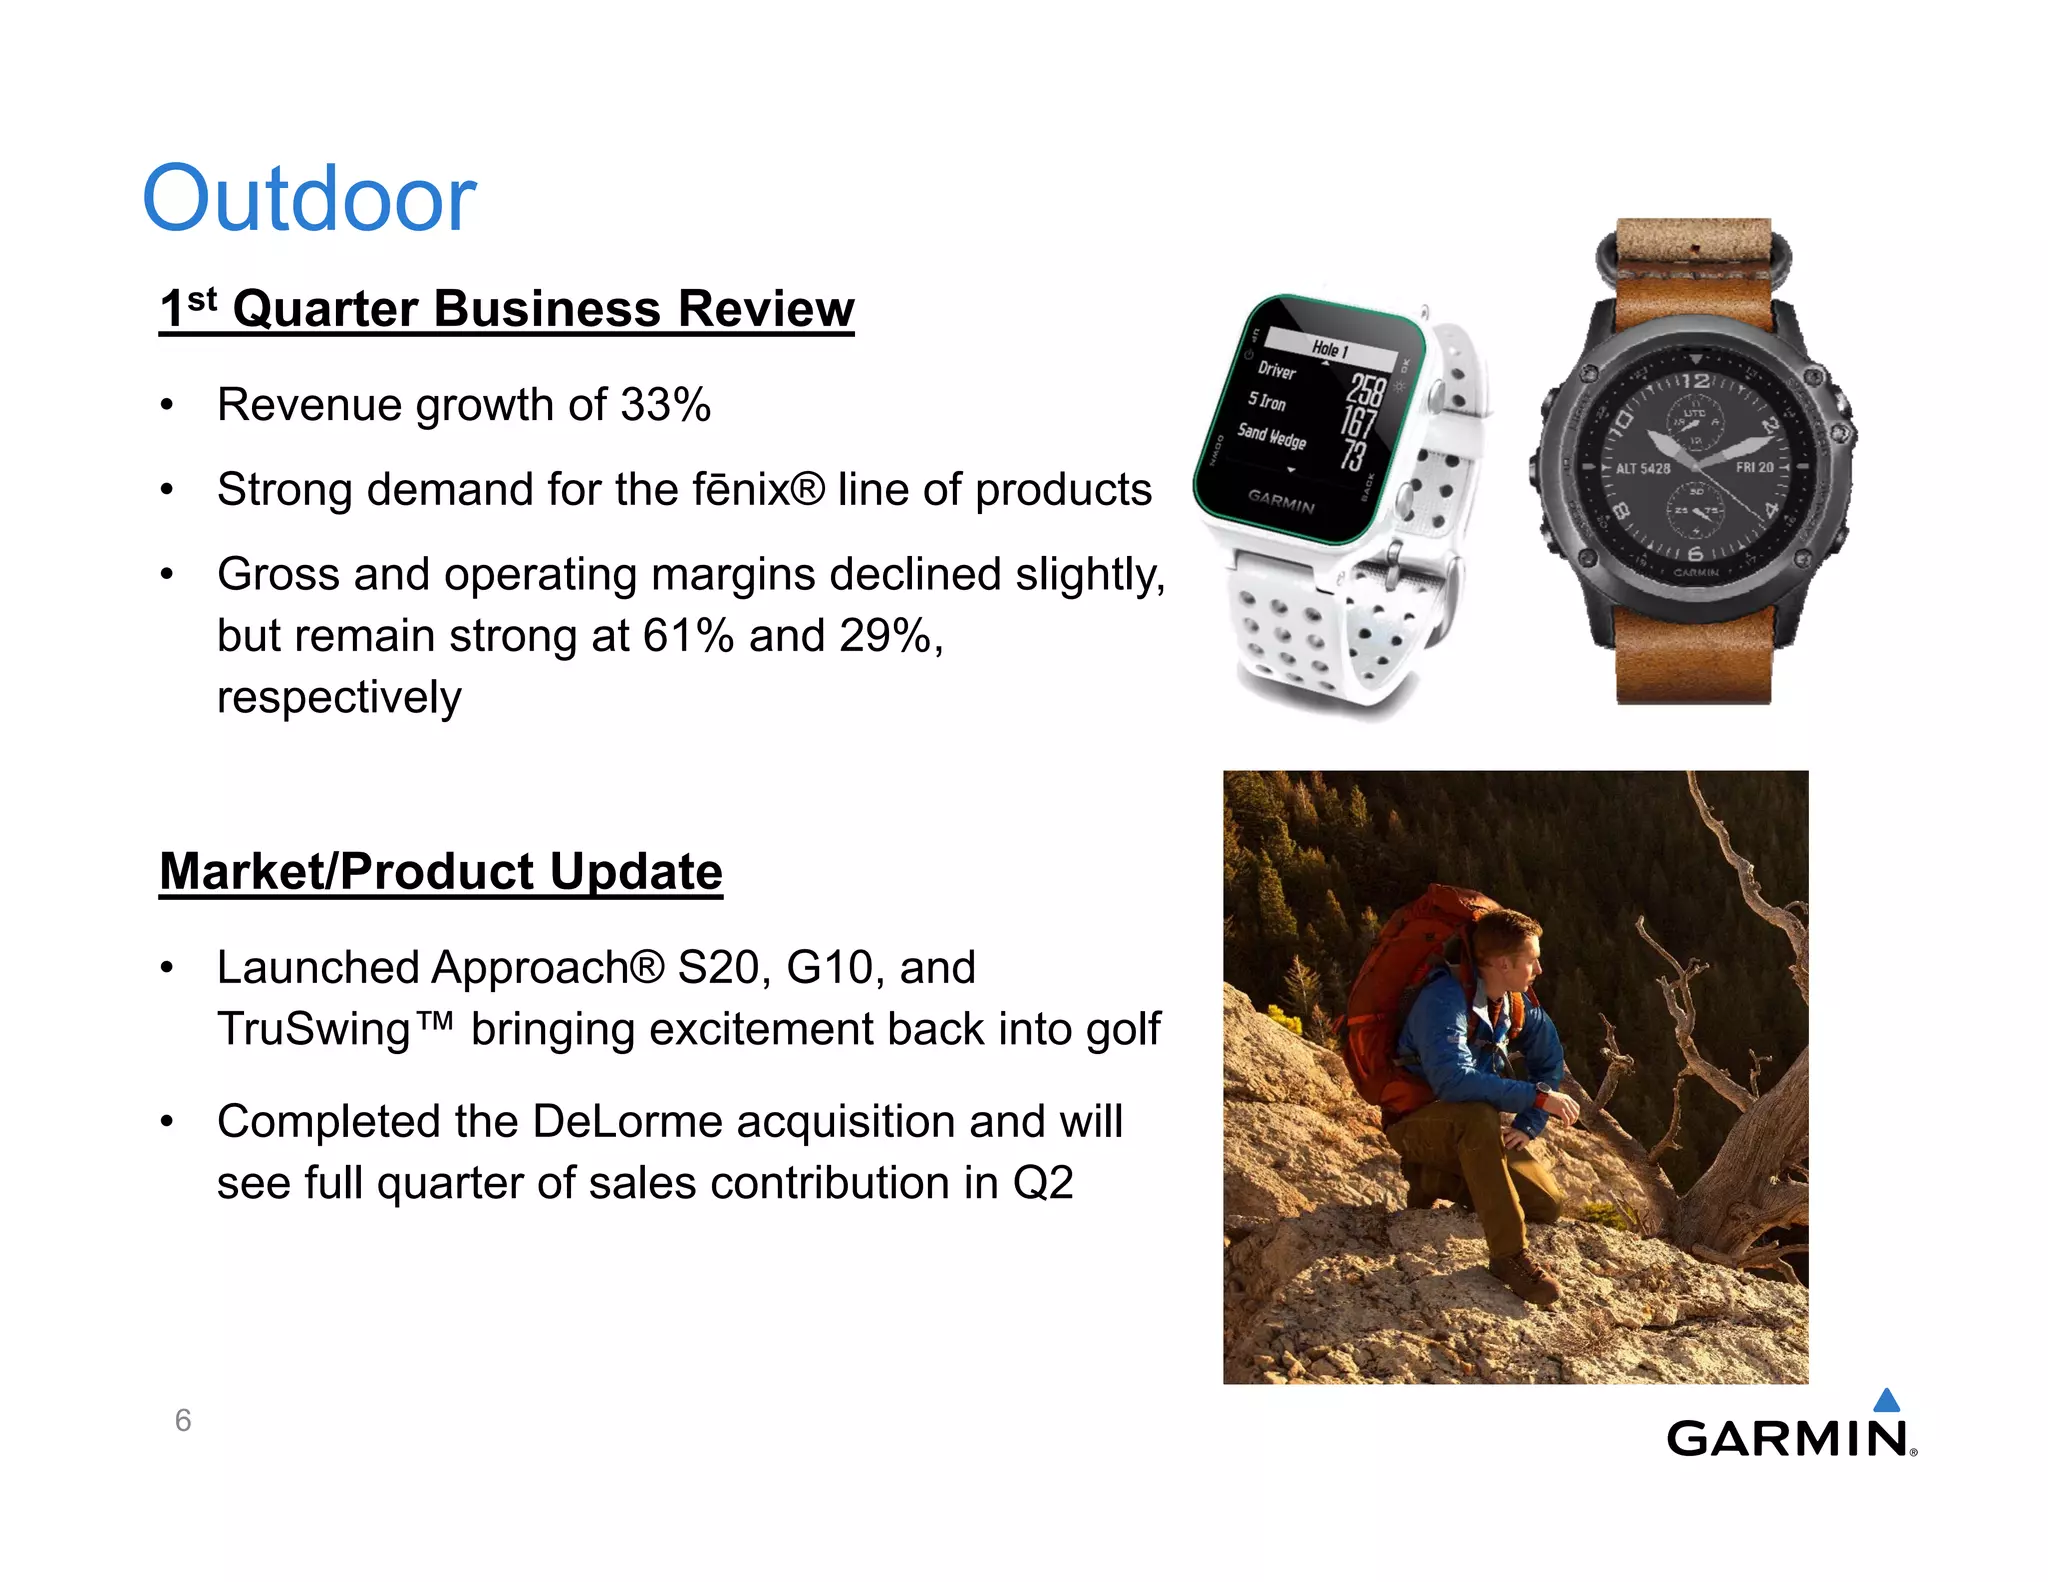

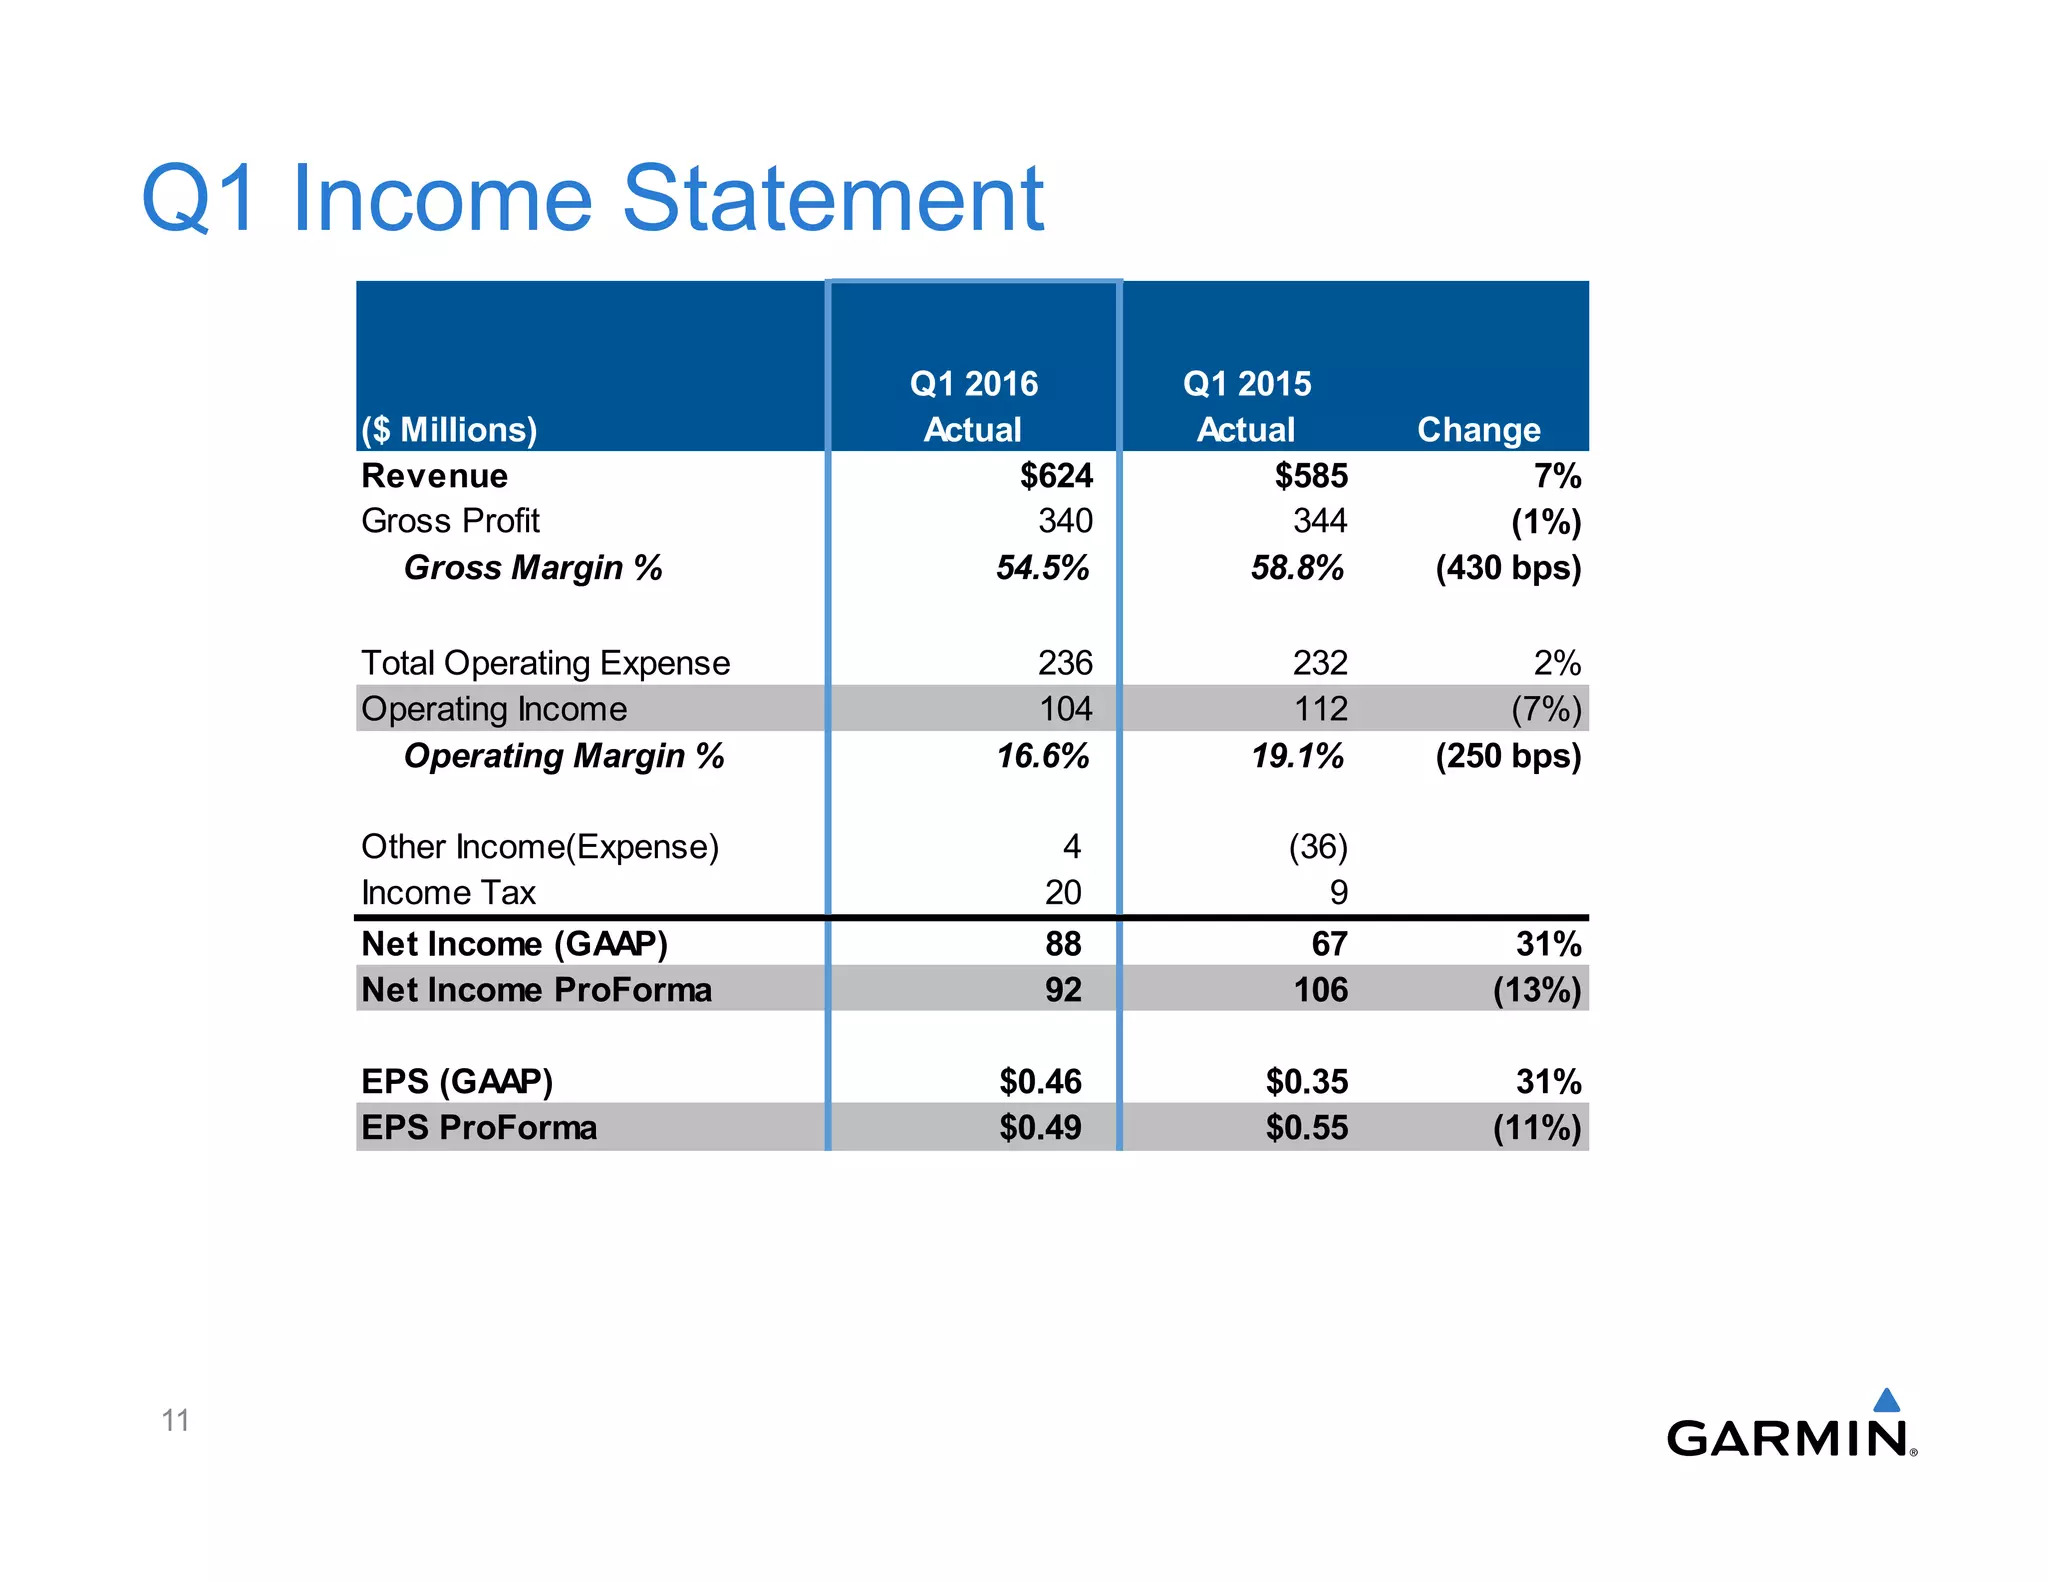
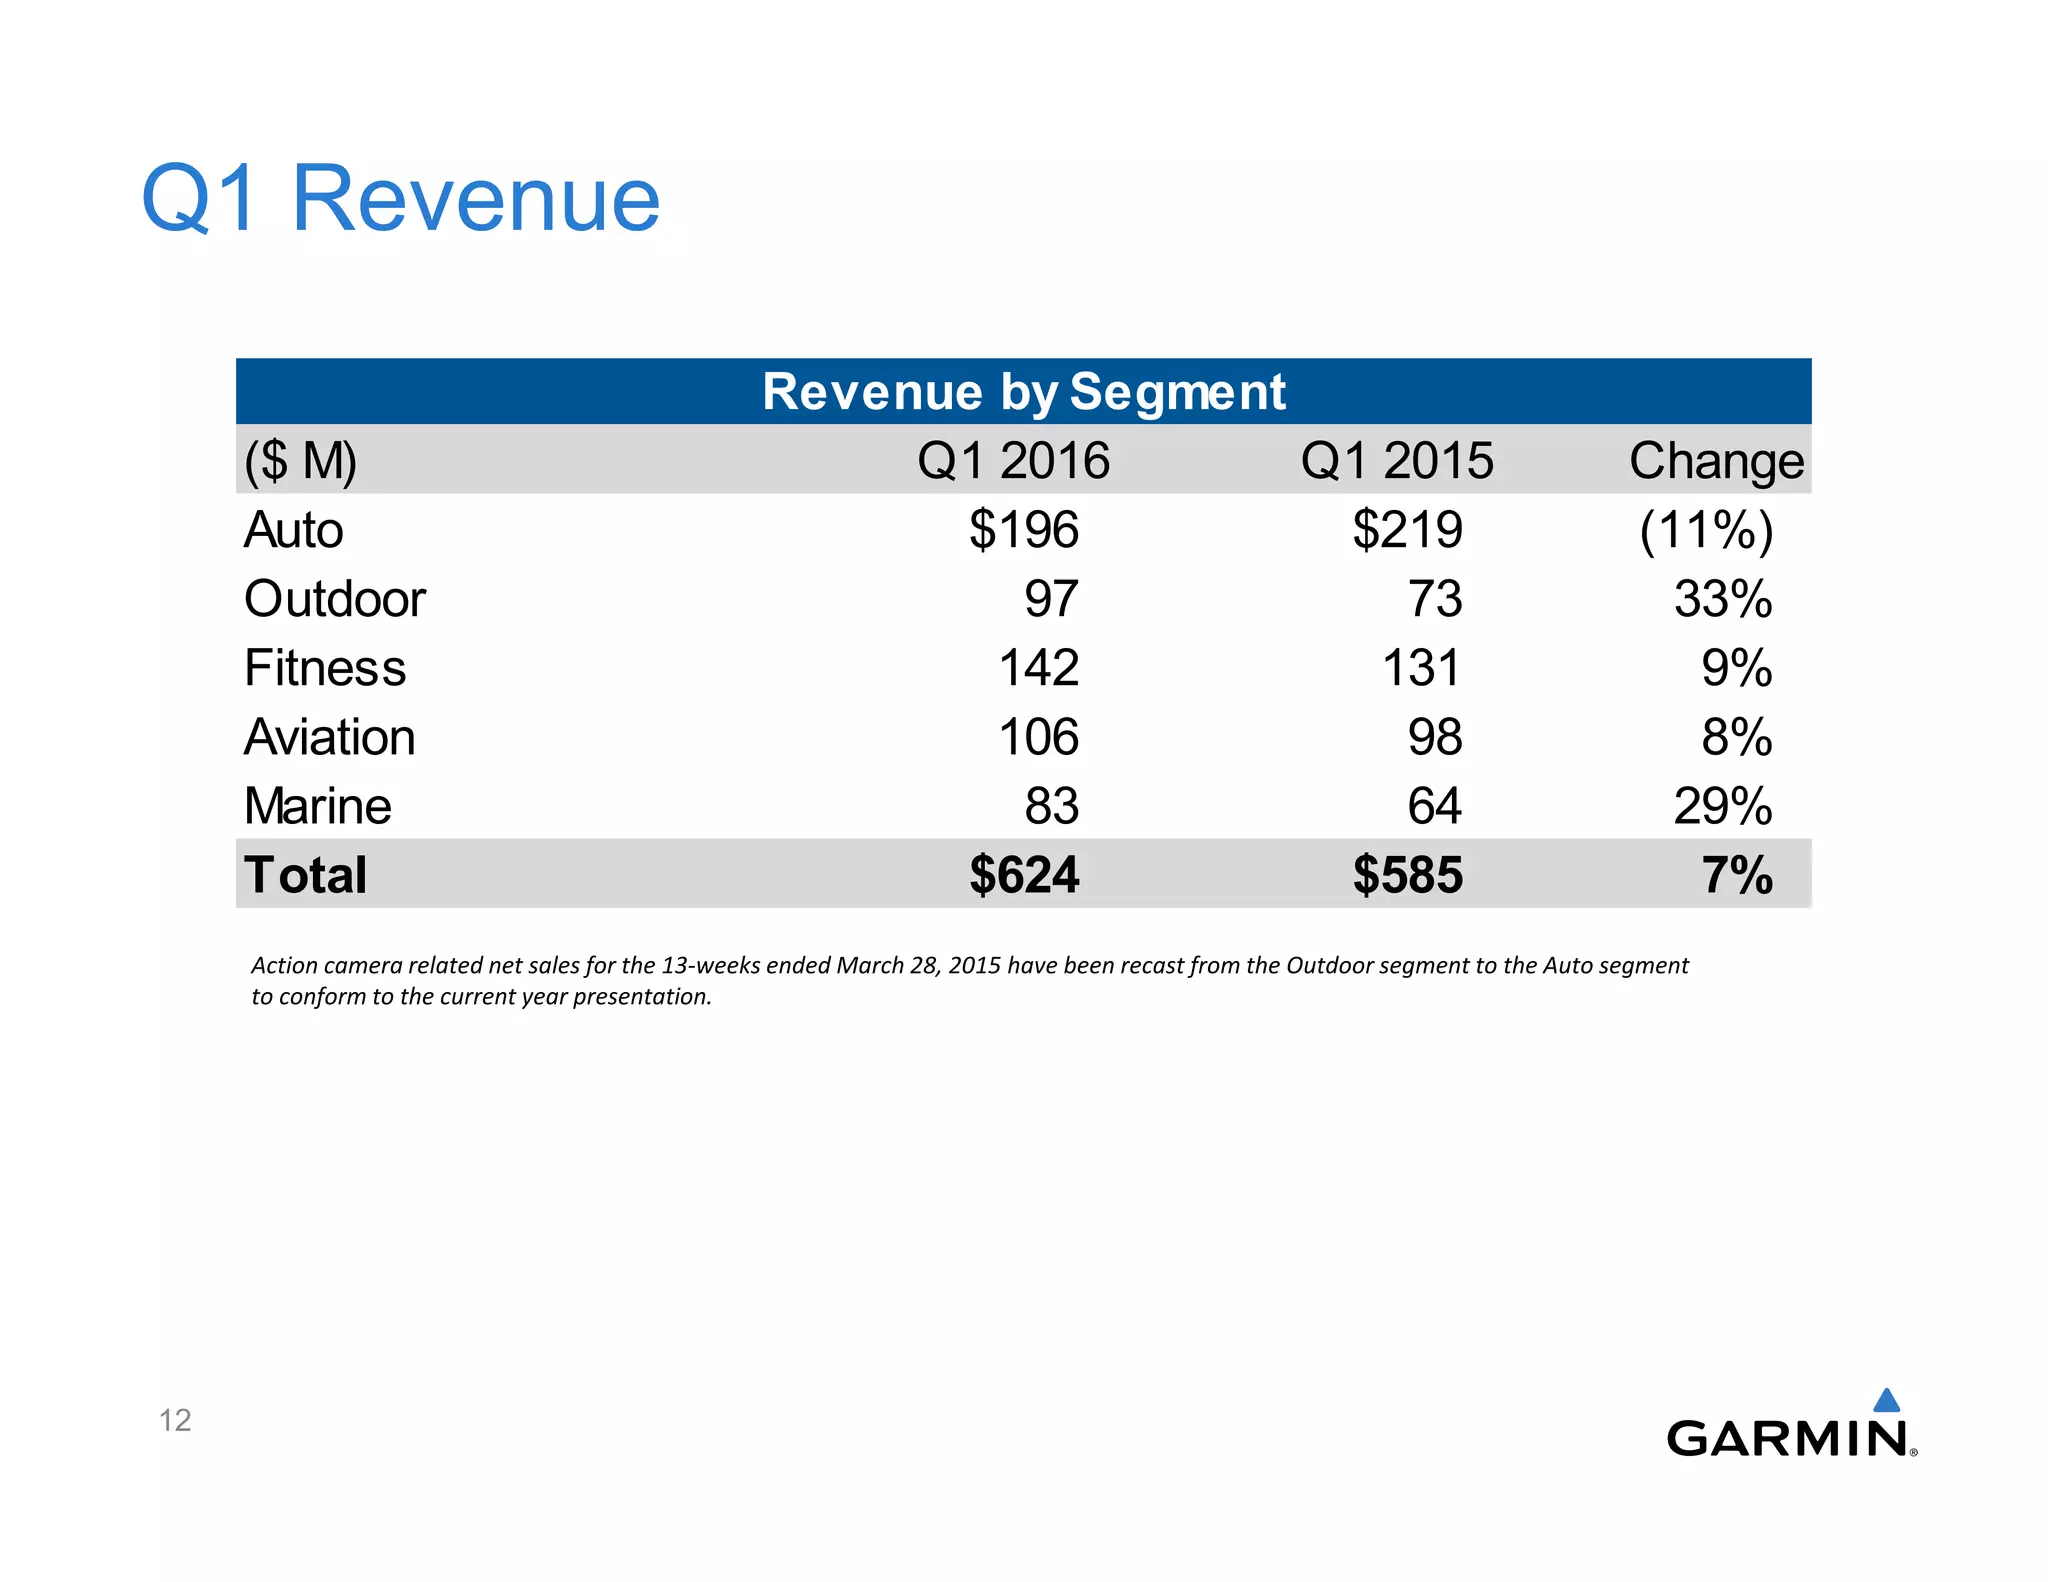
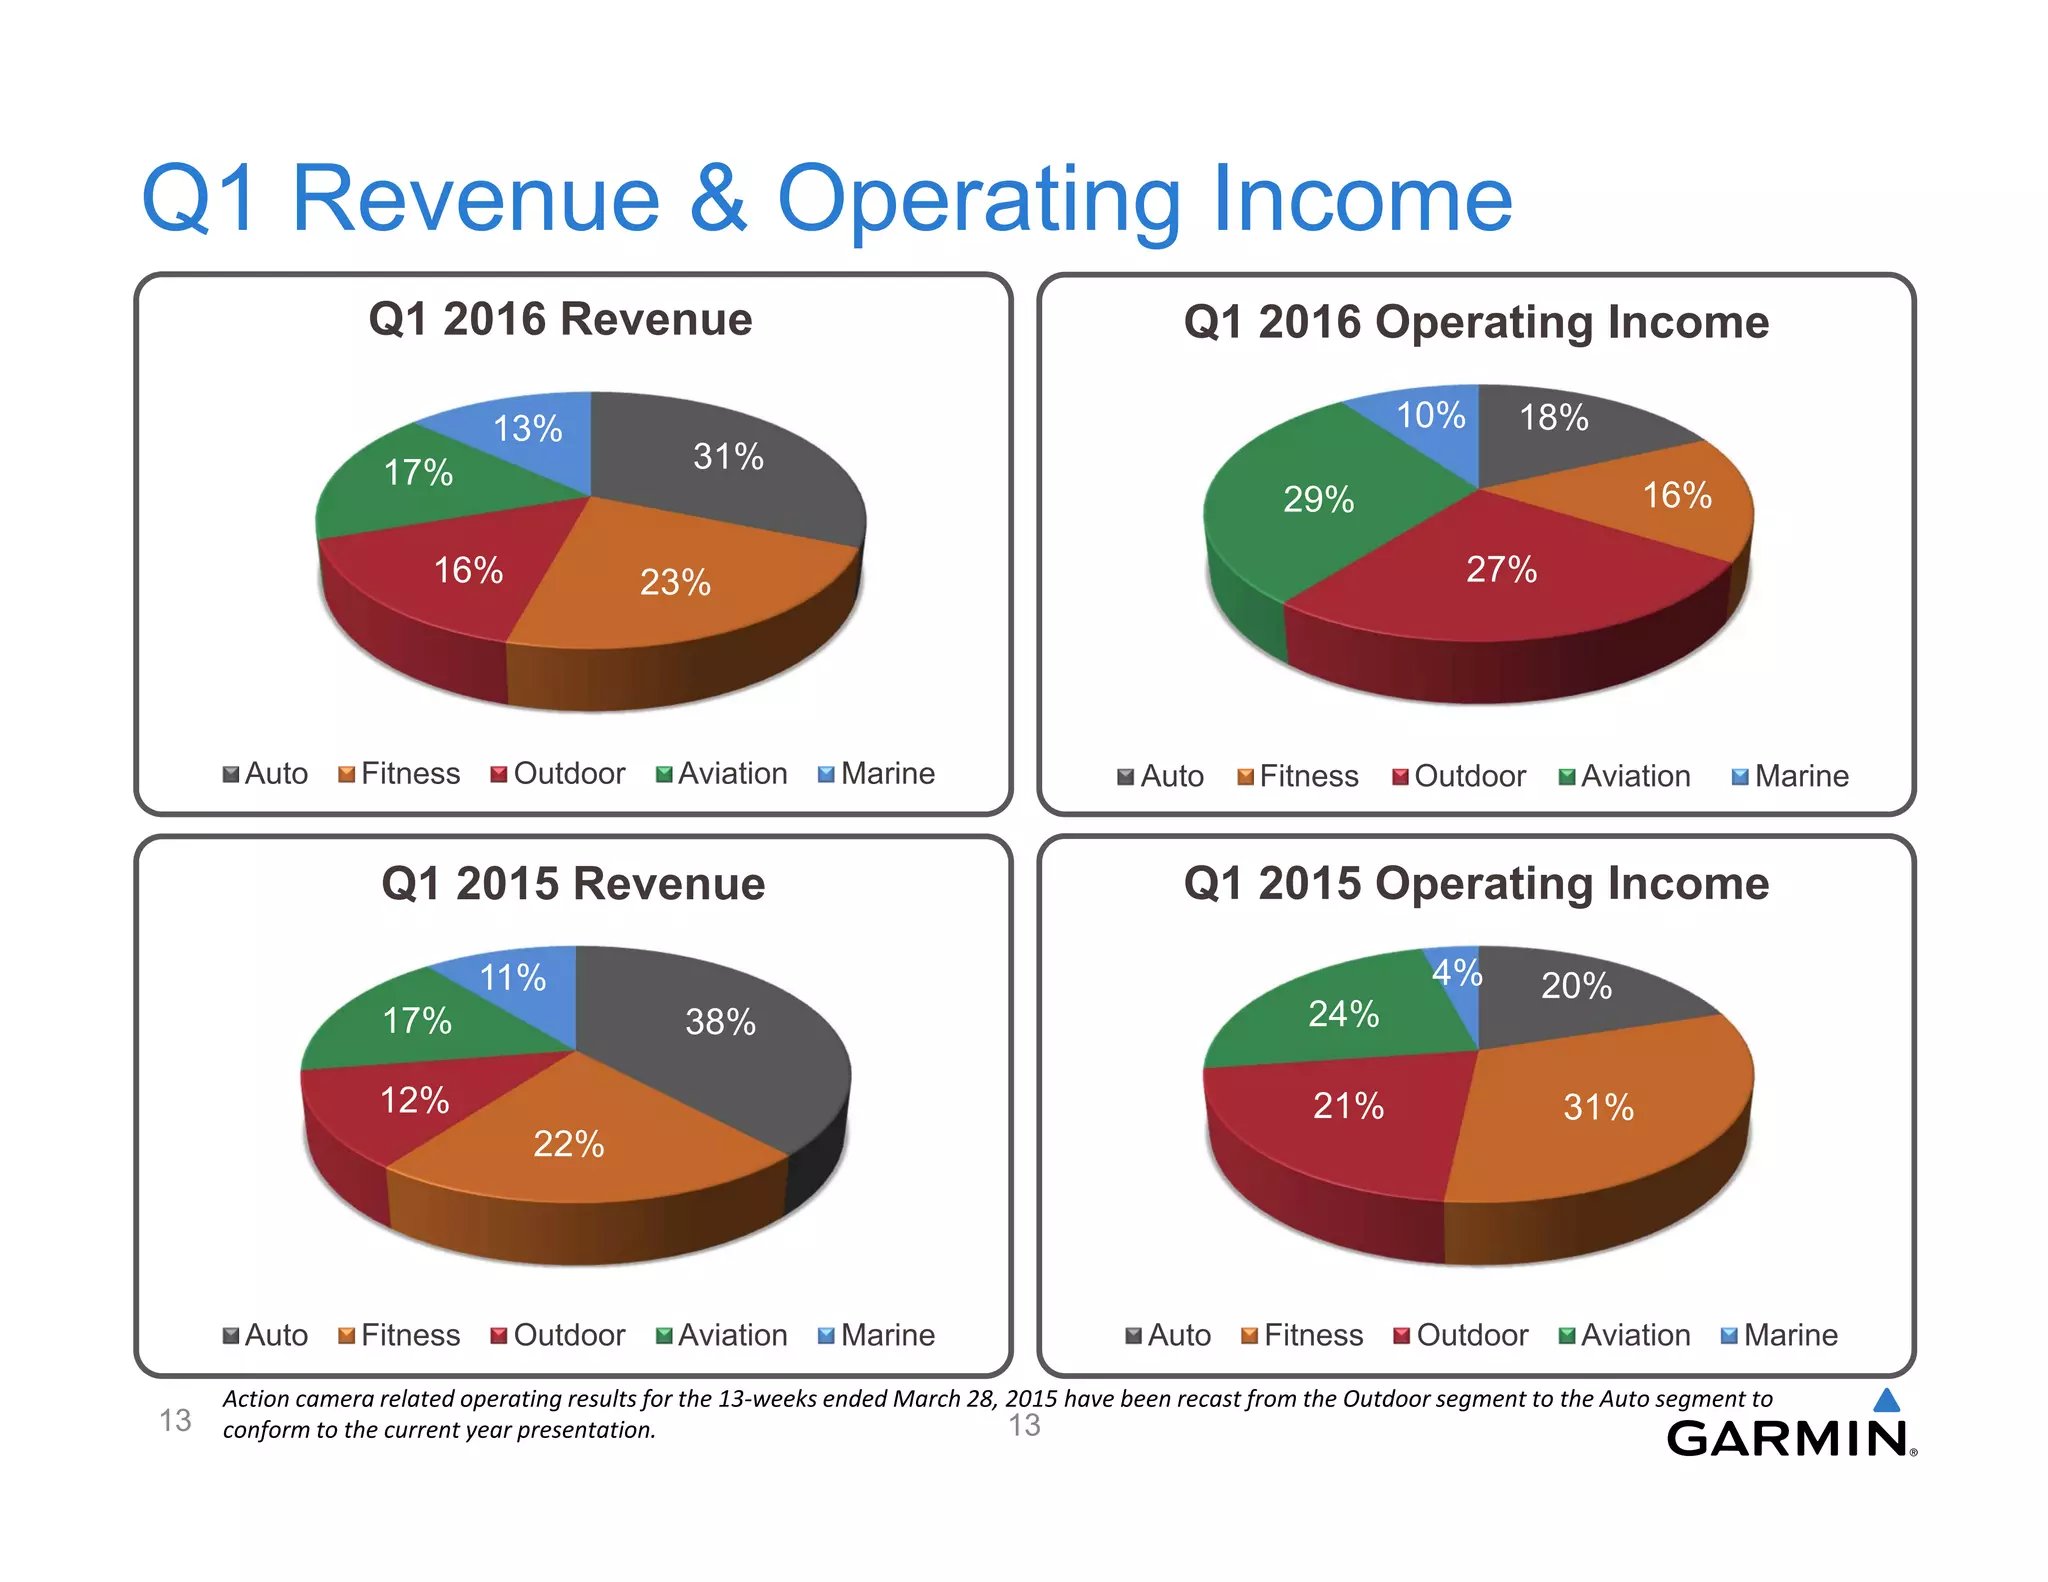


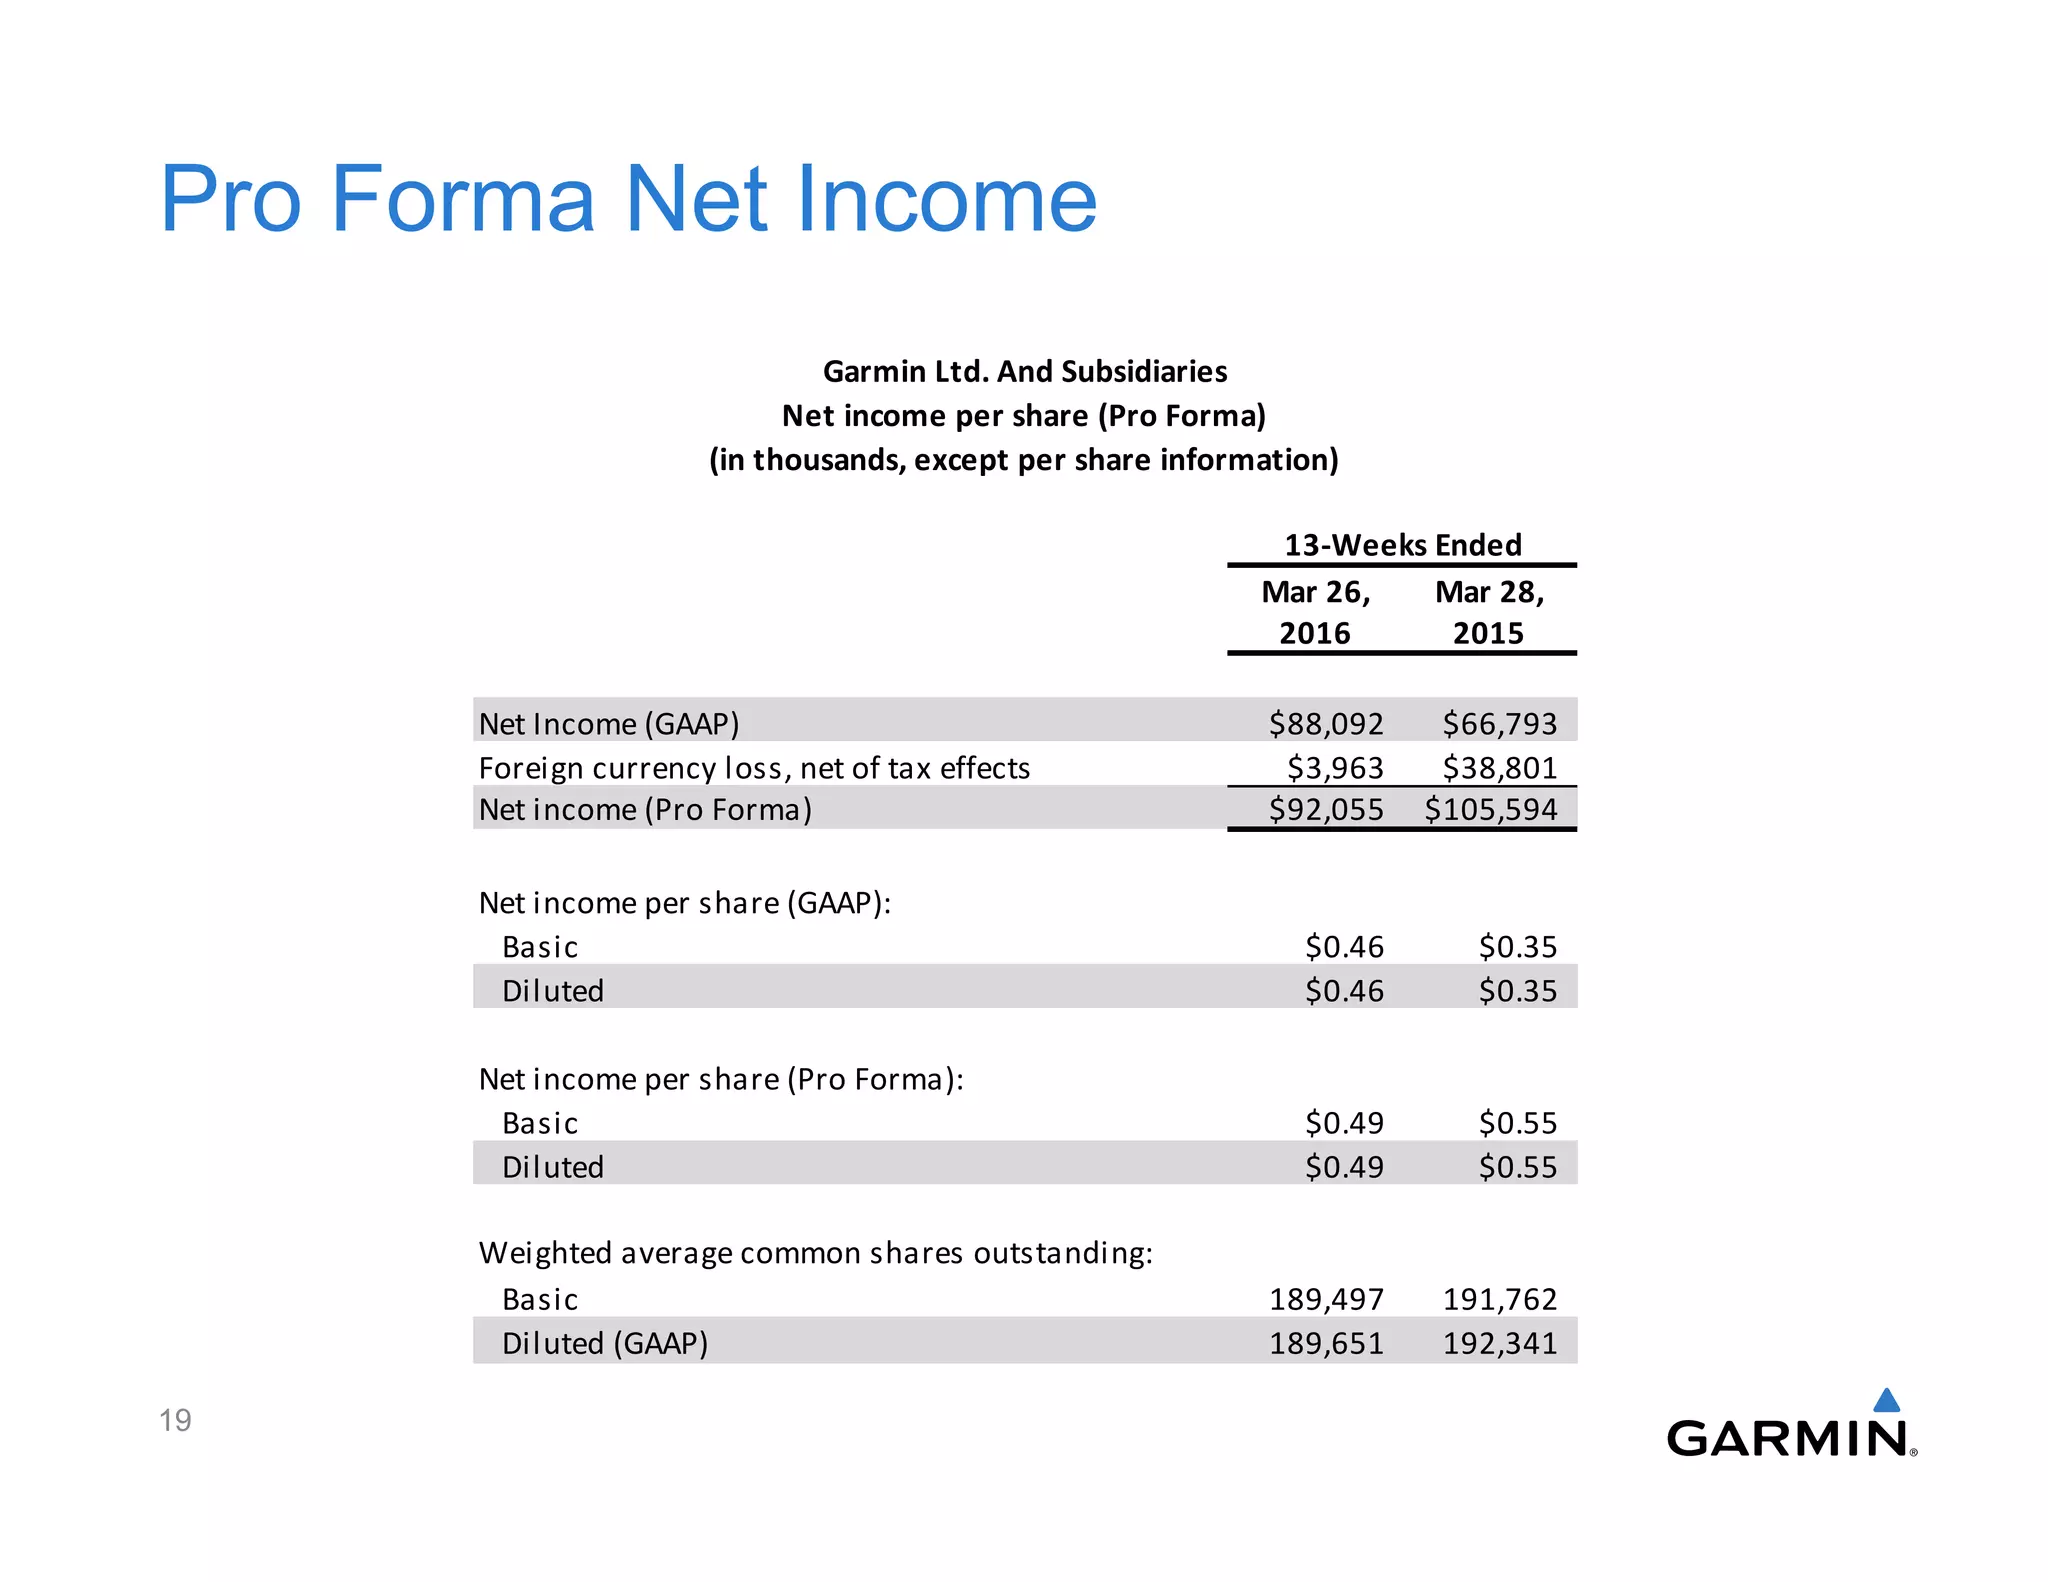

- Garmin reported consolidated revenue of $624 million for Q1 2016, up 7% from the previous year, driven by strong growth in the outdoor, fitness, aviation and marine segments. - Gross and operating margins for Q1 2016 were 54.5% and 16.6% respectively. GAAP and pro forma EPS were $0.46 and $0.49. - The fitness segment saw revenue growth of 9% due to strong demand for products with Garmin Elevate wrist heart rate technology. The outdoor segment saw 33% revenue growth driven by strong demand for the fenix line of products.


