Download as PDF, PPTX

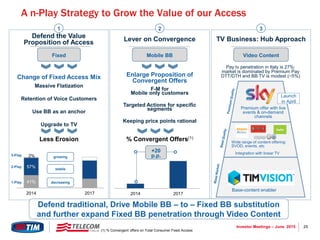
![3Investor Meetings – June 2015
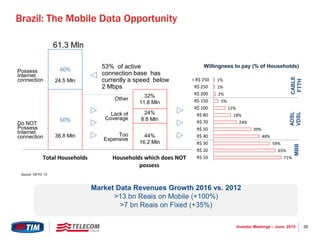
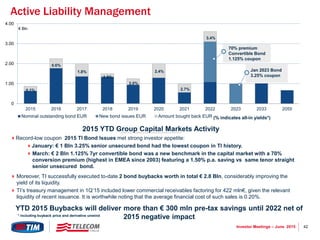
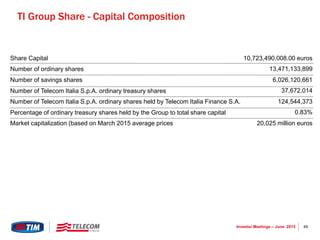
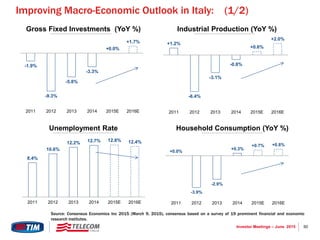
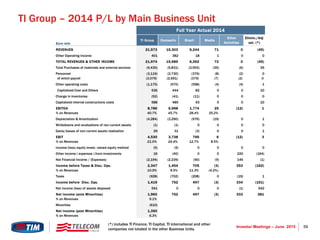
Current TI Group Shareholders Breakdown
After the demerger of Telco, Vivendi now owns
14.9% of Telecom Italia’s ordinary shares. Foreign
Institutional Shareholders own about 55% of TI’s
voting stock.
“… Vivendi today received 1.11 billion ordinary shares (or
8.24%) of Telecom Italia, the leading fixed and mobile
telecommunications operator in Italy, in exchange for 4.5% of the
share capital of Telefonica Brasil, in accordance with the option
given to it as part of the sale of GVT to Telefonica, which closed
on May 28, 2015.
Separately, the Group increased its ordinary shares in
Telecom Italia from 1.90% recently purchased, with an
additional stake of 4.76% purchased on June 22, up to 6.66%
[1], representing a global cash payment of approximately €1
billion…
[1] 5.6% of the ordinary shares are the subject of a hedge
consisting of a put option granted by Vivendi and a call option
sold by Vivendi. These options, having a maximum duration of
three years, will be settled, in Vivendi’s discretion, either in
shares or in cash …“
Current Market Cap (€bln)*
21.66bln Ordinary Shares 15.94
Saving Shares 5.72
*Performance as of June 26th , 2015.
Last 1 Year
TI Shares
Performance*
Vivendi
14.90%
Telecom Italia
Group 1.20%
Italian
institutional
investors
6.7%
Foreign
institutional
investors
54.56%
Italian
companies
0.77%
Foreign
companies
3.02%
Other italian
shareholders
14.54%
Other foreign
shareholders
0.07%
Other 4.20%
Source: Vivendi press release, June 24, 2015
TI Ords. +28.4%
TI Savs. +32.5%
FTSEMIB +11.6%
TLC Europe +27.1%
Jun-14 Sep-14 Dec-14 Mar-15 Jun-15](https://image.slidesharecdn.com/company-presentation-june-2015-150804083934-lva1-app6891/85/Company-Presentation-June-2015-4-320.jpg)
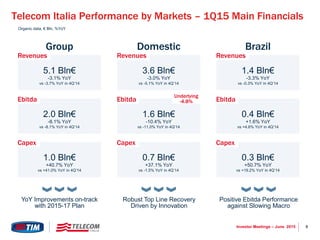
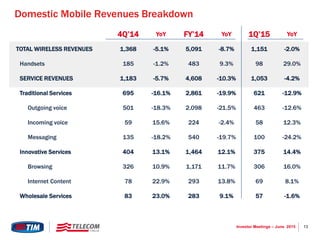
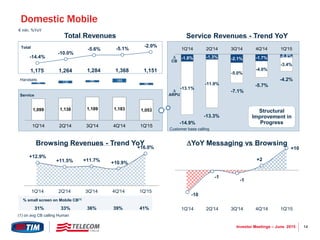
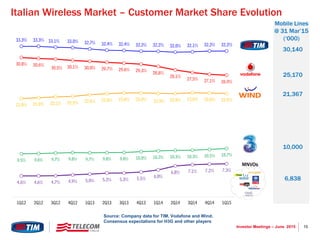
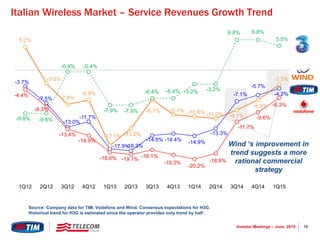
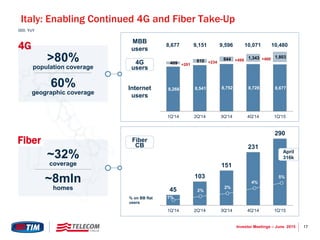
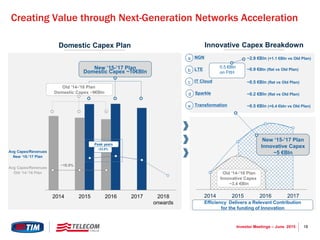
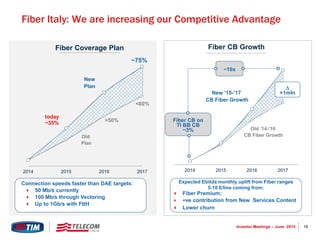
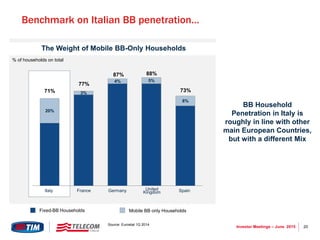

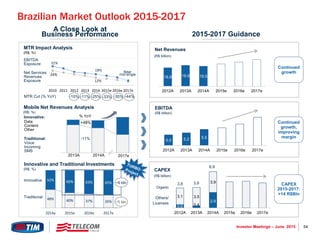
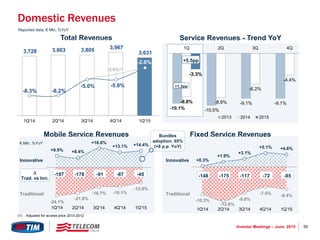
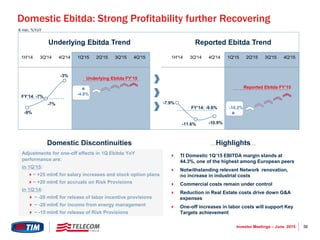
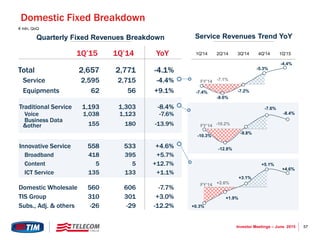
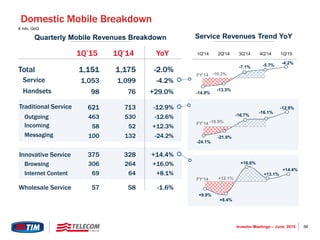
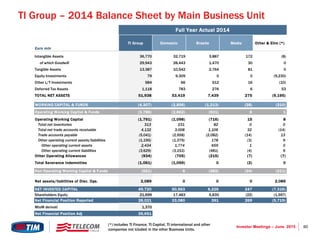

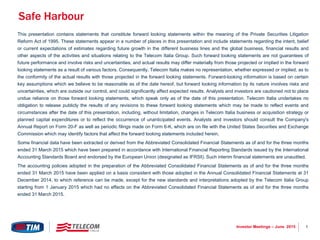
The document provides an overview and financial update for Telecom Italia Group for investor meetings in June 2015. Key points include: Total revenues for FY 2014 were €21.6 billion, down 5.4% YoY, with EBITDA of €8.8 billion down 6.8% YoY. Capex for FY 2014 was €5 billion, up 13.3% YoY including licenses. Net debt including licenses was €26.65 billion as of end of FY 2014. First quarter 2015 results show improvements in line with the company's 2015-2017 plan targets.


