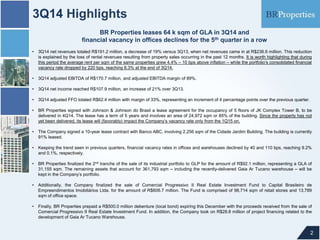
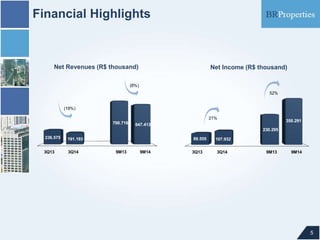
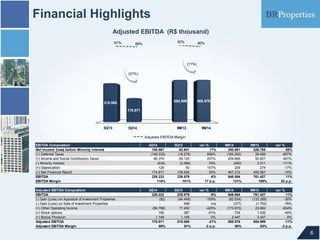
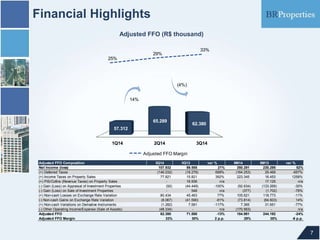
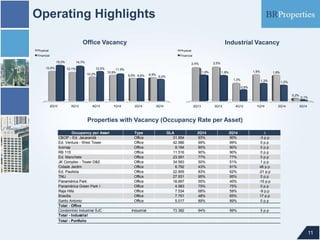
In 3Q14, BR Properties saw a 19% decrease in net revenues compared to 3Q13 due to property sales. Adjusted EBITDA was R$170.7 million with a margin of 89%. Net income increased 21% to R$107.9 million. The company signed new lease agreements, sold additional industrial properties, and prepaid debt with proceeds from asset sales. Financial vacancy rates declined again this quarter in offices and warehouses.
Monthly Business Assessment PowerPoint Presentation SlidesSlideTeam
Presenting this set of slides with name - Monthly Business Assessment Powerpoint Presentation Slides. Enhance your audiences knowledge with this well researched complete deck. Showcase all the important features of the deck with perfect visuals. This deck comprises of total of sixtysix slides with each slide explained in detail. Each template comprises of professional diagrams and layouts. Our professional PowerPoint experts have also included icons, graphs and charts for your convenience. All you have to do is DOWNLOAD the deck. Make changes as per the requirement. Yes, these PPT slides are completely customizable. Edit the colour, text and font size. Add or delete the content from the slide. And leave your audience awestruck with the professionally designed Monthly Business Assessment Powerpoint Presentation Slides complete deck.
Vertailuanalyysi suurten kaupunkiseutujen elinvoimasta 2000 2012TimoAro
Vertailuanalyysi perustuu suurten kaupunkiseutujen muutoksen ja kehityksen osoittamiseen vuosina 2000-2012. Suurten kaupunkiseutujen (13) kehitystä 2000-luvun aikanaverrataan 10 kehitystä kuvaavan muuttujan avulla. Kaupunkiseutuja verrataan toisiinsa eri muuttujien kohdalla muutos- ja kasvuprosentin avulla. Tavoitteena on tunnistaa ne kaupunkiseudut, joissa muutos on ollut suurin 2000-luvun aikana.
The overall strategy for PostStream is to work with clients and prospective clients to enable their transition from a physical only distribution model to an optimised multi-channel distribution model that reduces distribution costs, mitigates risk, and improves deliverability and governance for transactional, operational and marketing customer communications.
Rudi Bekkers shares with the AOM audience the ideas of his paper authored with Simon den Uijl and Henk de Vries, whose focus is on Patent Pools. Their work examines the experiences with three generations of patent pools in the optical disc industry.
den Uijl, S., Bekkers, R., & de Vries, H. (2013). Managing intellectual property using patent pools: Lessons from three generations of pools in the optical disc industry. California Management Review, 55(4), 31-50.
Esitys Kunnallisjohdon seminaarissa muuttoliikkeestä ja muuttoliikkeen pirullisuudesta tasapainoisen alue- ja väestörakenteen näkökulmasta. Esityksessä runsaasti kuntakarttoja ja TOP 20 -taulukoita muuttoliikkeen määrään ja rakenteeseen liittyvistä muuttujista. Lisäksi lyhyt yhteenveto tulevasta analyysistä 'Suomen vetovoimaisimmista kunnista 2010-luvulla'.
A detailed appraisal of a company as far as company’s progress is concerned is a must and should be put together in the form of PPT presentation. There are many valuable steps that must be kept in mind while displaying the data in Sample Financial Analysis Report Manufacturing PowerPoint Presentation Slides. The core areas which need due and special attention in PPT layout include identification of economic characteristics, areas focusing on companies strategies, tracking the company’s financial statements along with its profitability and risks. Tabular form of data and bar graphs featured in the PPT templates focus on areas like revenue, net profit, operating profit and more. The different modes of showing data on balance sheets in slides of PowerPoint presentation makes your life so much easy as you just need to add the data and you are ready to go. All this composite form of data representation in financial analysis report manufacturing presentation slide helps you lead and take the right decisions well in time Brief them on first aid with our Sample Financial Analysis Report Manufacturing PowerPoint Presentation Slides. Enlighten folks on handling injuries.
In case you need to present economic status of your company then our content-ready financial statement analysis PowerPoint Presentation is ideal for you. This income statement PPT presentation having multiple slides such as financial projections, key financial ratios, liquidity ratios, cash flow statement KPIs, profitability ratios, activity ratios, solvency ratios, income statement overview and funding updates etc. This cash flow assessment PowerPoint template goes well with topics like profitability analysis, business impact analysis, financial health, and income statement, balance sheet, statement of cash flow, business performance analysis, financial health, and future prospects of an organization, project future performance, economic analysis, company analysis, business valuation, fundamental analysis. For successful business presentation, PowerPoint background is as important as the content in the slides. Our accounting statement PPT slide provides you both content rich as well as professional slides. Download our financial statement analysis presentation slides to project your business future performance. Elucidate on your ideas with our Financial Statement Analysis PowerPoint Presentation Slides. Drive your team to excellence.
2. 3Q14 Highlights
• 3Q14 net revenues totaled R$191.2 million, a decrease of 19% versus 3Q13, when net revenues came in at R$236.6 million. This reduction
is explained by the loss of rental revenues resulting from property sales occurring in the past 12 months. It is worth highlighting that during
this period the average rent per sqm of the same properties grew 4.4% – 10 bps above inflation – while the portfolio’s consolidated financial
vacancy rate dropped by 220 bps, reaching 8.3% at the end of 3Q14.
• 3Q14 adjusted EBITDA of R$170.7 million, and adjusted EBITDA margin of 89%.
• 3Q14 net income reached R$107.9 million, an increase of 21% over 3Q13.
• 3Q14 adjusted FFO totaled R$62.4 million with margin of 33%, representing an increment of 4 percentage points over the previous quarter.
• BR Properties signed with Johnson & Johnson do Brasil a lease agreement for the occupancy of 5 floors of JK Complex Tower B, to be
delivered in 4Q14. The lease has a term of 5 years and involves an area of 24,972 sqm or 85% of the building. Since the property has not
yet been delivered, its lease will (favorably) impact the Company’s vacancy rate only from the 1Q15 on.
• The Company signed a 10-year lease contract with Banco ABC, involving 2,256 sqm of the Cidade Jardim Building. The building is currently
91% leased.
• Keeping the trend seen in previous quarters, financial vacancy rates in offices and warehouses declined by 40 and 110 bps, reaching 9.2%
and 0.1%, respectively.
• BR Properties finalized the 2nd tranche of the sale of its industrial portfolio to GLP for the amount of R$92.1 million, representing a GLA of
31,155 sqm. The remaining assets that account for 361,793 sqm – including the recently-delivered Gaia Ar Tucano warehouse – will be
kept in the Company’s portfolio.
• Additionally, the Company finalized the sale of Comercial Progressivo II Real Estate Investment Fund to Capital Brasileiro de
Empreendimentos Imobiliários Ltda. for the amount of R$606.7 million. The Fund is comprised of 98,714 sqm of retail stores and 13,789
sqm of office space.
• Finally, BR Properties prepaid a R$500.0 million debenture (local bond) expiring this December with the proceeds received from the sale of
Comercial Progressivo II Real Estate Investment Fund. In addition, the Company took on R$28.8 million of project financing related to the
development of Gaia Ar Tucano Warehouse.
2
BR Properties leases 64 k sqm of GLA in 3Q14 and
financial vacancy in offices declines for the 5th quarter in a row
3. Portfolio
3
3Q14 Revenue Breakdown
Portfolio Breakdown
(% market value)
Portfolio Breakdown
(% GLA)
Portfolio Market Value
4Q12 1Q13 2Q13 3Q13 4Q13 1Q14 2Q14 3Q14
13.840 14.031 14.096 13.759 13.423 13.538
11.248 10.594
Asset sales in the
amount of R$482
million
Sale of Industrial
Portfolio – 1st Tranche
R$ 2.3 billion Sale of Industrial
Portfolio(2nd Tranche)
and FII CPII - R$ 698
million
Services 2.2%
Straight-line 1.1% Leasing 96.7%
85%
10%
6%
Office
Industrial
Retail
63%
27%
8%
1%
Office AAA Office Industrial Retail
32%
25%
41%
2%
Office AAA Office Industrial Retail
4. Portfolio Recycling
4
Sale of Industrial Portfolio – 2nd Tranche
Sold GLA 31.155
Sale Price 92.055.000R$
Sale of Industrial Portfolio - 2nd Tranche
Sold Properties Type City State
Acquisition
Date
# of
Properties
Owned GLA
(sqm)
BBP - CEA - Cristal Industrial Atibaia SP 26/02/10 1 6.453
BBP - Barão de Mauá - Beethoven Industrial Atibaia SP 26/02/10 1 3.919
BBP - Barão de Mauá - Brahms Industrial Atibaia SP 26/02/10 1 6.317
BBP - Barão de Mauá - Mozart Industrial Atibaia SP 26/02/10 1 14.467
Total 4 31.155