Downloaded 112 times

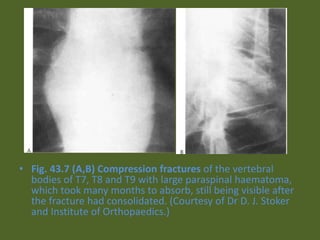
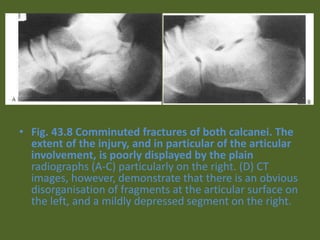
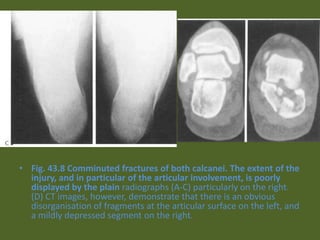
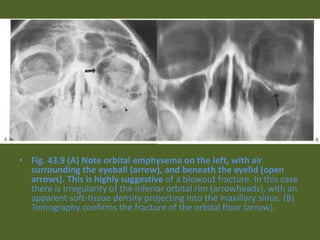
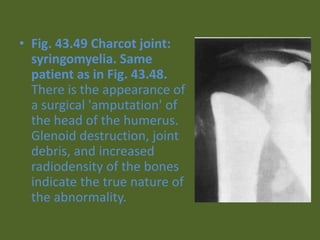
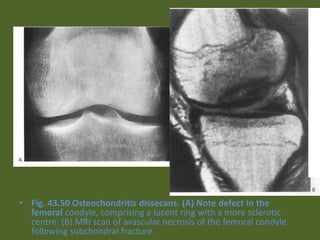
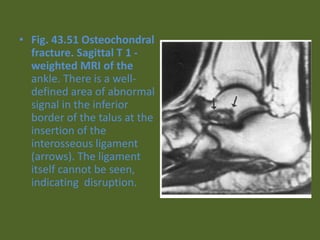


The document contains 43 figures showing various bone fractures and bone-related injuries visible on x-rays and other imaging modalities like MRI and CT scans. The figures show a variety of fractures types including comminuted fractures, compression fractures, avulsion fractures, stress fractures and more. They involve many bones including the tibia, femur, radius, vertebrae and others. The imaging helps identify fracture patterns, bone displacement, and complications like non-union, malunion and avascular necrosis.


