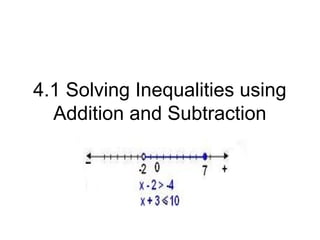
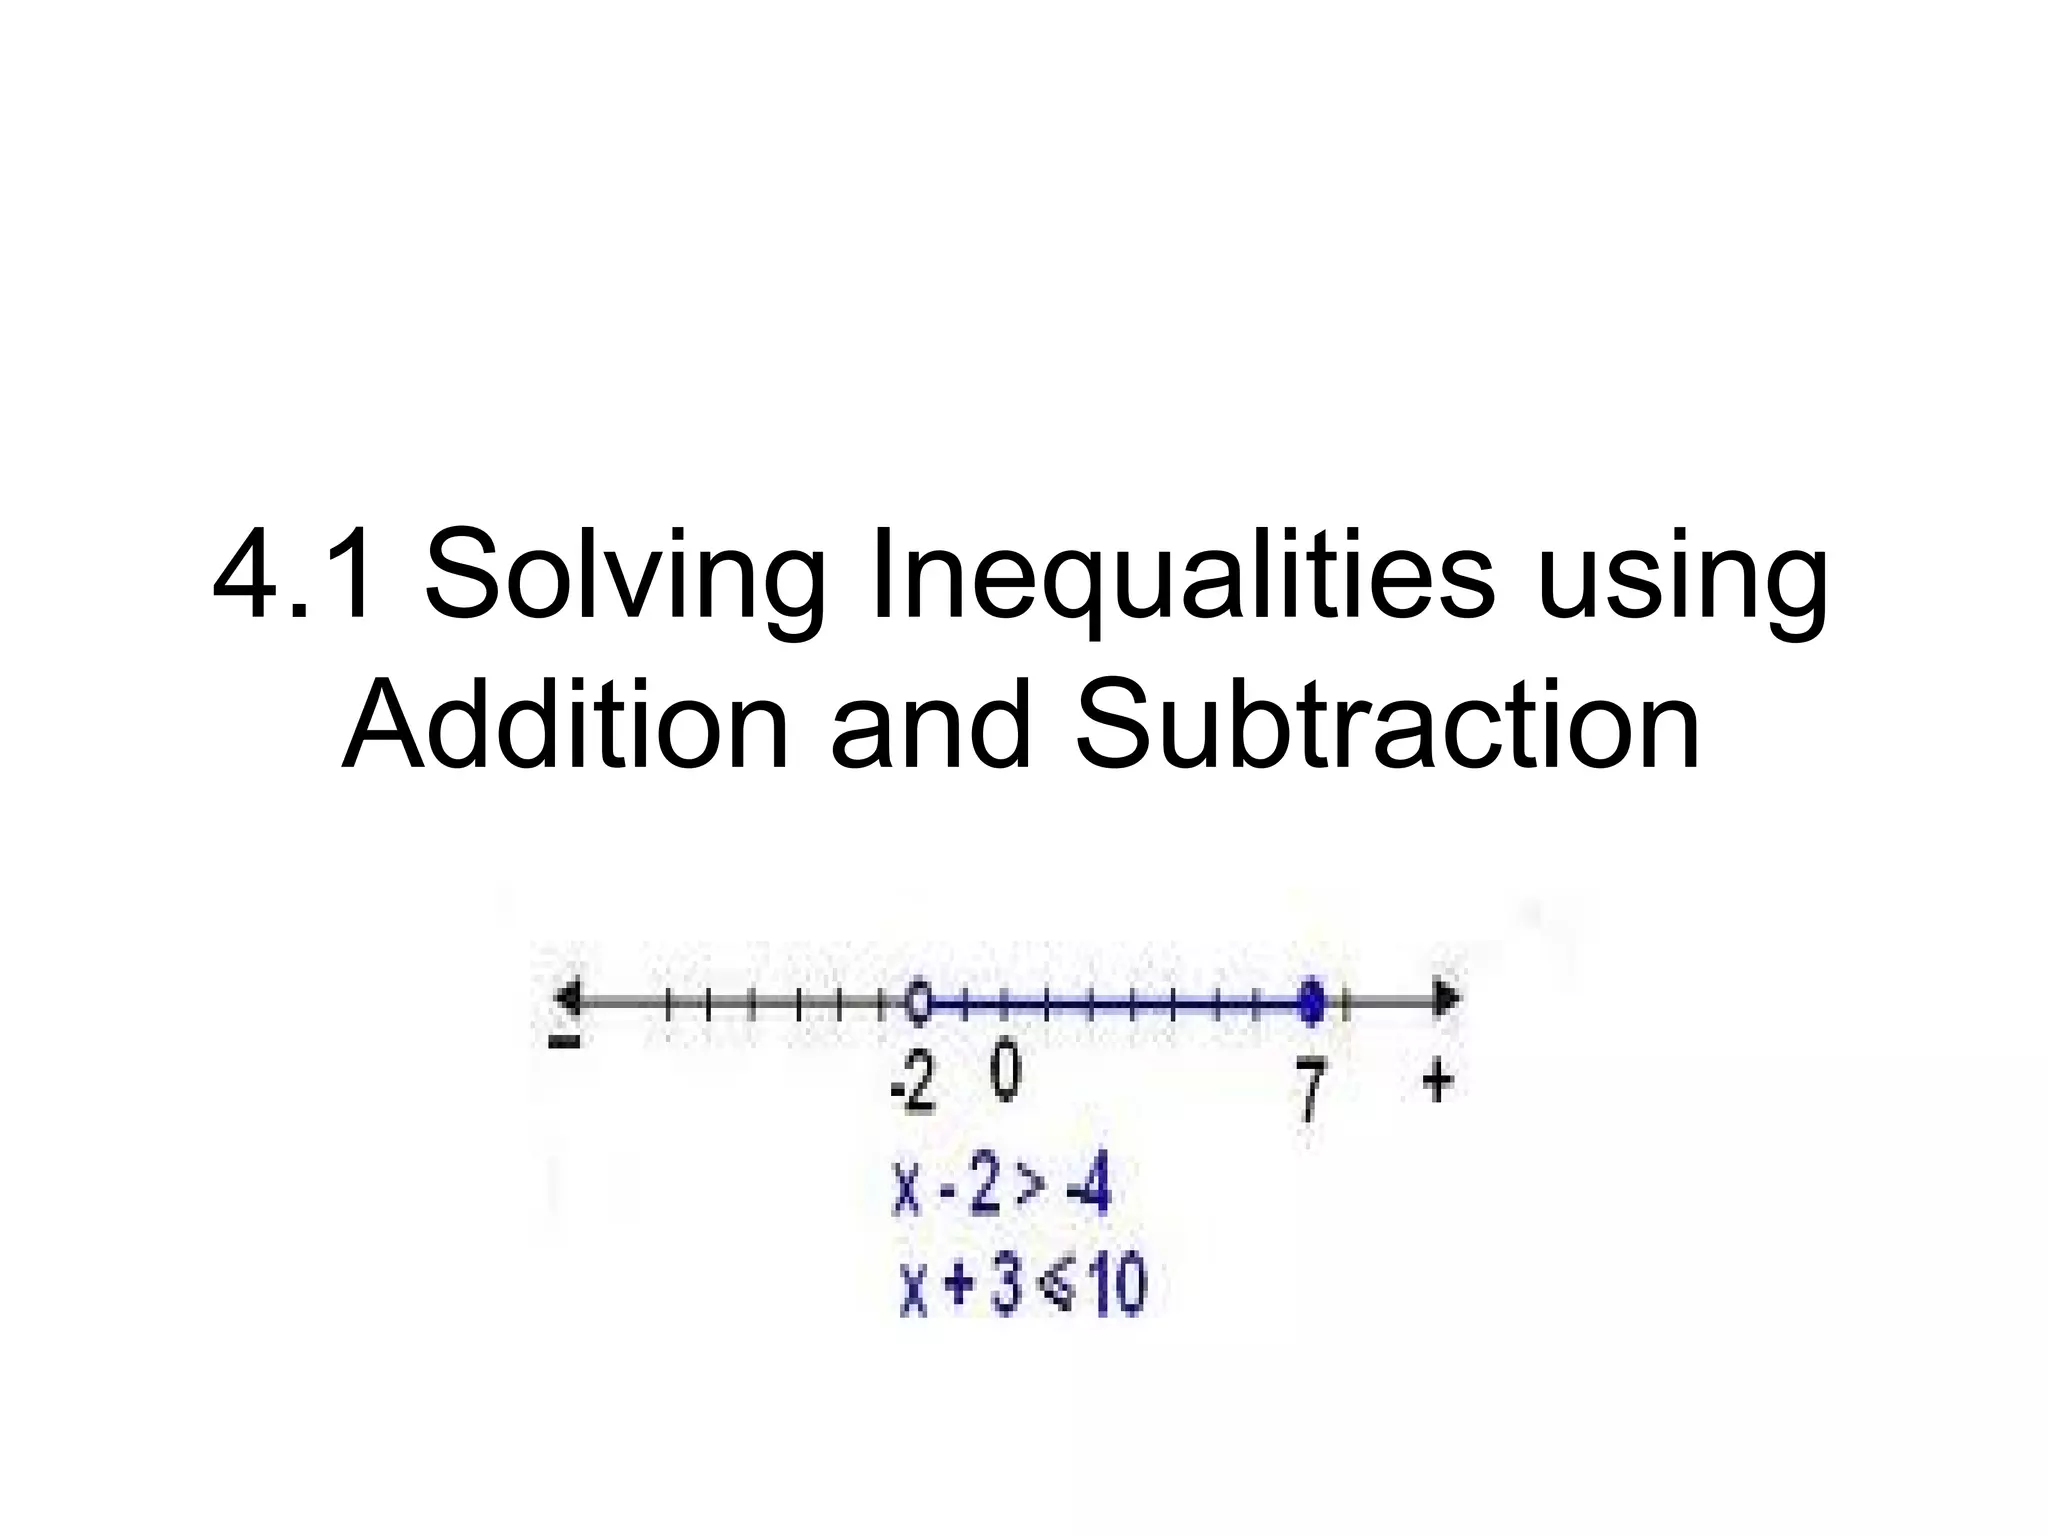
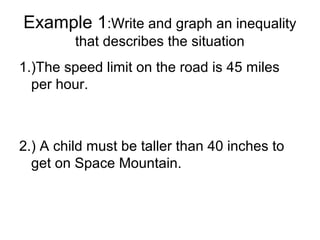
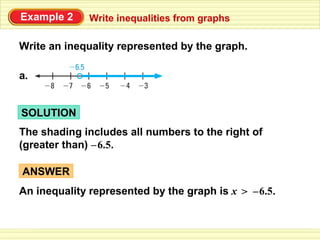
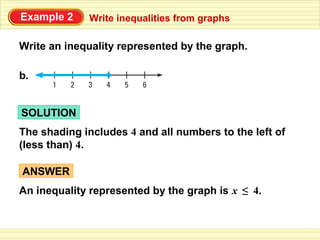
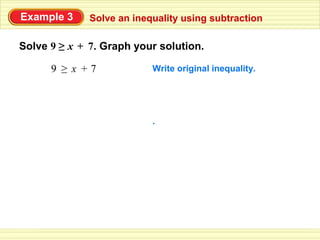
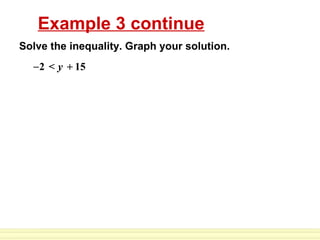
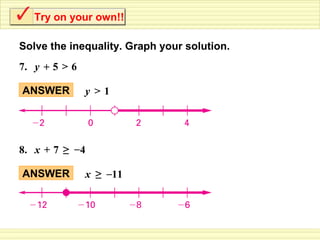
4.1 Solving Inequalities using
  Addition and Subtraction
Vocabulary:
• inequality: a mathematical sentence
  formed by placing an inequality symbol
  between two expressions.
• graph of an inequality: is the set of points
  that represent all solutions of the
  inequality.
• equivalent inequalities: inequalities that
  have the same solution.
Graphing:
• x>1       greater than        open dot

• x<1       less than           open dot

• x ≤1   less than or equal     solid dot

• x ≥ 1 greater than or equal
  solid dot
Example 1:Write and graph an inequality
         that describes the situation
1.)The speed limit on the road is 45 miles
  per hour.


2.) A child must be taller than 40 inches to
  get on Space Mountain.
Example 2     Write inequalities from graphs

Write an inequality represented by the graph.

a.


SOLUTION
The shading includes all numbers to the right of
(greater than) – 6.5.

ANSWER
An inequality represented by the graph is x > – 6.5.
Example 2    Write inequalities from graphs

Write an inequality represented by the graph.

b.


SOLUTION
The shading includes 4 and all numbers to the left of
(less than) 4.

ANSWER
An inequality represented by the graph is x ≤ 4.
Example 3     Solve an inequality using subtraction

Solve 9 ≥ x + 7. Graph your solution.

      9 ≥ x +7             Write original inequality.


                           .
Example 3 continue
Solve the inequality. Graph your solution.
  – 2 < y + 15
Try on your own!!

Solve the inequality. Graph your solution.
7. y + 5 > 6

ANSWER         y >1


8. x + 7 ≥ – 4

ANSWER         x ≥ –11

4.1 notes(8th grade)

  • 1.
    4.1 Solving Inequalitiesusing Addition and Subtraction
  • 2.
    Vocabulary: • inequality: amathematical sentence formed by placing an inequality symbol between two expressions. • graph of an inequality: is the set of points that represent all solutions of the inequality. • equivalent inequalities: inequalities that have the same solution.
  • 3.
    Graphing: • x>1 greater than open dot • x<1 less than open dot • x ≤1 less than or equal solid dot • x ≥ 1 greater than or equal solid dot
  • 4.
    Example 1:Write andgraph an inequality that describes the situation 1.)The speed limit on the road is 45 miles per hour. 2.) A child must be taller than 40 inches to get on Space Mountain.
  • 5.
    Example 2 Write inequalities from graphs Write an inequality represented by the graph. a. SOLUTION The shading includes all numbers to the right of (greater than) – 6.5. ANSWER An inequality represented by the graph is x > – 6.5.
  • 6.
    Example 2 Write inequalities from graphs Write an inequality represented by the graph. b. SOLUTION The shading includes 4 and all numbers to the left of (less than) 4. ANSWER An inequality represented by the graph is x ≤ 4.
  • 7.
    Example 3 Solve an inequality using subtraction Solve 9 ≥ x + 7. Graph your solution. 9 ≥ x +7 Write original inequality. .
  • 8.
    Example 3 continue Solvethe inequality. Graph your solution. – 2 < y + 15
  • 9.
    Try on yourown!! Solve the inequality. Graph your solution. 7. y + 5 > 6 ANSWER y >1 8. x + 7 ≥ – 4 ANSWER x ≥ –11