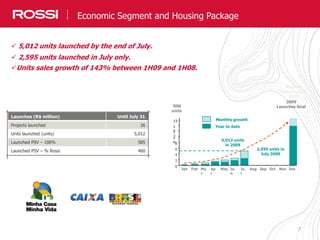
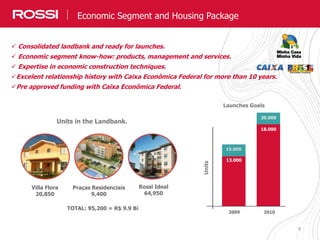
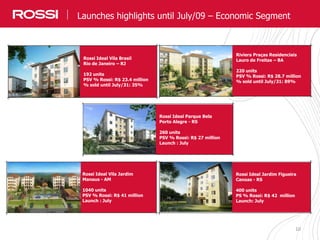
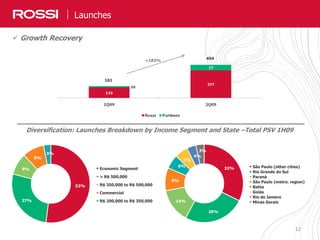
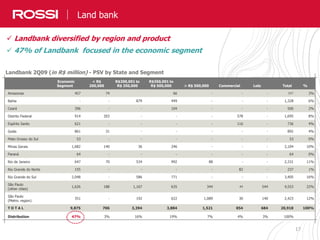
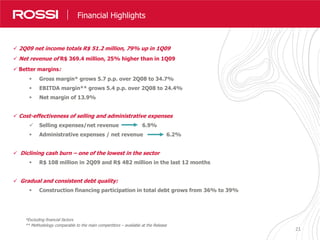
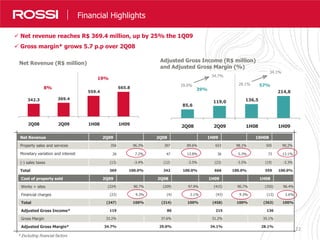
Investor Relations
2Q09 Results
22
Disclaimer
2Q09 Results Conference Call
This material is a presentation of general background information about Rossi Residencial S.A. (“Rossi”) as of the date of this presentation.
Information contained herein has been summarized and does not purport to be complete. This presentation shall not be considered an advice of
investment by potential investors. This presentation is strictly confidential and may not be disclosed to any third person. There are no
representations or warranties, express or implied, regarding the accuracy, fairness, or completeness of the information presented herein, which shall
not support any decision of investment.
This presentation contains statements and information that are forward-looking pursuant section 27A of the Securities Act of 1933, as amended, and
Section 21E of the Securities and Exchange Act of 1934. Such forward-looking statements and information are only predictions and cannot assure
Rossi’s future performance. Investors have been cautioned that any such forward-looking statements and information are subject to many risks and
uncertainties relating to the operations and business of Rossi and its subsidiaries. As a result of such risks and uncertainties, the actual results of
Rossi and its subsidiaries may be materially different from any future result expressed or implied in the forward-looking statement or information
contained herein.
Although Rossi believes that the expectations and assumptions reflected in the forward-looking statements and information are reasonable and have
been based on data currently available to its officers and directors, Rossi cannot guarantee future results or events. Rossi does not assume the
commitment of update any of the forward-looking statement of information.
Securities may not be offered or sold in the United States unlesss they are registered or exempt from registration under the Securities Act of 1933,
as amended. Any offering of securities to be made in the United States will be made by means of an offering memorandum that may be obtained
from the underwriters. Such offering memorandum will contain, or incorporate by reference, detailed information about Rossi and its subsidiaries,
their business and financial results, as well as its financial statements.
This material is for distribution only to person who (i) have professional experience in matters relating to investments falling within Article 19 (5) of
the Financial Services and Markets Act of 2000 (Financial Promotion) Order 2005 (as amended, the “Financial Promotion Order”), (ii) are persons
falling within Article 49 (2) (a) to (d) (“high net worth companies, unincorporated associations etc”) of the Financial Promotion Order, (iii) are
outside the United Kingdom, or (iv) are persons to whom an invitation or inducement to engage in investment activity (within the meaning of section
21 of the Financial Services and Markets Act 2000) in connection with the issue or sale of any securities may otherwise lawfully be communicated or
caused to be communicated (all such persons together being referred to as “relevant persons”). This material is directed only at relevant persons
and must not be acted on or relied on by persons who are not relevant persons. Any investment or investment activity to which this material relates
is available only to relevant persons and will be engaged in only with relevant persons.
This presentation does not constitute an offer, invitation or solicitation of an offer to subscribe to or purchase any securities.
Neither this presentation nor anything contained herein shall form the basis of any contract or commitment whatsoever.
33
2Q09 Results Conference Call
Agenda
Heitor Cantergiani
CEO
Main Highlights of the Period
Leonardo Diniz
Sales Officer
Launches and Sales
Cássio Audi
CFO and IRO
Financial Performance
4
2Q09
Highlights
5
2Q09 Main Highlights
Economic Segment Highlights
 Units sales growth of 143% between 1H09 and 1H08.
 5,012 units launched by the end of July, 2,595 of which in July only.
 Economic segment landbank with 95,000 units.
 54% of the PSV launched in 1H09 has been sold.
Financial Highlights
 Net Income grows 79% in comparison to 1Q09, and reaches R$ 51.2 million.
 Margin increase:
 Gross margin* stable at 34.7% (+ 5.7 p.p. vs 2Q08),
 Ebitda margin** of 24.4% (+ 5.4 p.p. vs 2Q08),
 Net margin of 13.9%.
 Increased efficiency of selling and administrative expenses
Operating Highlights
 Continued and consistent SOS growth since October 2008.
 Recovery of commercial, and medium and high income segments (consolidated sales growth of
65% on 1Q09).
 Net reduction of R$ 167 million in inventories at market value in 1H09
* Excluding financial factors
** Methodology comparable to the maisn competitors – detailed at the Release
6
Economic Segment
and
Housing Package
7
Real Estate Market: Industry and Company Overview
 5,012 units launched by the end of July.
 2,595 units launched in July only.
Units sales growth of 143% between 1H09 and 1H08.
Launches (R$ million) Until July 31
Projects launched 26
Units launched (units) 5,012
Launched PSV – 100% 585
Launched PSV – % Rossi 460
Meta de
Lançamentos
2009
Economic Segment and Housing Package
0
2
4
6
8
1
0
1
2
1
4
Jan Feb Ma
r
Ap
r
May Ju
n
Ju
l
Aug Sep Oct Nov Dec
‘000
units
2,595 units in
July 2009
5,012 units
in 2009
2009
Launches Goal
Monthly growth
Year to date
15
8
Standerized sales and
marketing policy.
Rossi Ideal Sales Channel.
8
Real Estate Market: Industry and Company Overview
Relationship with CEF
Central management
structure and distributed
operation.
Project Development: Villa
Flora, Praças Residenciais and
Rossi Ideal.
Projects approval
Standartized process: cost reduction and
higher speed.
Aluminum plaques for the production of
the monolitic structure.
Operating Structure
NEWSTRUCTURE
Exclusive Projects and
Production for the
Economic Segment
Engineering
Renato Diniz
Economic Segment
Rodrigo Martins
Marketing and
Sales
Financial
Development
and Projects
Centrilized production and
distribution of prefabricated,
atending several construction sites.
Economic Segment and Housing Package
9
Real Estate Market: Industry and Company Overview
15.000
20.000
13.000
18.000
2009 2010
Launches Goals
Villa Flora
20,850
Praças Residenciais
9,400
Rossi Ideal
64,950
TOTAL: 95,200 = R$ 9.9 Bi
Units in the Landbank.
Units
Economic Segment and Housing Package
 Consolidated landbank and ready for launches.
 Economic segment know-how: products, management and services.
 Expertise in economic construction techniques.
Excelent relationship history with Caixa Econômica Federal for more than 10 years.
Pre approved funding with Caixa Econômica Federal.
10
Real Estate Market: Industry and Company OverviewLaunches highlights until July/09 – Economic Segment
Riviera Praças Residenciais
Lauro de Freitas – BA
220 units
PSV % Rossi: R$ 28.7 million
% sold until July/31: 89%
Rossi Ideal Vila Brasil
Rio de Janeiro – RJ
192 units
PSV % Rossi: R$ 23.4 million
% sold until July/31: 35%
Rossi Ideal Vila Jardim
Manaus - AM
1040 units
PSV % Rossi: R$ 41 million
Launch : July
Rossi Ideal Jardim Figueira
Canoas - RS
400 units
PS % Rossi: R$ 42 million
Launch: July
Rossi Ideal Parque Bela
Porto Alegre - RS
260 units
PSV % Rossi: R$ 27 million
Launch : July
11
Launches and
Sales
12
Launches
Diversification: Launches Breakdown by Income Segment and State –Total PSV 1H09
12
 Growth Recovery
161
454
+183%
52%
27%
9%
9%
3%
Economic Segment
> R$ 500,000
R$ 350,000 to R$ 500,000
Commercial
R$ 200,000 to R$ 350,000
32%
26%
14%
9%
6%
5%
4%
3%
São Paulo (other cities)
Rio Grande do Sul
Paraná
São Paulo (metro. region)
Bahia
Goiás
Rio de Janeiro
Minas Gerais
13
Contracted Sales
Diversification: Sales Breakdown by Income Segment and by State – 1H09
 Growth recovery
38%
21%
16%
12%
10%
3%
Economic Segment
> R$ 500,000
R$ 350,000 to R$ 500,000
R$ 200,000 to R$ 350,000
Commercial
< R$ 200,000
25%
22%
16%
9%
8%
7%
5%
3%
2%
1%
São Paulo (other cities)
São Paulo (metro. region)
Rio Grande do Sul
Paraná
Rio de Janeiro
Bahia
Minas Gerais
Espírito Santo
Goiás
Pernambuco
Ceará
342
506+48%
14
In addition to the strong
performance of the
economic segment, sales
from our other segments
grew by 65% in quarter-on-
quarter terms.
Sales R$ million (% Rossi) 2Q09 1Q09 Var.
Until R$ 200,000 11 7 63%
R$ 200,000 to R$ 350,000 58 30 92%
R$ 350,000 to R$ 500,000 52 38 38%
Above R$ 500,000 92 45 105%
Commercial 50 34 46%
Contracted Sales
+65%
Sales in units 1H09 1H08 Var.
Economic Segment 2,360 973 143%
Economic Segment: 143%
sales growth in
comparison to 1H082360
973
1H08 1H09
143%
15
Nossos Resultados em Números
Sales over supply (SOS) - % Rossi (R$ million) 2Q09 1Q09 2Q09
Initial inventory 1,630 1,770 1,472
Launches 377 143 573
Initial inventory + Launches 2,007 1,913 2,045
Sales in the period 404 283 276
SOS Period 20.1% 14.8% 13.5%
Final inventory in the period 1,603 1,630 1,770
Time for key delivery Ready < 6 months 7 to 12 months
13 to 24
months
> 25
months
Total
Economic Segment 1.6 40.4 49.4 203.3 11.5 306.3
Until R$ 200,000 0.7 1.9 1.2 29.8 - 33.6
From R$ 200,100 to R$ 350,000 17.5 22.2 81.9 136.68 - 258.4
From R$ 350,100 to R$ 500,000 2.8 18.2 73.1 82.4 25.7 202.2
Above R$ 500,100 2.4 18.9 2.6 140.1 297.7 531.9
Commercial 0.7 0.1 2.2 27.3 240.2 270.4
Total 25.7 101.7 280.4 619.7 575.1 1,602.7
2% 6% 17% 39% 36%
 Net reduction of R$ 167 million in inventories in 1H09
 Continued and consistent SOS growth since October 2008
 Only 2% of inventories of ready units: no price pressure
VSO e Estoques
16
Expertise Rossi e Diferenciais Competitivos
Acquisition Method
Expertise Rossi e Diferenciais CompetitivosLandbank
11.8 11.3 13.4 13.8 13.7
4.5 6.0
7.0 6.9 7.2
0
5
10
15
20
25
2Q08 3Q08 4Q08 1Q09 2Q09
Rossi Partners
Landbank (R$ billion)
38%
25%
37%
Units Swap
Financial Swap
Cash
143 sites and 61 cities, not concentrated.
13,257 million m2 buildable area
122,000 units for future launches
 R$ 20.9 billion PSV in landbank; 75% acquired through swaps
Potential PSV (100%): R$ 20.9 billion
% Rossi: R$ 13.7 billion
Land bank PSV in R$ million
2Q09
Total
Total Rossi
20,918 13,786
Breakdown
Launches PSV
Final 1Q09
Changes
Final 2Q09 20,918 13,657
20,677 13,786
(454) (377)
695 249
17
Expertise Rossi e Diferenciais Competitivos
Landbank 2Q09 (in R$ million) - PSV by State and Segment
Estado
Economic
Segment
< R$
200,000
R$200,001 to
R$ 350,000
R$350,001 to
R$ 500,000 > R$ 500,000 Commercial Lots Total %
Amazonas 457 74 66 - - - 597 3%
Bahia - - 879 449 - - - 1,328 6%
Ceará 396 - - 104 - - - 500 2%
Distrito Federal 914 203 - - - 578 - 1,695 8%
Espírito Santo 621 - - - - 116 - 736 4%
Goiás 861 31 - - - - - 892 4%
Mato Grosso do Sul 53 - - - - - - 53 0%
Minas Gerais 1,682 140 36 246 - - - 2,104 10%
Paraná 64 - - - - - - 64 0%
Rio de Janeiro 647 70 534 992 88 - - 2,331 11%
Rio Grande do Norte 155 - - - - 82 - 237 1%
Rio Grande do Sul 2,048 - 586 771 - - - 3,405 16%
São Paulo
(other cities)
1,626 188 1,167 635 344 49 544 4,553 22%
São Paulo
(Metro. region)
351 - 192 622 1,089 30 140 2,423 12%
T O T A L 9,875 706 3,394 3,884 1,521 854 684 20,918 100%
Distribution 47% 3% 16% 19% 7% 4% 3% 100%
Land bank
 Landbank diversified by region and product
 47% of Landbank focused in the economic segment
1818
Rossi Vendas
Rossi Vendas
Number of Brokers 240
São Paulo 90
Porto Alegre 55
Rio de Janeiro 50
Campinas 45
Contracted Sales (100%) totaled R$ 156 million
Responsible for 31% of total Contracted Sales in 2Q09
Present in São Paulo, Rio de Janeiro, Porto Alegre and Campinas
Expected to open new regional offices in Vitória, Fortaleza, Goiânia, Brasília, Curitiba and Belo
Horizonte
19
Real Estate Market: Industry and Company OverviewLaunches Highlights – Mid and High end Segments
Rossi Parque Ibirapuera – Phase 1, 2 and 3
Porto Alegre – RS
190 units
PSV % Rossi: R$ 127.7 million
% sold until July/31: 55%
Reserva Botanique
Campinas – SP
46 units
PSV % Rossi: R$ 15.2 million
% sold until July/31: 91%
20
20
Financial
Highlights
2121
Destaques Resultados
 2Q09 net income totals R$ 51.2 million, 79% up in 1Q09
 Net revenue of R$ 369.4 million, 25% higher than in 1Q09
 Better margins:
 Gross margin* grows 5.7 p.p. over 2Q08 to 34.7%
 EBITDA margin** grows 5.4 p.p. over 2Q08 to 24.4%
 Net margin of 13.9%
 Cost-effectiveness of selling and administrative expenses
 Selling expenses/net revenue 6.9%
 Administrative expenses / net revenue 6.2%
 Diclining cash burn – one of the lowest in the sector
 R$ 108 million in 2Q09 and R$ 482 million in the last 12 months
 Gradual and consistent debt quality:
 Construction financing participation in total debt grows from 36% to 39%
Financial Highlights
*Excluding financial factors
** Methodology comparable to the main compertitors – available at the Release
22
Nossos Resultados em NúmerosFinancial Highlights
342.3 369.4
559.4
665.8
2Q08 2Q09 1H08 1H09
Net Revenue (R$ million)
8%
19%
85,6
119,0 136,5
214,8
2Q08 2Q09 1H08 1H09
39%
57%29.0%
34.7%
28.1%
34.1%
Adjusted Gross Income (R$ million)
and Adjusted Gross Margin (%)
Net Revenue 2Q09 2Q08 1H09 1SH08
Property sales and services 356 96.3% 307 89.6% 653 98.1% 505 90.2%
Monetary variation and interest 26 7.2% 47 13.8% 36 5.3% 73 13.1%
(-) sales taxes (13) -3.4% (12) -3.5% (23) -3.5% (19) -3.3%
Total 369 100.0% 342 100.0% 666 100.0% 559 100.0%
Cost of property sold 2Q09 2Q08 1H09 1H08
Works + sites (224) 90.7% (209) 97.9% (415) 90.7% (350) 96.4%
Financial charges (23) 9.3% (4) 2.1% (43) 9.3% (13) 3.6%
Total (247) 100% (214) 100% (458) 100% (363) 100%
Adjusted Gross Income* 119 86 215 136
Gross Margin 33.2% 37.6% 31.2% 35.1%
Adjusted Gross Margin* 34.7% 29.0% 34.1% 28.1%
* Excluding financial factors
 Net revenue reaches R$ 369.4 million, up by 25% the 1Q09
 Gross margin* grows 5.7 p.p over 2Q08
23
Nossos Resultados em NúmerosFinancial Highlights
Net Income (R$ million) and
Net Margin (%)
50.9 51.2
66.8
79.8
2Q08 2Q09 1H08 1H09
1%
19%
14.9% 13.9% 11.9%
12.0%
EBITDA (R$ million) and
EBITDA margin (%)
65.0
90.0 93.3
141.8
2Q08 2Q09 1H08 1H09
38%
52%
19.0%
24.4%
16.7%
21.3%
EBITDA – New Methodology 2Q09 2Q08 Var. 1H09 1H08 Var.
Net income 51 51 1% 80 67 19%
(+/-) Financial Expenses (Revenues), net 2 7 -78% (2) 7 -126%
(+) Deferred income tax and social contribution 10 1 n.m. 11 3 261%
(+) Depreciation and amortization 5 2 192% 10 3 192%
(+) Interest 23 4 418% 43 13 224%
(+) Stock option plan 0 - - 0 - -
ADJUSTED EBITDA 90 65 38% 142 93 52%
ADJUSTED EBITDA Margin 24.4% 19.0% 5.4 p.p. 21.3% 16.7% 4.6 p.p.
 Net income of R$ 51.2 million, 79% up on 1Q09
 EBITDA margin grows 5.4 p.p. (vs 2Q08)
24
Nossos Resultados em Números
Selling Expenses Administrative Expenses
 Increased cost-effectiveness of selling and administrative expenses
4%
Financial Highlights
16%
4%
1Q09 2Q09 4Q08 1Q09 2Q09
26
25
29
24
23
Operating expenses (R$ million) 2Q09 2Q08 Var . 1H09 1H08 Var.
Administrative 23 27 -14% 47 49 -5%
Selling 25 35 -28% 52 57 -9%
Administrative / Net Revenue 6.2% 7.8% -1.6 p.p. 7.0% 8.8% -1.8 p.p.
Selling / Net Revenue 6.9% 10.2% -3.4 p.p. 7.7% 10.1% -2.4 p.p.
G&A / Net Revenue 13.0% 18.1% -5.1 p.p. 14.9% 18.9% -4.1 p.p.
R$million
R$million
25
Nossos Resultados em NúmerosGradual and consistent improvement in debt quality
 Construction financing share in total debt
grew from 36% to 39%
Debt jun/09 mar/09 Var.
Debt – Short Term 211.6 121.9 74%
Loans- working capital 11.1 10.8 3%
Construction financing 194.1 104.6 86%
Debentures 6.4 6.4 0%
Debt – Long Term 787.9 803.5 -2%
Loans- working capital 237.1 236.2 0%
Construction financing 200.2 224. 5 -11%
Debentures 350.6 342.9 2%
Total Debt 999.5 925.4 8%
Cash Position
Financial investments – short term 177.7 211.8 -16%
Financial investments – long term 1.1 1.1 0%
Total cash position 178.8 212.9 -16%
Net Debt 820.7 712.5 15%
Net Debt/ Shareholders’ Equity 62.26% 56.24%
(Net Debt – SFH )/Shareholders’ Equity 32.35% 30.26%
Debt Rule Rossi 2Q09
Net debt+ Property payable –
Unearned revenue
Shareholders’ Equity
≤ 0.70 158.3
1,319
0.12
Recebivables +Property tradable
Net debt+ Property payable +
Prepaid expenses
≥ 1.5 or < 0 4,349
2,089
2.08
EBIT
Financial Expenses (Revenues), net
≥ 1.5 or < 0 108.6
(1.8)
(0.60)
Amortization Schedule
Total Debt: R$ 999.5 million
26
NossosResultados em Números
 Declining and is already one of the lowest in the sector. In the last 12
months the company used R$ 482 million, and in 2Q09, only R$ 108 million
Cash Burn
Cash Burn (R$ million) Variation in Net Debt Capitalization Cash burn
2Q09 108 108
1Q09 138 138
4Q08 -31 150 119
3Q08 117 118
Total 332 150 482
Market value RSID3
Number of shares 157,703,628
Number of shares issued 34,482,760
Total shares after capital increase 192,186,388
Closing price 08/12/2009 R$ 11.30
Market value R$ 2,172
27
NossosResultados em NúmerosShare Performance
RSID3 - 2009
0,00
50,00
100,00
150,00
200,00
250,00
300,00
350,00
2/jan/09 2/fev/09 2/mar/09 2/abr/09 2/mai/09 2/jun/09 2/jul/09 2/ago/09
RSID3 IBOV IMOB
Fonte: Bloomberg
R$ / ação
50
70
90
110
130
150
170
190
210
230
2-Jan-09 17-Jan-09 1-Feb-09 16-Feb-09 3-Mar-09 18-Mar-09 2-Apr-09 17-Apr-09 2-May-09
RSID3 IBOV IMOB
28
NossosResultados em Números
Institution Analyst Contact
BB Investimentos Antonio Emilio Ruiz antonioemilio@bb.com.br
Banco Fator Eduardo Silveira esilveira@bancofator.com.br
Barclays
Guilherme Vilazante
Edoardo Biancheri
guilherme.vilazante@barcap.com
edoardo.biancheri@barcap.com
Citigroup Cecília del Castillo cdelcastillo@accival.com
Credit Suisse
Marcelo Telles
Pedro Barbosa
marcelo.telles@credit-suisse.com
Pedro.barbosa@credit-suisse.com
Goldman Sachs
Jason B. Mollin
Leonardo Zambolín
jason.molin@gs.com
leonardo.zambolin@gs.com
Itaú
David Lawant
Cecília Viriato
david.lawant@itau.com.br
Cecilia.medeiros@itau.com.br
JP Morgan
Adrian Huerta
Marcelo Motta
adrian.huerta@jpmorgan.com
marcelo.g.motta@jpmorgan.com
Merrill Lynch Carlos Peryrelongue carlos_peryrelongue@ml.com
Raymond James Conrado Vegner conrado.vegner@raymondjames.com
Santander
Marcello Milman
Fabiola Gama
mmilman@santander.com.br
fpgama@santander.com.br
UBS
Gordon Lee
Rodrigo Monteiro
gordon.lee@ubs.com
rodrigo.monteiro@ubs.com
Analyst Coverage
Analyst Coverage
2929
Cássio Elias Audi
CFO and Investor Relations Officer
Maria Claudia Biolchini
Investor Relations Manager
mariabiolchini@rossiresidencial.com.br
Tel. (55 11) 3759-7516
IR Team
IR Contacts
30
Q&A

2Q09 Results Presentation

  • 1.
  • 2.
    22 Disclaimer 2Q09 Results ConferenceCall This material is a presentation of general background information about Rossi Residencial S.A. (“Rossi”) as of the date of this presentation. Information contained herein has been summarized and does not purport to be complete. This presentation shall not be considered an advice of investment by potential investors. This presentation is strictly confidential and may not be disclosed to any third person. There are no representations or warranties, express or implied, regarding the accuracy, fairness, or completeness of the information presented herein, which shall not support any decision of investment. This presentation contains statements and information that are forward-looking pursuant section 27A of the Securities Act of 1933, as amended, and Section 21E of the Securities and Exchange Act of 1934. Such forward-looking statements and information are only predictions and cannot assure Rossi’s future performance. Investors have been cautioned that any such forward-looking statements and information are subject to many risks and uncertainties relating to the operations and business of Rossi and its subsidiaries. As a result of such risks and uncertainties, the actual results of Rossi and its subsidiaries may be materially different from any future result expressed or implied in the forward-looking statement or information contained herein. Although Rossi believes that the expectations and assumptions reflected in the forward-looking statements and information are reasonable and have been based on data currently available to its officers and directors, Rossi cannot guarantee future results or events. Rossi does not assume the commitment of update any of the forward-looking statement of information. Securities may not be offered or sold in the United States unlesss they are registered or exempt from registration under the Securities Act of 1933, as amended. Any offering of securities to be made in the United States will be made by means of an offering memorandum that may be obtained from the underwriters. Such offering memorandum will contain, or incorporate by reference, detailed information about Rossi and its subsidiaries, their business and financial results, as well as its financial statements. This material is for distribution only to person who (i) have professional experience in matters relating to investments falling within Article 19 (5) of the Financial Services and Markets Act of 2000 (Financial Promotion) Order 2005 (as amended, the “Financial Promotion Order”), (ii) are persons falling within Article 49 (2) (a) to (d) (“high net worth companies, unincorporated associations etc”) of the Financial Promotion Order, (iii) are outside the United Kingdom, or (iv) are persons to whom an invitation or inducement to engage in investment activity (within the meaning of section 21 of the Financial Services and Markets Act 2000) in connection with the issue or sale of any securities may otherwise lawfully be communicated or caused to be communicated (all such persons together being referred to as “relevant persons”). This material is directed only at relevant persons and must not be acted on or relied on by persons who are not relevant persons. Any investment or investment activity to which this material relates is available only to relevant persons and will be engaged in only with relevant persons. This presentation does not constitute an offer, invitation or solicitation of an offer to subscribe to or purchase any securities. Neither this presentation nor anything contained herein shall form the basis of any contract or commitment whatsoever.
  • 3.
    33 2Q09 Results ConferenceCall Agenda Heitor Cantergiani CEO Main Highlights of the Period Leonardo Diniz Sales Officer Launches and Sales Cássio Audi CFO and IRO Financial Performance
  • 4.
  • 5.
    5 2Q09 Main Highlights EconomicSegment Highlights  Units sales growth of 143% between 1H09 and 1H08.  5,012 units launched by the end of July, 2,595 of which in July only.  Economic segment landbank with 95,000 units.  54% of the PSV launched in 1H09 has been sold. Financial Highlights  Net Income grows 79% in comparison to 1Q09, and reaches R$ 51.2 million.  Margin increase:  Gross margin* stable at 34.7% (+ 5.7 p.p. vs 2Q08),  Ebitda margin** of 24.4% (+ 5.4 p.p. vs 2Q08),  Net margin of 13.9%.  Increased efficiency of selling and administrative expenses Operating Highlights  Continued and consistent SOS growth since October 2008.  Recovery of commercial, and medium and high income segments (consolidated sales growth of 65% on 1Q09).  Net reduction of R$ 167 million in inventories at market value in 1H09 * Excluding financial factors ** Methodology comparable to the maisn competitors – detailed at the Release
  • 6.
  • 7.
    7 Real Estate Market:Industry and Company Overview  5,012 units launched by the end of July.  2,595 units launched in July only. Units sales growth of 143% between 1H09 and 1H08. Launches (R$ million) Until July 31 Projects launched 26 Units launched (units) 5,012 Launched PSV – 100% 585 Launched PSV – % Rossi 460 Meta de Lançamentos 2009 Economic Segment and Housing Package 0 2 4 6 8 1 0 1 2 1 4 Jan Feb Ma r Ap r May Ju n Ju l Aug Sep Oct Nov Dec ‘000 units 2,595 units in July 2009 5,012 units in 2009 2009 Launches Goal Monthly growth Year to date 15
  • 8.
    8 Standerized sales and marketingpolicy. Rossi Ideal Sales Channel. 8 Real Estate Market: Industry and Company Overview Relationship with CEF Central management structure and distributed operation. Project Development: Villa Flora, Praças Residenciais and Rossi Ideal. Projects approval Standartized process: cost reduction and higher speed. Aluminum plaques for the production of the monolitic structure. Operating Structure NEWSTRUCTURE Exclusive Projects and Production for the Economic Segment Engineering Renato Diniz Economic Segment Rodrigo Martins Marketing and Sales Financial Development and Projects Centrilized production and distribution of prefabricated, atending several construction sites. Economic Segment and Housing Package
  • 9.
    9 Real Estate Market:Industry and Company Overview 15.000 20.000 13.000 18.000 2009 2010 Launches Goals Villa Flora 20,850 Praças Residenciais 9,400 Rossi Ideal 64,950 TOTAL: 95,200 = R$ 9.9 Bi Units in the Landbank. Units Economic Segment and Housing Package  Consolidated landbank and ready for launches.  Economic segment know-how: products, management and services.  Expertise in economic construction techniques. Excelent relationship history with Caixa Econômica Federal for more than 10 years. Pre approved funding with Caixa Econômica Federal.
  • 10.
    10 Real Estate Market:Industry and Company OverviewLaunches highlights until July/09 – Economic Segment Riviera Praças Residenciais Lauro de Freitas – BA 220 units PSV % Rossi: R$ 28.7 million % sold until July/31: 89% Rossi Ideal Vila Brasil Rio de Janeiro – RJ 192 units PSV % Rossi: R$ 23.4 million % sold until July/31: 35% Rossi Ideal Vila Jardim Manaus - AM 1040 units PSV % Rossi: R$ 41 million Launch : July Rossi Ideal Jardim Figueira Canoas - RS 400 units PS % Rossi: R$ 42 million Launch: July Rossi Ideal Parque Bela Porto Alegre - RS 260 units PSV % Rossi: R$ 27 million Launch : July
  • 11.
  • 12.
    12 Launches Diversification: Launches Breakdownby Income Segment and State –Total PSV 1H09 12  Growth Recovery 161 454 +183% 52% 27% 9% 9% 3% Economic Segment > R$ 500,000 R$ 350,000 to R$ 500,000 Commercial R$ 200,000 to R$ 350,000 32% 26% 14% 9% 6% 5% 4% 3% São Paulo (other cities) Rio Grande do Sul Paraná São Paulo (metro. region) Bahia Goiás Rio de Janeiro Minas Gerais
  • 13.
    13 Contracted Sales Diversification: SalesBreakdown by Income Segment and by State – 1H09  Growth recovery 38% 21% 16% 12% 10% 3% Economic Segment > R$ 500,000 R$ 350,000 to R$ 500,000 R$ 200,000 to R$ 350,000 Commercial < R$ 200,000 25% 22% 16% 9% 8% 7% 5% 3% 2% 1% São Paulo (other cities) São Paulo (metro. region) Rio Grande do Sul Paraná Rio de Janeiro Bahia Minas Gerais Espírito Santo Goiás Pernambuco Ceará 342 506+48%
  • 14.
    14 In addition tothe strong performance of the economic segment, sales from our other segments grew by 65% in quarter-on- quarter terms. Sales R$ million (% Rossi) 2Q09 1Q09 Var. Until R$ 200,000 11 7 63% R$ 200,000 to R$ 350,000 58 30 92% R$ 350,000 to R$ 500,000 52 38 38% Above R$ 500,000 92 45 105% Commercial 50 34 46% Contracted Sales +65% Sales in units 1H09 1H08 Var. Economic Segment 2,360 973 143% Economic Segment: 143% sales growth in comparison to 1H082360 973 1H08 1H09 143%
  • 15.
    15 Nossos Resultados emNúmeros Sales over supply (SOS) - % Rossi (R$ million) 2Q09 1Q09 2Q09 Initial inventory 1,630 1,770 1,472 Launches 377 143 573 Initial inventory + Launches 2,007 1,913 2,045 Sales in the period 404 283 276 SOS Period 20.1% 14.8% 13.5% Final inventory in the period 1,603 1,630 1,770 Time for key delivery Ready < 6 months 7 to 12 months 13 to 24 months > 25 months Total Economic Segment 1.6 40.4 49.4 203.3 11.5 306.3 Until R$ 200,000 0.7 1.9 1.2 29.8 - 33.6 From R$ 200,100 to R$ 350,000 17.5 22.2 81.9 136.68 - 258.4 From R$ 350,100 to R$ 500,000 2.8 18.2 73.1 82.4 25.7 202.2 Above R$ 500,100 2.4 18.9 2.6 140.1 297.7 531.9 Commercial 0.7 0.1 2.2 27.3 240.2 270.4 Total 25.7 101.7 280.4 619.7 575.1 1,602.7 2% 6% 17% 39% 36%  Net reduction of R$ 167 million in inventories in 1H09  Continued and consistent SOS growth since October 2008  Only 2% of inventories of ready units: no price pressure VSO e Estoques
  • 16.
    16 Expertise Rossi eDiferenciais Competitivos Acquisition Method Expertise Rossi e Diferenciais CompetitivosLandbank 11.8 11.3 13.4 13.8 13.7 4.5 6.0 7.0 6.9 7.2 0 5 10 15 20 25 2Q08 3Q08 4Q08 1Q09 2Q09 Rossi Partners Landbank (R$ billion) 38% 25% 37% Units Swap Financial Swap Cash 143 sites and 61 cities, not concentrated. 13,257 million m2 buildable area 122,000 units for future launches  R$ 20.9 billion PSV in landbank; 75% acquired through swaps Potential PSV (100%): R$ 20.9 billion % Rossi: R$ 13.7 billion Land bank PSV in R$ million 2Q09 Total Total Rossi 20,918 13,786 Breakdown Launches PSV Final 1Q09 Changes Final 2Q09 20,918 13,657 20,677 13,786 (454) (377) 695 249
  • 17.
    17 Expertise Rossi eDiferenciais Competitivos Landbank 2Q09 (in R$ million) - PSV by State and Segment Estado Economic Segment < R$ 200,000 R$200,001 to R$ 350,000 R$350,001 to R$ 500,000 > R$ 500,000 Commercial Lots Total % Amazonas 457 74 66 - - - 597 3% Bahia - - 879 449 - - - 1,328 6% Ceará 396 - - 104 - - - 500 2% Distrito Federal 914 203 - - - 578 - 1,695 8% Espírito Santo 621 - - - - 116 - 736 4% Goiás 861 31 - - - - - 892 4% Mato Grosso do Sul 53 - - - - - - 53 0% Minas Gerais 1,682 140 36 246 - - - 2,104 10% Paraná 64 - - - - - - 64 0% Rio de Janeiro 647 70 534 992 88 - - 2,331 11% Rio Grande do Norte 155 - - - - 82 - 237 1% Rio Grande do Sul 2,048 - 586 771 - - - 3,405 16% São Paulo (other cities) 1,626 188 1,167 635 344 49 544 4,553 22% São Paulo (Metro. region) 351 - 192 622 1,089 30 140 2,423 12% T O T A L 9,875 706 3,394 3,884 1,521 854 684 20,918 100% Distribution 47% 3% 16% 19% 7% 4% 3% 100% Land bank  Landbank diversified by region and product  47% of Landbank focused in the economic segment
  • 18.
    1818 Rossi Vendas Rossi Vendas Numberof Brokers 240 São Paulo 90 Porto Alegre 55 Rio de Janeiro 50 Campinas 45 Contracted Sales (100%) totaled R$ 156 million Responsible for 31% of total Contracted Sales in 2Q09 Present in São Paulo, Rio de Janeiro, Porto Alegre and Campinas Expected to open new regional offices in Vitória, Fortaleza, Goiânia, Brasília, Curitiba and Belo Horizonte
  • 19.
    19 Real Estate Market:Industry and Company OverviewLaunches Highlights – Mid and High end Segments Rossi Parque Ibirapuera – Phase 1, 2 and 3 Porto Alegre – RS 190 units PSV % Rossi: R$ 127.7 million % sold until July/31: 55% Reserva Botanique Campinas – SP 46 units PSV % Rossi: R$ 15.2 million % sold until July/31: 91%
  • 20.
  • 21.
    2121 Destaques Resultados  2Q09net income totals R$ 51.2 million, 79% up in 1Q09  Net revenue of R$ 369.4 million, 25% higher than in 1Q09  Better margins:  Gross margin* grows 5.7 p.p. over 2Q08 to 34.7%  EBITDA margin** grows 5.4 p.p. over 2Q08 to 24.4%  Net margin of 13.9%  Cost-effectiveness of selling and administrative expenses  Selling expenses/net revenue 6.9%  Administrative expenses / net revenue 6.2%  Diclining cash burn – one of the lowest in the sector  R$ 108 million in 2Q09 and R$ 482 million in the last 12 months  Gradual and consistent debt quality:  Construction financing participation in total debt grows from 36% to 39% Financial Highlights *Excluding financial factors ** Methodology comparable to the main compertitors – available at the Release
  • 22.
    22 Nossos Resultados emNúmerosFinancial Highlights 342.3 369.4 559.4 665.8 2Q08 2Q09 1H08 1H09 Net Revenue (R$ million) 8% 19% 85,6 119,0 136,5 214,8 2Q08 2Q09 1H08 1H09 39% 57%29.0% 34.7% 28.1% 34.1% Adjusted Gross Income (R$ million) and Adjusted Gross Margin (%) Net Revenue 2Q09 2Q08 1H09 1SH08 Property sales and services 356 96.3% 307 89.6% 653 98.1% 505 90.2% Monetary variation and interest 26 7.2% 47 13.8% 36 5.3% 73 13.1% (-) sales taxes (13) -3.4% (12) -3.5% (23) -3.5% (19) -3.3% Total 369 100.0% 342 100.0% 666 100.0% 559 100.0% Cost of property sold 2Q09 2Q08 1H09 1H08 Works + sites (224) 90.7% (209) 97.9% (415) 90.7% (350) 96.4% Financial charges (23) 9.3% (4) 2.1% (43) 9.3% (13) 3.6% Total (247) 100% (214) 100% (458) 100% (363) 100% Adjusted Gross Income* 119 86 215 136 Gross Margin 33.2% 37.6% 31.2% 35.1% Adjusted Gross Margin* 34.7% 29.0% 34.1% 28.1% * Excluding financial factors  Net revenue reaches R$ 369.4 million, up by 25% the 1Q09  Gross margin* grows 5.7 p.p over 2Q08
  • 23.
    23 Nossos Resultados emNúmerosFinancial Highlights Net Income (R$ million) and Net Margin (%) 50.9 51.2 66.8 79.8 2Q08 2Q09 1H08 1H09 1% 19% 14.9% 13.9% 11.9% 12.0% EBITDA (R$ million) and EBITDA margin (%) 65.0 90.0 93.3 141.8 2Q08 2Q09 1H08 1H09 38% 52% 19.0% 24.4% 16.7% 21.3% EBITDA – New Methodology 2Q09 2Q08 Var. 1H09 1H08 Var. Net income 51 51 1% 80 67 19% (+/-) Financial Expenses (Revenues), net 2 7 -78% (2) 7 -126% (+) Deferred income tax and social contribution 10 1 n.m. 11 3 261% (+) Depreciation and amortization 5 2 192% 10 3 192% (+) Interest 23 4 418% 43 13 224% (+) Stock option plan 0 - - 0 - - ADJUSTED EBITDA 90 65 38% 142 93 52% ADJUSTED EBITDA Margin 24.4% 19.0% 5.4 p.p. 21.3% 16.7% 4.6 p.p.  Net income of R$ 51.2 million, 79% up on 1Q09  EBITDA margin grows 5.4 p.p. (vs 2Q08)
  • 24.
    24 Nossos Resultados emNúmeros Selling Expenses Administrative Expenses  Increased cost-effectiveness of selling and administrative expenses 4% Financial Highlights 16% 4% 1Q09 2Q09 4Q08 1Q09 2Q09 26 25 29 24 23 Operating expenses (R$ million) 2Q09 2Q08 Var . 1H09 1H08 Var. Administrative 23 27 -14% 47 49 -5% Selling 25 35 -28% 52 57 -9% Administrative / Net Revenue 6.2% 7.8% -1.6 p.p. 7.0% 8.8% -1.8 p.p. Selling / Net Revenue 6.9% 10.2% -3.4 p.p. 7.7% 10.1% -2.4 p.p. G&A / Net Revenue 13.0% 18.1% -5.1 p.p. 14.9% 18.9% -4.1 p.p. R$million R$million
  • 25.
    25 Nossos Resultados emNúmerosGradual and consistent improvement in debt quality  Construction financing share in total debt grew from 36% to 39% Debt jun/09 mar/09 Var. Debt – Short Term 211.6 121.9 74% Loans- working capital 11.1 10.8 3% Construction financing 194.1 104.6 86% Debentures 6.4 6.4 0% Debt – Long Term 787.9 803.5 -2% Loans- working capital 237.1 236.2 0% Construction financing 200.2 224. 5 -11% Debentures 350.6 342.9 2% Total Debt 999.5 925.4 8% Cash Position Financial investments – short term 177.7 211.8 -16% Financial investments – long term 1.1 1.1 0% Total cash position 178.8 212.9 -16% Net Debt 820.7 712.5 15% Net Debt/ Shareholders’ Equity 62.26% 56.24% (Net Debt – SFH )/Shareholders’ Equity 32.35% 30.26% Debt Rule Rossi 2Q09 Net debt+ Property payable – Unearned revenue Shareholders’ Equity ≤ 0.70 158.3 1,319 0.12 Recebivables +Property tradable Net debt+ Property payable + Prepaid expenses ≥ 1.5 or < 0 4,349 2,089 2.08 EBIT Financial Expenses (Revenues), net ≥ 1.5 or < 0 108.6 (1.8) (0.60) Amortization Schedule Total Debt: R$ 999.5 million
  • 26.
    26 NossosResultados em Números Declining and is already one of the lowest in the sector. In the last 12 months the company used R$ 482 million, and in 2Q09, only R$ 108 million Cash Burn Cash Burn (R$ million) Variation in Net Debt Capitalization Cash burn 2Q09 108 108 1Q09 138 138 4Q08 -31 150 119 3Q08 117 118 Total 332 150 482 Market value RSID3 Number of shares 157,703,628 Number of shares issued 34,482,760 Total shares after capital increase 192,186,388 Closing price 08/12/2009 R$ 11.30 Market value R$ 2,172
  • 27.
    27 NossosResultados em NúmerosSharePerformance RSID3 - 2009 0,00 50,00 100,00 150,00 200,00 250,00 300,00 350,00 2/jan/09 2/fev/09 2/mar/09 2/abr/09 2/mai/09 2/jun/09 2/jul/09 2/ago/09 RSID3 IBOV IMOB Fonte: Bloomberg R$ / ação 50 70 90 110 130 150 170 190 210 230 2-Jan-09 17-Jan-09 1-Feb-09 16-Feb-09 3-Mar-09 18-Mar-09 2-Apr-09 17-Apr-09 2-May-09 RSID3 IBOV IMOB
  • 28.
    28 NossosResultados em Números InstitutionAnalyst Contact BB Investimentos Antonio Emilio Ruiz antonioemilio@bb.com.br Banco Fator Eduardo Silveira esilveira@bancofator.com.br Barclays Guilherme Vilazante Edoardo Biancheri guilherme.vilazante@barcap.com edoardo.biancheri@barcap.com Citigroup Cecília del Castillo cdelcastillo@accival.com Credit Suisse Marcelo Telles Pedro Barbosa marcelo.telles@credit-suisse.com Pedro.barbosa@credit-suisse.com Goldman Sachs Jason B. Mollin Leonardo Zambolín jason.molin@gs.com leonardo.zambolin@gs.com Itaú David Lawant Cecília Viriato david.lawant@itau.com.br Cecilia.medeiros@itau.com.br JP Morgan Adrian Huerta Marcelo Motta adrian.huerta@jpmorgan.com marcelo.g.motta@jpmorgan.com Merrill Lynch Carlos Peryrelongue carlos_peryrelongue@ml.com Raymond James Conrado Vegner conrado.vegner@raymondjames.com Santander Marcello Milman Fabiola Gama mmilman@santander.com.br fpgama@santander.com.br UBS Gordon Lee Rodrigo Monteiro gordon.lee@ubs.com rodrigo.monteiro@ubs.com Analyst Coverage Analyst Coverage
  • 29.
    2929 Cássio Elias Audi CFOand Investor Relations Officer Maria Claudia Biolchini Investor Relations Manager mariabiolchini@rossiresidencial.com.br Tel. (55 11) 3759-7516 IR Team IR Contacts
  • 30.