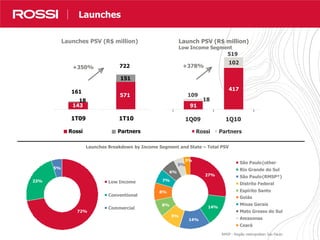
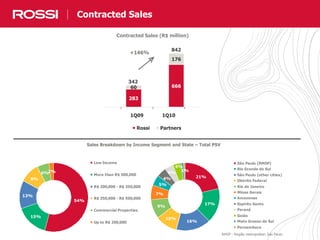
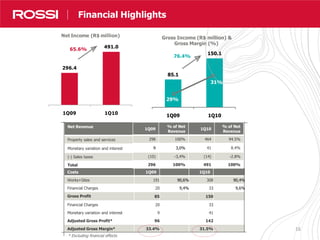
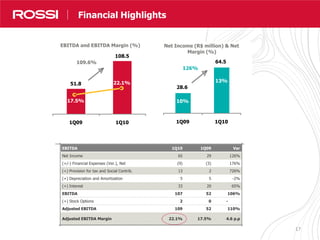
11
1Q10 Results
Villa Flora – Low Income Segment
222
Disclaimer
Results 1Q10
This material is a presentation of general background information about Rossi Residencial S.A. (“Rossi”) as of the date of this presentation.
Information contained herein has been summarized and does not purport to be complete. This presentation shall not be considered an advice of
investment by potential investors. This presentation is strictly confidential and may not be disclosed to any third person. There are no
representations or warranties, express or implied, regarding the accuracy, fairness, or completeness of the information presented herein, which shall
not support any decision of investment.
This presentation contains statements and information that are forward-looking pursuant section 27A of the Securities Act of 1933, as amended, and
Section 21E of the Securities and Exchange Act of 1934. Such forward-looking statements and information are only predictions and cannot assure
Rossi’s future performance. Investors have been cautioned that any such forward-looking statements and information are subject to many risks and
uncertainties relating to the operations and business of Rossi and its subsidiaries. As a result of such risks and uncertainties, the actual results of
Rossi and its subsidiaries may be materially different from any future result expressed or implied in the forward-looking statement or information
contained herein.
Although Rossi believes that the expectations and assumptions reflected in the forward-looking statements and information are reasonable and have
been based on data currently available to its officers and directors, Rossi cannot guarantee future results or events. Rossi does not assume the
commitment of update any of the forward-looking statement of information.
Securities may not be offered or sold in the United States unlesss they are registered or exempt from registration under the Securities Act of 1933,
as amended. Any offering of securities to be made in the United States will be made by means of an offering memorandum that may be obtained
from the underwriters. Such offering memorandum will contain, or incorporate by reference, detailed information about Rossi and its subsidiaries,
their business and financial results, as well as its financial statements.
This material is for distribution only to person who (i) have professional experience in matters relating to investments falling within Article 19 (5) of
the Financial Services and Markets Act of 2000 (Financial Promotion) Order 2005 (as amended, the “Financial Promotion Order”), (ii) are persons
falling within Article 49 (2) (a) to (d) (“high net worth companies, unincorporated associations etc”) of the Financial Promotion Order, (iii) are
outside the United Kingdom, or (iv) are persons to whom an invitation or inducement to engage in investment activity (within the meaning of section
21 of the Financial Services and Markets Act 2000) in connection with the issue or sale of any securities may otherwise lawfully be communicated or
caused to be communicated (all such persons together being referred to as “relevant persons”). This material is directed only at relevant persons
and must not be acted on or relied on by persons who are not relevant persons. Any investment or investment activity to which this material relates
is available only to relevant persons and will be engaged in only with relevant persons.
This presentation does not constitute an offer, invitation or solicitation of an offer to subscribe to or purchase any securities. Neither this
presentation nor anything contained herein shall form the basis of any contract or commitment whatsoever.
33
Heitor Cantergiani
CEO
Highlights
Leonardo Diniz
Sales Officer
Operating Performance
Cássio Audi
CFO and IRO
Financial Performance
Agenda
44
Operating Highlights
 Total Launches of R$ 722 million (R$ 571 million – Rossi’s share), up 350% compared to 1Q09
 SOS ratio of 25% 5th consecutive quarter of improvement
 Contracted sales of R$ 842 million, up 146% compared to 1Q09
 Contracted sales Rossi’s share of R$ 666 million, up 136% compared to 1Q09
Low Income Segment
 Launched PSV (Rossi’s share) of R$ 417 million, up 358% compared to 1Q09, 73% of total launches
 SOS reaches record of 37.4%
 Sales over launches (Rossi’s share) in 1Q10 achieved 51% of PSV ( Rossi’s share)
 Total sales of R$ 456.7 million (R$ 368.3 million Rossi’s share)
Financial Performance
 Increase of 126% in Net Income (vs. 1Q09), reaching R$ 64 million
 Net Margin of 13.1% in 1Q10 (growth of 3.5 p.p vs. 1Q09)
 EBITDA reaches R$ 109 million, up 110% compared to 1Q09
 EBITDA Margin reaches 22.1% vs. 17.5% in 1Q09 (growth of 4.6 p.p )
 Adjusted ROE annualized reaches 16,2% in the 1Q10
(¹)Adjusted annualized ROE excludes follow-on and includes the quarter’s cash burn.
1Q10 Highlights
555
Launches and
Sales
Villa Flora – Low Income Segment
6
27%
14%
14%
9%
8%
8%
7%
6%
5%
3%
São Paulo(other cities)
Rio Grande do Sul
São Paulo(RMSP*)
Distrito Federal
Espírito Santo
Goiás
Minas Gerais
Mato Grosso do Sul
Amazonas
Ceará
72%
23%
5%
Low Income
Conventional
Commercial
Nossos Resultados em Números
Launches Breakdown by Income Segment and State – Total PSV
Launches
Launches PSV (R$ million)
143
571
18
151
1T09 1T10
Rossi Partners
722
161
91
417
18
102
1Q09 1Q10
Launch PSV (R$ million)
Low Income Segment
Rossi Partners
+378%
109
519
+350%
RMSP - Região metropolitan Sao Paulo
7
54%
15%
13%
9%
6%2%
Low Income
More than R$ 500,000
R$ 200,000 - R$ 350,000
R$ 350,000 - R$ 500,000
Commercial Properties
Up to R$ 200,000
21%
17%
16%
10%
9%
7%
5%
4%
1%
4%
4%
São Paulo (RMSP)
Rio Grande do Sul
São Paulo (other cities)
Distrito Federal
Rio de Janeiro
Minas Gerais
Amazonas
Espírito Santo
Paraná
Goiás
Mato Grosso do Sul
Pernambuco
Contracted Sales
Sales Breakdown by Income Segment and State – Total PSV
283
66660
176
1Q09 1Q10
Contracted Sales (R$ million)
Rossi Partners
+146%
342
842
RMSP - Região metropolitan Sao Paulo
8
Real Estate Market: Industry and Company OverviewSuccessful Launches in the quarter
Gragoatá Bay Residênciais
Niterói - RJ
318 unidades 86% vendido)
VGV % Rossi: R$ 106 milhões
Lançamento: Nov/09
Rossi Jardins Praças Residenciais
Belo horizonte - MG
132 unidades (80% vendido)
VGV % Rossi: R$ 23 milhões
Lançamento: Dez/09
Rossi Ideal Cores de Mogi
Mogi das Cruzes- SP
Lançamento Jan/10 – 80% vendido
Speciale
Gama - DF
140 unidades (60% vendido)
VGV % Rossi: R$ 19 milhões
Lançamento: Nov/09
Rossi Ipiranga One
São Paulo - SP-
180 units (100% sold )
PSV % Rossi: R$ 36million
Launched : Mar/10
Gragoatá Bay Residênciais
Niterói - RJ
318 unidades 86% vendido)
VGV % Rossi: R$ 106 milhões
Lançamento: Nov/09
Rossi Ideal Pitangueiras
Hortolândia -
176 units (84% sold )
PSV% Rossi: R$ 10 million
Launched : Mar/10
Totalité
São José do Rio Preto - SP
208 unidades (68% vendido)
VGV % Rossi: R$ 22,5 milhões
Lançamento: Out/09
Rossi Ideal Vila das Acácias
- MG
240 units (90% Sold)
PSV % Rossi: R$ 16 million
Launched : Mar/10
Rossi Jardins Praças Residenciais
Belo horizonte - MG
132 unidades (80% vendido)
VGV % Rossi: R$ 23 milhões
Lançamento: Dez/09
Rossi Passeio Residencial
Porto Alegre - RS
384 units (97% sold )
PSV% Rossi: R$ 86 million
Launched : Mar/10
Rossi Ideal Cores de Mogi
Mogi das Cruzes - SP
Rossi Ideal Cores de Mogi
Mogi das Cruzes - SP
Rossi Ideal Águas Claras e Vitória Régia
Campinas - SP
400 unidades (99% vendido)
VGV % Rossi: R$ 19 milhões
Lançamento: Dez/09
Rossi Ideal Laranjeiras
Hortolândia - SP
176 units (88% sold )
PSV % Rossi: R$ 10 million
Launched: Mar/10
SP
Uberlândia
320 units (72% sold)
Launched : Jan/10
PSV % Rossi: R$ 19 million
9
69
120
163
266 259
214
284
354
355
407
1Q09 2Q09 3Q09 4Q09 1Q10
Launch Sales Inventory Sales
Nossos Resultados em Números
Constant growth in Sales velocity
SOS and Inventory
15%
20%
21%
23%
25%
1Q09 2Q09 3Q09 4Q09 1Q10
SOS (%)- 5th Consecutive Quarter of Improvement
Sales of inventory (R$ million)
10
Land bank
R$ million
Low Income
Segment
Up to
R$ 200.000
R$ 200.000 to
R$ 350.000
R$ 350.000 to
R$ 500.000
Above R$
500.000
Commercial Lots Total
Amazonas 189 59 214 66 118 646
Bahia 94 879 479 1,452
Ceará 219 174 104 498
Distrito Federal 973 25 69 567 1,633
Espírito Santo 694 105 799
Goiás 925 925
Mato Grosso do Sul 45 45
Minas Gerais 2,253 171 2,424
Paraná
Pernambuco 92 92
Rio de Janeiro 979 359 124 906 88 26 2,483
Rio Grande do Norte 205 82 82 286
Rio Grande do Sul 1,739 988 479 3,206
São Paulo
(other cities)
1,884 135 2,343 1,762 862 231 798 8,015
São Paulo
(Metropolitan Region)
366 163 404 322 1,255
Total 10,659 577 4,953 3,413 2,230 1,129 798 23,760
Distribuição 45% 2% 21% 14% 9% 5% 3% 100%
Expertise Rossi e Diferenciais Competitivos
 Land bank diversified by region and product
 45% of Land bank focused on Low Income Segment
Land bank 1Q10 (in R$ million) - PSV by State and Income Segment
Land bank
SFH (Brazilian financial system) = 83%
11
24%
29%
47%
Cash Units swap Financial swap
Potential PSV (100%): R$ 23,8 billion
Rossi’s share: R$ 16.0 billion
148 lands and 73 cities
11 million of m2 on area under construction
135 mil unities for future launches
Expertise Rossi e Diferenciais CompetitivosExpertise Rossi e Diferenciais Competitivos
 R$ 23.8 billion of PSV on Landbank
Land bank
 76% acquired by swaps
Land Bank Variation - Rossi´s share
(R$ billion)
16.0
15.2
0.6
1.4
Initial landbank 1Q10 Launches New acquisitions Final landbank 1Q10
12
Sales Breakdown
 Market segment: Rossi Vendas São Paulo, Rio de Janeiro, Porto Alegre Campinas, Fortaleza,
Brasília, Espírito Santo, Campo Grande and Goiania.
 We plan to open new regional offices in Curitiba, Belo Horizonte and Manaus in June of 2010.
Sales on operations region
Rossi Vendas
Brokers by city
89
77
127
51
40
35
17
16
10
São Paulo
Porto Alegre
Rio de Janeiro
Campinas
Brasília
Espírito Santo
Fortaleza
Goiânia
Campo Grande
14%
86%
Launch Sales
Inventory Sales
29,4%
70,6%
ROSSI VENDAS
Other
13
Rossi Ideal
Rossi Ideal
 Rossi Ideal stores received an average of 9,000 visitors per quarter, equivalent to an average of 100
visits per day.
 Photos of the first “Minha casa minha vida” Fair in Uberlândia/MG:
141414
14
Financial
Highlights
15
Destaques Resultados
Net Income
 Net income growth of 126% (vs. 1Q09), totaling R$ 64 million
Margins
 EBITDA Margin reaches 22.1% vs. 17.5% in 1Q09 (4.6 p.p. growth)
 Net Margin of 13.1% in 1Q10 (increase of 3.5 p.p vs. 1Q09)
 Adjusted annualized ROE (¹) of 16.2% in the quarter
Selling and Administrative Expenses
 More efficient at selling and administrative expenses
 Decline in expenses as a percentage of net revenue, contracted sales and launches versus
1Q09
1Q10 Highlights
(¹)Adjusted annualized ROE excludes follow-on and includes the quarter’s cash burn.
16
Nossos Resultados em Números
Net Revenue
Property sales and services
Monetary variation and interest
(-) Sales taxes
Total
Costs 1Q09 1Q10
Works+Sites 191 90,6% 308 90,4%
Financial Charges 20 9,4% 33 9,6%
Gross Profit 85 150
Financial Charges 20 33
Monetary variation and interest 9 41
Adjusted Gross Profit* 96 142
Adjusted Gross Margin* 33.4% 31.5%
Financial Highlights
* Excluding financial effects
296.4
491.0
1Q09 1Q10
Net Income (R$ million)
65.6%
1Q10
% of Net
Revenue
464 94.5%
41 8.4%
(14) -2.8%
491 100%
1Q09
% of Net
Revenue
298 100%
9 3,0%
(10) -3,4%
296 100%
85.1
150.1
1Q09 1Q10
Gross Income (R$ million) &
Gross Margin (%)
29%
31%
76.4%
17
EBITDA 1Q10 1Q09 Var
Net Income 65 29 126%
(+/-) Financial Expenses (Ver.), Net (9) (3) 176%
(+) Provision for tax and Social Contrib. 13 2 726%
(+) Depreciation and Amortization 5 5 -2%
(+) Interest 33 20 65%
EBITDA 107 52 106%
(+) Stock Options 2 0 -
Adjusted EBITDA 109 52 110%
Adjusted EBITDA Margin 22.1% 17.5% 4.6 p.p
Nossos Resultados em NúmerosFinancial Highlights
51.8
108.5
1Q09 1Q10
EBITDA and EBITDA Margin (%)
17.5%
22.1%
109.6%
13%
10%
28.6
64.5
1Q09 1Q10
Net Income (R$ million) & Net
Margin (%)
126%
10%
13%
18
Operating expenses 1Q10 1Q09 Var.
Administrative
33 24 39%
Selling
35 26 33%
Administrative/Net Revenue
6.8% 8.1% -1.3 p.p.
Selling/Net Revenue
7.1% 8.8% -1.7 p.p.
Administrative/Contracted Sales (% Rossi)
5.0% 8.5% -3.5 p.p.
Selling/Contracted Sales (%Rossi)
5.2% 9.3% -4.0 p.p.
Administrative/Launches (% Rossi)
5.8% 16.7% -10.9 p.p.
Selling/Launches (%Rossi)
6.1% 18.3% -12.2 p.p.
Nossos Resultados em Números
 More efficient at selling and administrative expenses
Selling and Administrative expenses
Operating expenses
We have decline in expenses as a percentage of net revenue, contracted sales and launches:
8.1% 6.8%
8.8%
7.1%
1Q09 1Q10
Administrative/Net Revenue
Selling / Net Revenue
- 1.7pp
- 1,3pp
8.5%
5.0%
9.3%
5.2%
1Q09 1Q10
Administrative /Contracted Sales (% Rossi)
Selling/ Contracted Sales (% Rossi)
- 4.0pp
- 3.5pp
19
Debt Interest Rate Mar/10 Dec/09 Var.
Debt – Short Term 528.0 515.8 2%
Loans – working capital CDI + 1.5 – 2.0% 80.3 69.4 16%
Construction financing TR + 9-11% 422.1 413.4 2%
Debentures - 25.6 33.1 -23%
Debt – Long Term 768.9 694.8 11%
Loans – working capital CDI + 1.5 - 2,0% 150.4 167.1 -10%
Construction financing TR + 9-11% 308.9 213.2 45%
Debentures 106.6% do CDI 309.6 314.6 -2%
Total Debt 1,297.0 1,210.6 7%
Cash position
Short term investments CDB indexed to CDI
variation 880.8 969.7
-9%
Long term investments CDB indexed to CDI
variation
1.1 1.1 0%
Total cash position
881.9 970.9 -9%
Net Debt 415.1 239.7 73%
Net Debt/Shareholders’ Equity 17.7% 10.5% 7.2 p.p.
Net Debt (- SFH)/ Shareholders’ Equity
-13.5% -16.9% 3.5 p.p
19
Nossos Resultados em NúmerosDebt
Total Debt Breakdown
Cash Burn (in R$ million)
SFH- Housing Policy Financial System
138
108 117
187 175
1Q09 2Q09 3Q09 4Q09 1Q10
18%
56%
26% Loans – working
capital
Construction
financing
Debentures
20
NossosResultados em NúmerosRSID3 Performance
Market Value RSID3
Number of shares before offering 192.186.388
Number of new shares issued 74.250.000
Total shares after offering 266.436.388
Share price 05/12/2010 13,85
Market Value R$ 3.690.144
80,00
100,00
120,00
140,00
160,00
180,00
200,00
220,00
240,00
RSID x IBOV x IMOB
RSID3 IBOV IMOB
The company outperformed the sector and Bovespa indexes in the last 12 months
21
Equipe de RIIR Team
Cássio Elias Audi
CFO and Investor Relations Officer
Carolina Burg
Investor Relations Manager
ri@rossiresidencial.com.br
Ph. (55 11) 3759-7516
222222
Q&A

1Q10 Results Conference Call’s Presentation

  • 1.
    11 1Q10 Results Villa Flora– Low Income Segment
  • 2.
    222 Disclaimer Results 1Q10 This materialis a presentation of general background information about Rossi Residencial S.A. (“Rossi”) as of the date of this presentation. Information contained herein has been summarized and does not purport to be complete. This presentation shall not be considered an advice of investment by potential investors. This presentation is strictly confidential and may not be disclosed to any third person. There are no representations or warranties, express or implied, regarding the accuracy, fairness, or completeness of the information presented herein, which shall not support any decision of investment. This presentation contains statements and information that are forward-looking pursuant section 27A of the Securities Act of 1933, as amended, and Section 21E of the Securities and Exchange Act of 1934. Such forward-looking statements and information are only predictions and cannot assure Rossi’s future performance. Investors have been cautioned that any such forward-looking statements and information are subject to many risks and uncertainties relating to the operations and business of Rossi and its subsidiaries. As a result of such risks and uncertainties, the actual results of Rossi and its subsidiaries may be materially different from any future result expressed or implied in the forward-looking statement or information contained herein. Although Rossi believes that the expectations and assumptions reflected in the forward-looking statements and information are reasonable and have been based on data currently available to its officers and directors, Rossi cannot guarantee future results or events. Rossi does not assume the commitment of update any of the forward-looking statement of information. Securities may not be offered or sold in the United States unlesss they are registered or exempt from registration under the Securities Act of 1933, as amended. Any offering of securities to be made in the United States will be made by means of an offering memorandum that may be obtained from the underwriters. Such offering memorandum will contain, or incorporate by reference, detailed information about Rossi and its subsidiaries, their business and financial results, as well as its financial statements. This material is for distribution only to person who (i) have professional experience in matters relating to investments falling within Article 19 (5) of the Financial Services and Markets Act of 2000 (Financial Promotion) Order 2005 (as amended, the “Financial Promotion Order”), (ii) are persons falling within Article 49 (2) (a) to (d) (“high net worth companies, unincorporated associations etc”) of the Financial Promotion Order, (iii) are outside the United Kingdom, or (iv) are persons to whom an invitation or inducement to engage in investment activity (within the meaning of section 21 of the Financial Services and Markets Act 2000) in connection with the issue or sale of any securities may otherwise lawfully be communicated or caused to be communicated (all such persons together being referred to as “relevant persons”). This material is directed only at relevant persons and must not be acted on or relied on by persons who are not relevant persons. Any investment or investment activity to which this material relates is available only to relevant persons and will be engaged in only with relevant persons. This presentation does not constitute an offer, invitation or solicitation of an offer to subscribe to or purchase any securities. Neither this presentation nor anything contained herein shall form the basis of any contract or commitment whatsoever.
  • 3.
    33 Heitor Cantergiani CEO Highlights Leonardo Diniz SalesOfficer Operating Performance Cássio Audi CFO and IRO Financial Performance Agenda
  • 4.
    44 Operating Highlights  TotalLaunches of R$ 722 million (R$ 571 million – Rossi’s share), up 350% compared to 1Q09  SOS ratio of 25% 5th consecutive quarter of improvement  Contracted sales of R$ 842 million, up 146% compared to 1Q09  Contracted sales Rossi’s share of R$ 666 million, up 136% compared to 1Q09 Low Income Segment  Launched PSV (Rossi’s share) of R$ 417 million, up 358% compared to 1Q09, 73% of total launches  SOS reaches record of 37.4%  Sales over launches (Rossi’s share) in 1Q10 achieved 51% of PSV ( Rossi’s share)  Total sales of R$ 456.7 million (R$ 368.3 million Rossi’s share) Financial Performance  Increase of 126% in Net Income (vs. 1Q09), reaching R$ 64 million  Net Margin of 13.1% in 1Q10 (growth of 3.5 p.p vs. 1Q09)  EBITDA reaches R$ 109 million, up 110% compared to 1Q09  EBITDA Margin reaches 22.1% vs. 17.5% in 1Q09 (growth of 4.6 p.p )  Adjusted ROE annualized reaches 16,2% in the 1Q10 (¹)Adjusted annualized ROE excludes follow-on and includes the quarter’s cash burn. 1Q10 Highlights
  • 5.
    555 Launches and Sales Villa Flora– Low Income Segment
  • 6.
    6 27% 14% 14% 9% 8% 8% 7% 6% 5% 3% São Paulo(other cities) RioGrande do Sul São Paulo(RMSP*) Distrito Federal Espírito Santo Goiás Minas Gerais Mato Grosso do Sul Amazonas Ceará 72% 23% 5% Low Income Conventional Commercial Nossos Resultados em Números Launches Breakdown by Income Segment and State – Total PSV Launches Launches PSV (R$ million) 143 571 18 151 1T09 1T10 Rossi Partners 722 161 91 417 18 102 1Q09 1Q10 Launch PSV (R$ million) Low Income Segment Rossi Partners +378% 109 519 +350% RMSP - Região metropolitan Sao Paulo
  • 7.
    7 54% 15% 13% 9% 6%2% Low Income More thanR$ 500,000 R$ 200,000 - R$ 350,000 R$ 350,000 - R$ 500,000 Commercial Properties Up to R$ 200,000 21% 17% 16% 10% 9% 7% 5% 4% 1% 4% 4% São Paulo (RMSP) Rio Grande do Sul São Paulo (other cities) Distrito Federal Rio de Janeiro Minas Gerais Amazonas Espírito Santo Paraná Goiás Mato Grosso do Sul Pernambuco Contracted Sales Sales Breakdown by Income Segment and State – Total PSV 283 66660 176 1Q09 1Q10 Contracted Sales (R$ million) Rossi Partners +146% 342 842 RMSP - Região metropolitan Sao Paulo
  • 8.
    8 Real Estate Market:Industry and Company OverviewSuccessful Launches in the quarter Gragoatá Bay Residênciais Niterói - RJ 318 unidades 86% vendido) VGV % Rossi: R$ 106 milhões Lançamento: Nov/09 Rossi Jardins Praças Residenciais Belo horizonte - MG 132 unidades (80% vendido) VGV % Rossi: R$ 23 milhões Lançamento: Dez/09 Rossi Ideal Cores de Mogi Mogi das Cruzes- SP Lançamento Jan/10 – 80% vendido Speciale Gama - DF 140 unidades (60% vendido) VGV % Rossi: R$ 19 milhões Lançamento: Nov/09 Rossi Ipiranga One São Paulo - SP- 180 units (100% sold ) PSV % Rossi: R$ 36million Launched : Mar/10 Gragoatá Bay Residênciais Niterói - RJ 318 unidades 86% vendido) VGV % Rossi: R$ 106 milhões Lançamento: Nov/09 Rossi Ideal Pitangueiras Hortolândia - 176 units (84% sold ) PSV% Rossi: R$ 10 million Launched : Mar/10 Totalité São José do Rio Preto - SP 208 unidades (68% vendido) VGV % Rossi: R$ 22,5 milhões Lançamento: Out/09 Rossi Ideal Vila das Acácias - MG 240 units (90% Sold) PSV % Rossi: R$ 16 million Launched : Mar/10 Rossi Jardins Praças Residenciais Belo horizonte - MG 132 unidades (80% vendido) VGV % Rossi: R$ 23 milhões Lançamento: Dez/09 Rossi Passeio Residencial Porto Alegre - RS 384 units (97% sold ) PSV% Rossi: R$ 86 million Launched : Mar/10 Rossi Ideal Cores de Mogi Mogi das Cruzes - SP Rossi Ideal Cores de Mogi Mogi das Cruzes - SP Rossi Ideal Águas Claras e Vitória Régia Campinas - SP 400 unidades (99% vendido) VGV % Rossi: R$ 19 milhões Lançamento: Dez/09 Rossi Ideal Laranjeiras Hortolândia - SP 176 units (88% sold ) PSV % Rossi: R$ 10 million Launched: Mar/10 SP Uberlândia 320 units (72% sold) Launched : Jan/10 PSV % Rossi: R$ 19 million
  • 9.
    9 69 120 163 266 259 214 284 354 355 407 1Q09 2Q093Q09 4Q09 1Q10 Launch Sales Inventory Sales Nossos Resultados em Números Constant growth in Sales velocity SOS and Inventory 15% 20% 21% 23% 25% 1Q09 2Q09 3Q09 4Q09 1Q10 SOS (%)- 5th Consecutive Quarter of Improvement Sales of inventory (R$ million)
  • 10.
    10 Land bank R$ million LowIncome Segment Up to R$ 200.000 R$ 200.000 to R$ 350.000 R$ 350.000 to R$ 500.000 Above R$ 500.000 Commercial Lots Total Amazonas 189 59 214 66 118 646 Bahia 94 879 479 1,452 Ceará 219 174 104 498 Distrito Federal 973 25 69 567 1,633 Espírito Santo 694 105 799 Goiás 925 925 Mato Grosso do Sul 45 45 Minas Gerais 2,253 171 2,424 Paraná Pernambuco 92 92 Rio de Janeiro 979 359 124 906 88 26 2,483 Rio Grande do Norte 205 82 82 286 Rio Grande do Sul 1,739 988 479 3,206 São Paulo (other cities) 1,884 135 2,343 1,762 862 231 798 8,015 São Paulo (Metropolitan Region) 366 163 404 322 1,255 Total 10,659 577 4,953 3,413 2,230 1,129 798 23,760 Distribuição 45% 2% 21% 14% 9% 5% 3% 100% Expertise Rossi e Diferenciais Competitivos  Land bank diversified by region and product  45% of Land bank focused on Low Income Segment Land bank 1Q10 (in R$ million) - PSV by State and Income Segment Land bank SFH (Brazilian financial system) = 83%
  • 11.
    11 24% 29% 47% Cash Units swapFinancial swap Potential PSV (100%): R$ 23,8 billion Rossi’s share: R$ 16.0 billion 148 lands and 73 cities 11 million of m2 on area under construction 135 mil unities for future launches Expertise Rossi e Diferenciais CompetitivosExpertise Rossi e Diferenciais Competitivos  R$ 23.8 billion of PSV on Landbank Land bank  76% acquired by swaps Land Bank Variation - Rossi´s share (R$ billion) 16.0 15.2 0.6 1.4 Initial landbank 1Q10 Launches New acquisitions Final landbank 1Q10
  • 12.
    12 Sales Breakdown  Marketsegment: Rossi Vendas São Paulo, Rio de Janeiro, Porto Alegre Campinas, Fortaleza, Brasília, Espírito Santo, Campo Grande and Goiania.  We plan to open new regional offices in Curitiba, Belo Horizonte and Manaus in June of 2010. Sales on operations region Rossi Vendas Brokers by city 89 77 127 51 40 35 17 16 10 São Paulo Porto Alegre Rio de Janeiro Campinas Brasília Espírito Santo Fortaleza Goiânia Campo Grande 14% 86% Launch Sales Inventory Sales 29,4% 70,6% ROSSI VENDAS Other
  • 13.
    13 Rossi Ideal Rossi Ideal Rossi Ideal stores received an average of 9,000 visitors per quarter, equivalent to an average of 100 visits per day.  Photos of the first “Minha casa minha vida” Fair in Uberlândia/MG:
  • 14.
  • 15.
    15 Destaques Resultados Net Income Net income growth of 126% (vs. 1Q09), totaling R$ 64 million Margins  EBITDA Margin reaches 22.1% vs. 17.5% in 1Q09 (4.6 p.p. growth)  Net Margin of 13.1% in 1Q10 (increase of 3.5 p.p vs. 1Q09)  Adjusted annualized ROE (¹) of 16.2% in the quarter Selling and Administrative Expenses  More efficient at selling and administrative expenses  Decline in expenses as a percentage of net revenue, contracted sales and launches versus 1Q09 1Q10 Highlights (¹)Adjusted annualized ROE excludes follow-on and includes the quarter’s cash burn.
  • 16.
    16 Nossos Resultados emNúmeros Net Revenue Property sales and services Monetary variation and interest (-) Sales taxes Total Costs 1Q09 1Q10 Works+Sites 191 90,6% 308 90,4% Financial Charges 20 9,4% 33 9,6% Gross Profit 85 150 Financial Charges 20 33 Monetary variation and interest 9 41 Adjusted Gross Profit* 96 142 Adjusted Gross Margin* 33.4% 31.5% Financial Highlights * Excluding financial effects 296.4 491.0 1Q09 1Q10 Net Income (R$ million) 65.6% 1Q10 % of Net Revenue 464 94.5% 41 8.4% (14) -2.8% 491 100% 1Q09 % of Net Revenue 298 100% 9 3,0% (10) -3,4% 296 100% 85.1 150.1 1Q09 1Q10 Gross Income (R$ million) & Gross Margin (%) 29% 31% 76.4%
  • 17.
    17 EBITDA 1Q10 1Q09Var Net Income 65 29 126% (+/-) Financial Expenses (Ver.), Net (9) (3) 176% (+) Provision for tax and Social Contrib. 13 2 726% (+) Depreciation and Amortization 5 5 -2% (+) Interest 33 20 65% EBITDA 107 52 106% (+) Stock Options 2 0 - Adjusted EBITDA 109 52 110% Adjusted EBITDA Margin 22.1% 17.5% 4.6 p.p Nossos Resultados em NúmerosFinancial Highlights 51.8 108.5 1Q09 1Q10 EBITDA and EBITDA Margin (%) 17.5% 22.1% 109.6% 13% 10% 28.6 64.5 1Q09 1Q10 Net Income (R$ million) & Net Margin (%) 126% 10% 13%
  • 18.
    18 Operating expenses 1Q101Q09 Var. Administrative 33 24 39% Selling 35 26 33% Administrative/Net Revenue 6.8% 8.1% -1.3 p.p. Selling/Net Revenue 7.1% 8.8% -1.7 p.p. Administrative/Contracted Sales (% Rossi) 5.0% 8.5% -3.5 p.p. Selling/Contracted Sales (%Rossi) 5.2% 9.3% -4.0 p.p. Administrative/Launches (% Rossi) 5.8% 16.7% -10.9 p.p. Selling/Launches (%Rossi) 6.1% 18.3% -12.2 p.p. Nossos Resultados em Números  More efficient at selling and administrative expenses Selling and Administrative expenses Operating expenses We have decline in expenses as a percentage of net revenue, contracted sales and launches: 8.1% 6.8% 8.8% 7.1% 1Q09 1Q10 Administrative/Net Revenue Selling / Net Revenue - 1.7pp - 1,3pp 8.5% 5.0% 9.3% 5.2% 1Q09 1Q10 Administrative /Contracted Sales (% Rossi) Selling/ Contracted Sales (% Rossi) - 4.0pp - 3.5pp
  • 19.
    19 Debt Interest RateMar/10 Dec/09 Var. Debt – Short Term 528.0 515.8 2% Loans – working capital CDI + 1.5 – 2.0% 80.3 69.4 16% Construction financing TR + 9-11% 422.1 413.4 2% Debentures - 25.6 33.1 -23% Debt – Long Term 768.9 694.8 11% Loans – working capital CDI + 1.5 - 2,0% 150.4 167.1 -10% Construction financing TR + 9-11% 308.9 213.2 45% Debentures 106.6% do CDI 309.6 314.6 -2% Total Debt 1,297.0 1,210.6 7% Cash position Short term investments CDB indexed to CDI variation 880.8 969.7 -9% Long term investments CDB indexed to CDI variation 1.1 1.1 0% Total cash position 881.9 970.9 -9% Net Debt 415.1 239.7 73% Net Debt/Shareholders’ Equity 17.7% 10.5% 7.2 p.p. Net Debt (- SFH)/ Shareholders’ Equity -13.5% -16.9% 3.5 p.p 19 Nossos Resultados em NúmerosDebt Total Debt Breakdown Cash Burn (in R$ million) SFH- Housing Policy Financial System 138 108 117 187 175 1Q09 2Q09 3Q09 4Q09 1Q10 18% 56% 26% Loans – working capital Construction financing Debentures
  • 20.
    20 NossosResultados em NúmerosRSID3Performance Market Value RSID3 Number of shares before offering 192.186.388 Number of new shares issued 74.250.000 Total shares after offering 266.436.388 Share price 05/12/2010 13,85 Market Value R$ 3.690.144 80,00 100,00 120,00 140,00 160,00 180,00 200,00 220,00 240,00 RSID x IBOV x IMOB RSID3 IBOV IMOB The company outperformed the sector and Bovespa indexes in the last 12 months
  • 21.
    21 Equipe de RIIRTeam Cássio Elias Audi CFO and Investor Relations Officer Carolina Burg Investor Relations Manager ri@rossiresidencial.com.br Ph. (55 11) 3759-7516
  • 22.