Downloaded 224 times


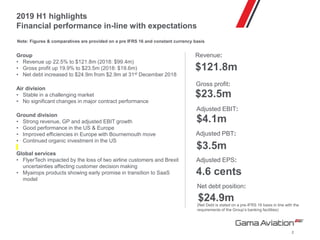

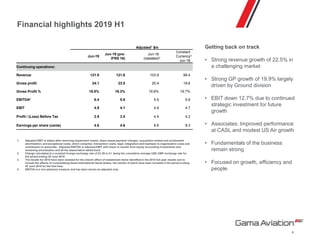
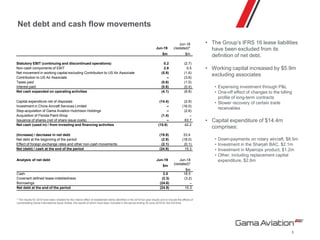
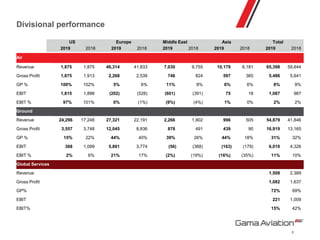


- Gama Aviation reported revenue growth of 22.5% in the first half of 2019 to $121.8 million, with gross profit up 19.9% to $23.5 million. Net debt increased to $24.9 million from $2.9 million at the end of 2018. - The Ground division performed strongly with revenue, gross profit, and adjusted EBIT growth, benefiting from good performance in the US and Europe. However, the Global Services division was impacted by the loss of two airline customers. - While financial performance was in line with expectations, the net debt position increased due to strategic investment, working capital growth, and slower recovery of some trade receivables. The outlook for


