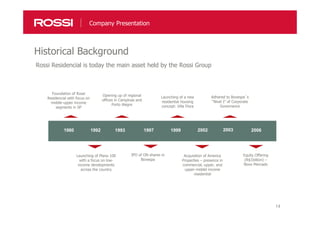
- Rossi Residencial is a Brazilian real estate developer focused on residential properties. It has been operating since 1980 and went public in 1999.
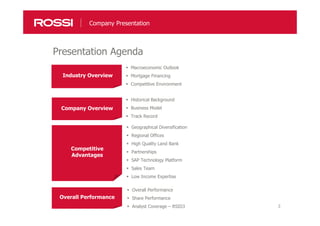
- The presentation provides an overview of Rossi's historical background, business model, track record, competitive advantages, and financial performance.
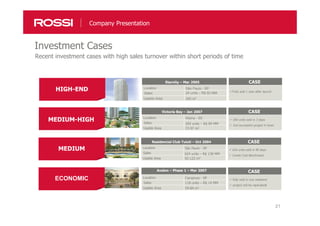
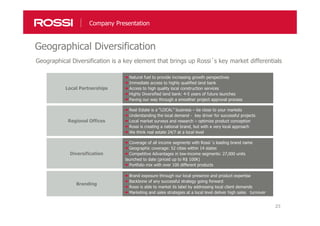
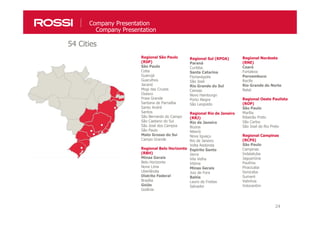
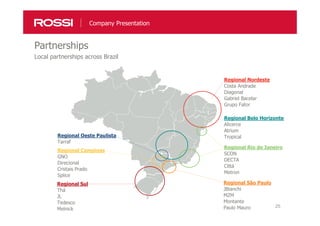
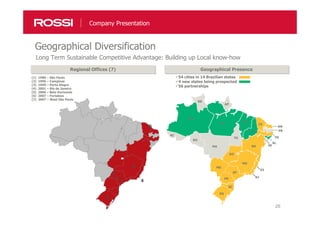
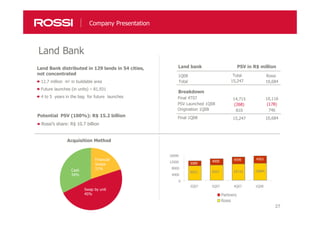
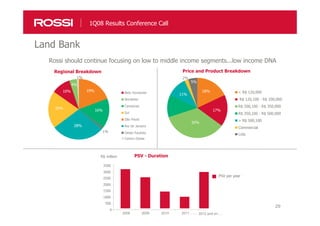
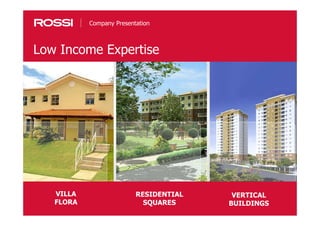
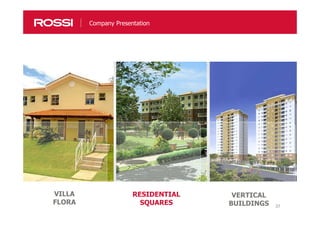
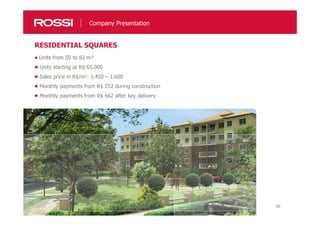
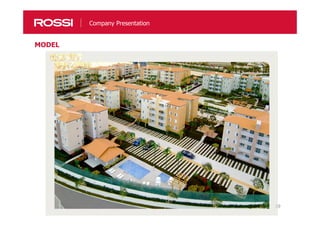
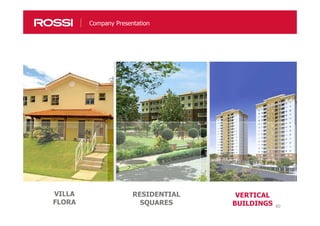
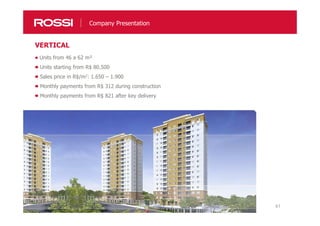
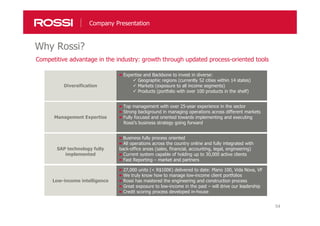
- Key details include Rossi's expansion through new regional offices, product lines focused on different income segments, and its adherence to high corporate governance standards.