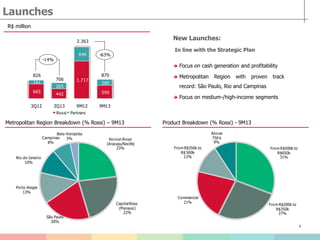
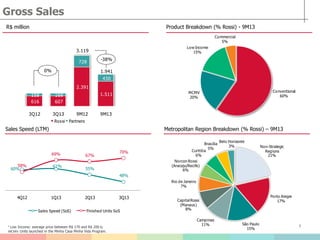
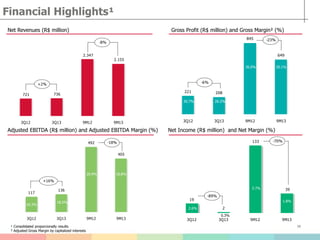
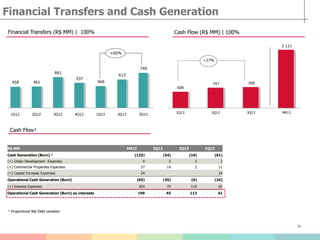
3Q13 and
9M13 Results
Investor Relations
2
Disclaimer
This material is a presentation of general background information about Rossi Residencial S.A. (“Rossi”) as of the date of this presentation.
Information contained herein has been summarized and does not purport to be complete. This presentation shall not be considered an advice of
investment by potential investors. This presentation is strictly confidential and may not be disclosed to any third person. There are no
representations or warranties, express or implied, regarding the accuracy, fairness, or completeness of the information presented herein, which shall
not support any decision of investment.
This presentation contains statements and information that are forward-looking pursuant section 27A of the Securities Act of 1933, as amended, and
Section 21E of the Securities and Exchange Act of 1934. Such forward-looking statements and information are only predictions and cannot assure
Rossi’s future performance. Investors have been cautioned that any such forward-looking statements and information are subject to many risks and
uncertainties relating to the operations and business of Rossi and its subsidiaries. As a result of such risks and uncertainties, the actual results of
Rossi and its subsidiaries may be materially different from any future result expressed or implied in the forward-looking statement or information
contained herein.
Although Rossi believes that the expectations and assumptions reflected in the forward-looking statements and information are reasonable and have
been based on data currently available to its officers and directors, Rossi cannot guarantee future results or events. Rossi does not assume the
commitment of update any of the forward-looking statement of information.
Securities may not be offered or sold in the United States unlesss they are registered or exempt from registration under the Securities Act of 1933,
as amended. Any offering of securities to be made in the United States will be made by means of an offering memorandum that may be obtained
from the underwriters. Such offering memorandum will contain, or incorporate by reference, detailed information about Rossi and its subsidiaries,
their business and financial results, as well as its financial statements.
This material is for distribution only to person who (i) have professional experience in matters relating to investments falling within Article 19 (5) of
the Financial Services and Markets Act of 2000 (Financial Promotion) Order 2005 (as amended, the “Financial Promotion Order”), (ii) are persons
falling within Article 49 (2) (a) to (d) (“high net worth companies, unincorporated associations etc”) of the Financial Promotion Order, (iii) are
outside the United Kingdom, or (iv) are persons to whom an invitation or inducement to engage in investment activity (within the meaning of section
21 of the Financial Services and Markets Act 2000) in connection with the issue or sale of any securities may otherwise lawfully be communicated or
caused to be communicated (all such persons together being referred to as “relevant persons”). This material is directed only at relevant persons
and must not be acted on or relied on by persons who are not relevant persons. Any investment or investment activity to which this material relates
is available only to relevant persons and will be engaged in only with relevant persons.
This presentation does not constitute an offer, invitation or solicitation of an offer to subscribe to or purchase any securities. Neither this
presentation nor anything contained herein shall form the basis of any contract or commitment whatsoever.
3
Index
Opening Remarks and Estrategic Planning: Leonardo Nogueira Diniz | CEO
Operational Results: Rodrigo Martins | Commercial Officer
Financial Results: Rodrigo Medeiros | CFO and Investor Relations Officer
4
2013-2015 Strategic Plan | Update
Strategic Plan Achievments 9M13
Focus
G&A G&A Expenses efficiency
Rossi Vendas Increase Rossi Vendas stake on the total sales
Financing
Transfers
Focus in house restructuring and transfer of financing
Construction Execution of 90% of the construction
Partners
Operation
Income Segment
Increase Rossi´s stake in the launches up to 95% of the
total PSV, excluding JVs Capital Rossi and Norcon Rossi)
Operations focused on 7 metropolitan regions (+JVs),
where it ranks among Top 3
Focus on medium-/high-income segments (average price
between entre R$ 200 k and R$ 1 million)
Land Bank
Disablement of the Land Bank outside from the launching
pipeline
Business Units
Search for financial/strategic partners for Urbanizadora
and Properties
Operational Cash Generation ex interest: R$ 199 MM
Net Income: R$ 39 MM
Decrease of 7% vs 9M12
% Rossi Vendas: 52%
Increase by 16% of Transfers vs 9M12
90% of the construction beginning in 2013 will be
done by Rossi
Rossi already executes 67% of the ongoing projects
New Asset Sales: R$ 78 MM
Sold its stake on North Shopping Joquei by R$ 80
MM (November)
New Launches:
São Paulo, Campinas, Aracaju, Porto Alegre,
Manaus and Belo Horizonte
Average Price: R$ 349 kl/unit
% Rossi (s/ JVs): 83%
Focus on cash generation and profitability
5
Operational Perfomance
Norcon Rossi
(Aracaju/Recife)
23%
CapitalRossi
(Manaus)
22%
São Paulo
20%
Porto Alegre
13%
Rio de Janeiro
10%
Campinas
8%
Belo Horizonte
3%
Launches (% Rossi) 9Q13 | Metropolitan Region
From R$500k to
R$650k
31%
From R$200k to
R$350k
27%
Commercial
21%
From R$350k to
R$ 500k
12%
Above
750 k
9%
Launches % Rossi 9M13| Product Breakdown
6
Launches
R$ million
Product Breakdown (% Rossi) - 9M13Metropolitan Region Breakdown (% Rossi) – 9M13
New Launches:
In line with the Strategic Plan
 Focus on cash generation and profitability
 Metropolitan Region with proven track
record: São Paulo, Rio and Campinas
 Focus on medium-/high-income segments
665
442
1.717
590
161
265
646
280
3Q12 3Q13 9M12 9M13
Launches |R$ MM
Rossi Partners
826
-14%
706
2.363
-63%
870
Conventional
60%
MCMV
20%
Low Income
15%
Commercial
5%
Vendas Brutas (% Rossi) 9M13 | Segmento de Renda
616 607
2.391
1.511158 169
728
430
3Q12 3Q13 9M12 9M13
Gross Sales|R$ MM
Rossi Partners
0%
3.119
-38%
1.941
7
Gross Sales
R$ million Product Breakdown (% Rossi) - 9M13
Metropolitan Region Breakdown (% Rossi) – 9M13Sales Speed (LTM)
¹ Low Income: average price between R$ 170 and R$ 200 k;
MCMV: Units launched in the Minha Casa Minha Vida Program.
60%
61%
55%
48%
58%
69% 67%
70%
4Q12 1Q13 2Q13 3Q13
Sales Speed (SoS) Finished Units SoS
Non-Strategic
Regions
21%
Porto Alegre
17%
São Paulo
15%
Campinas
11%
CapitalRossi
(Manaus)
8%
Rio de Janeiro
7%
Norcon Rossi
(Aracaju/Recife)
6%
Curitiba
6%
Brasília
5%
Belo Horizonte
3%
Vendas Brutas (% Rossi) 9M13 | Regiões Metropolitanas
Finished
66%
Under
Construction
34%
Rescisão (%Rossi) 9M13
Non-Strategic Regions: 21%
Brasília: 11%
Porto Alegre: 9%
São Paulo: 7%
Campinas: 6%
Curitiba: 5%
Rio de Janeiro: 3%
Belo Horizonte:1%
CapitalRossi: 1%
41% 38%
32% 34%
59% 62%
68% 66%
4Q12 1Q13 2Q13 3Q13
Rossi Vendas | Rescissions (%)
Rossi Vendas Other
8
Sales Cancellation
R$ million
Construction stage breakdown(% Rossi) | 9M13
Breakdown by Broker
323
177
777
468
80
51
208
135
3Q12 3Q13 9M12 9M13
Rescission |R$ MM
Rossi Partners
404
-44%
228
985
-39%
603
9
Land Bank
Residential Developments:
 Rossi´s PSV of R$ 8.8 billion, equivalent to
approximately 3 years of launches
 Only land that passed the new feasibility tests as per
the company’s new standards was retained
 Decrease of 4% in land disablement
Land Bank Breakdown
Product Breakdown (% Rossi)Metropolitan Region Breakdown (% Rossi)
Norcon Rossi
(Aracaju/Recife)
27%
Porto Alegre
18%
Campinas
16%
Rio de Janeiro
15%
São Paulo
11%
Belo Horizonte
5%
CapitalRossi
(Manaus)
4%
Brasília
3%
PSV Rossi | R$ PSV 100% PSV RR Units
Land Bank 20.489 15.438 76.468
Rossi Residencial 10.889 8.751 26.151
Disablement 2.583 1.871 11.401
Rossi Urbanizadora 7.016 4.817 38.916
R$ 350 to
R$ 500 k
26%
R$ 200 to
R$ 350 k
25%
> R$ 750k
20%
R$ 650 to
R$ 750k
17%
R$ 500 to
R$ 650k
11%
10
Financial Performance
19
2
133
39
3Q12 3Q13 9M12 9M13
-70%
-89%
117
136
492
405
3Q12 3Q13 9M12 9M13
+16%
-18%
221 208
845
649
3Q12 3Q13 9M12 9M13
-6%
-23%
721 736
2.347
2.155
3Q12 3Q13 9M12 9M13
+2%
-8%
11
Financial Highlights¹
Net Revenues (R$ million) Gross Profit (R$ million) and Gross Margin² (%)
Net Income (R$ million) and Net Margin (%)Adjusted EBITDA (R$ million) and Adjusted EBITDA Margin (%)
30.7% 28.2%
36.0% 30.1%
16.3%
18.5%
20.9% 18.8%
2.6%
5.7%
1.8%
0.3%
¹ Consolidated proporcionally results
² Adjusted Gross Margin by capitalized interests
Financial Transfers and Cash Generation
Financial Transfers (R$ MM) | 100% Cash Flow (R$ MM) | 100%
12
Cash Flow¹
R$ MM 9M13 3Q13 2Q13 1Q13
Cash Generation (Burn) ¹ (125) (54) (10) (61)
(+) Urban Development Expenses 9 5 2 2
(+) Commercial Properties Expenses 27 14 2 11
(+) Capital Increase Expenses 24 24
Operational Cash Generation (Burn) (65) (35) (6) (24)
(+) Interest Expenses 264 79 119 65
Operational Cash Generation (Burn) ex interests 199 45 113 41
¹ Proportional Net Debt variation
458 461
661
537
469
613
749
1Q12 2Q12 3Q12 4Q12 1Q13 2Q13 3Q13
Financial Transfers (R$ MM) | 100%
+60%
606
747 768
2.121
1Q13 2Q13 3Q13 9M13
Cash flow(R$ MM) | 100%
+27%
Liquidity ¹
13
Indebtedness
R$ million 3Q13 2Q13 Var. (%)
Gross Debt 4.010 4.074 -2%
Cash and Equivalents 1.052 1.170 -10%
Net Debt 2.958 2.904 2%
Net Debt / Equity 123,9% 122,1% 1,9 p.p
Debt Profile¹Debt Schedule ¹ | R$ MM
¹ Proportional figures
² Consolidation by IFRS 10
R$ million 3Q13 2Q13 Var. (%)
Gross Debt 3.346 3.463 -3%
Cash and Equivalents 820 1.005 -18%
Net Debt 2.526 2.459 3%
Net Debt / Equity 103,0% 100,2% 2,,8 p.p.
Liquidity ²
Corporate
56%
SFH
44%
293
1.015
566
363
117
752
499
405
2013 2014 2015 +2016
Cronograma de Endividamento | R$ MM
Corporate Debt SFH
411
1,767
1,064
768
Equipe de RI
Obrigado!IR Team
Phone: +55 (11) 4058-2502
ri@rossiresidencial.com.br
www.rossiresidencial.com.br/ri
IR Contacts
14

3Q13 Results Presentation

  • 1.
  • 2.
    2 Disclaimer This material isa presentation of general background information about Rossi Residencial S.A. (“Rossi”) as of the date of this presentation. Information contained herein has been summarized and does not purport to be complete. This presentation shall not be considered an advice of investment by potential investors. This presentation is strictly confidential and may not be disclosed to any third person. There are no representations or warranties, express or implied, regarding the accuracy, fairness, or completeness of the information presented herein, which shall not support any decision of investment. This presentation contains statements and information that are forward-looking pursuant section 27A of the Securities Act of 1933, as amended, and Section 21E of the Securities and Exchange Act of 1934. Such forward-looking statements and information are only predictions and cannot assure Rossi’s future performance. Investors have been cautioned that any such forward-looking statements and information are subject to many risks and uncertainties relating to the operations and business of Rossi and its subsidiaries. As a result of such risks and uncertainties, the actual results of Rossi and its subsidiaries may be materially different from any future result expressed or implied in the forward-looking statement or information contained herein. Although Rossi believes that the expectations and assumptions reflected in the forward-looking statements and information are reasonable and have been based on data currently available to its officers and directors, Rossi cannot guarantee future results or events. Rossi does not assume the commitment of update any of the forward-looking statement of information. Securities may not be offered or sold in the United States unlesss they are registered or exempt from registration under the Securities Act of 1933, as amended. Any offering of securities to be made in the United States will be made by means of an offering memorandum that may be obtained from the underwriters. Such offering memorandum will contain, or incorporate by reference, detailed information about Rossi and its subsidiaries, their business and financial results, as well as its financial statements. This material is for distribution only to person who (i) have professional experience in matters relating to investments falling within Article 19 (5) of the Financial Services and Markets Act of 2000 (Financial Promotion) Order 2005 (as amended, the “Financial Promotion Order”), (ii) are persons falling within Article 49 (2) (a) to (d) (“high net worth companies, unincorporated associations etc”) of the Financial Promotion Order, (iii) are outside the United Kingdom, or (iv) are persons to whom an invitation or inducement to engage in investment activity (within the meaning of section 21 of the Financial Services and Markets Act 2000) in connection with the issue or sale of any securities may otherwise lawfully be communicated or caused to be communicated (all such persons together being referred to as “relevant persons”). This material is directed only at relevant persons and must not be acted on or relied on by persons who are not relevant persons. Any investment or investment activity to which this material relates is available only to relevant persons and will be engaged in only with relevant persons. This presentation does not constitute an offer, invitation or solicitation of an offer to subscribe to or purchase any securities. Neither this presentation nor anything contained herein shall form the basis of any contract or commitment whatsoever.
  • 3.
    3 Index Opening Remarks andEstrategic Planning: Leonardo Nogueira Diniz | CEO Operational Results: Rodrigo Martins | Commercial Officer Financial Results: Rodrigo Medeiros | CFO and Investor Relations Officer
  • 4.
    4 2013-2015 Strategic Plan| Update Strategic Plan Achievments 9M13 Focus G&A G&A Expenses efficiency Rossi Vendas Increase Rossi Vendas stake on the total sales Financing Transfers Focus in house restructuring and transfer of financing Construction Execution of 90% of the construction Partners Operation Income Segment Increase Rossi´s stake in the launches up to 95% of the total PSV, excluding JVs Capital Rossi and Norcon Rossi) Operations focused on 7 metropolitan regions (+JVs), where it ranks among Top 3 Focus on medium-/high-income segments (average price between entre R$ 200 k and R$ 1 million) Land Bank Disablement of the Land Bank outside from the launching pipeline Business Units Search for financial/strategic partners for Urbanizadora and Properties Operational Cash Generation ex interest: R$ 199 MM Net Income: R$ 39 MM Decrease of 7% vs 9M12 % Rossi Vendas: 52% Increase by 16% of Transfers vs 9M12 90% of the construction beginning in 2013 will be done by Rossi Rossi already executes 67% of the ongoing projects New Asset Sales: R$ 78 MM Sold its stake on North Shopping Joquei by R$ 80 MM (November) New Launches: São Paulo, Campinas, Aracaju, Porto Alegre, Manaus and Belo Horizonte Average Price: R$ 349 kl/unit % Rossi (s/ JVs): 83% Focus on cash generation and profitability
  • 5.
  • 6.
    Norcon Rossi (Aracaju/Recife) 23% CapitalRossi (Manaus) 22% São Paulo 20% PortoAlegre 13% Rio de Janeiro 10% Campinas 8% Belo Horizonte 3% Launches (% Rossi) 9Q13 | Metropolitan Region From R$500k to R$650k 31% From R$200k to R$350k 27% Commercial 21% From R$350k to R$ 500k 12% Above 750 k 9% Launches % Rossi 9M13| Product Breakdown 6 Launches R$ million Product Breakdown (% Rossi) - 9M13Metropolitan Region Breakdown (% Rossi) – 9M13 New Launches: In line with the Strategic Plan  Focus on cash generation and profitability  Metropolitan Region with proven track record: São Paulo, Rio and Campinas  Focus on medium-/high-income segments 665 442 1.717 590 161 265 646 280 3Q12 3Q13 9M12 9M13 Launches |R$ MM Rossi Partners 826 -14% 706 2.363 -63% 870
  • 7.
    Conventional 60% MCMV 20% Low Income 15% Commercial 5% Vendas Brutas(% Rossi) 9M13 | Segmento de Renda 616 607 2.391 1.511158 169 728 430 3Q12 3Q13 9M12 9M13 Gross Sales|R$ MM Rossi Partners 0% 3.119 -38% 1.941 7 Gross Sales R$ million Product Breakdown (% Rossi) - 9M13 Metropolitan Region Breakdown (% Rossi) – 9M13Sales Speed (LTM) ¹ Low Income: average price between R$ 170 and R$ 200 k; MCMV: Units launched in the Minha Casa Minha Vida Program. 60% 61% 55% 48% 58% 69% 67% 70% 4Q12 1Q13 2Q13 3Q13 Sales Speed (SoS) Finished Units SoS Non-Strategic Regions 21% Porto Alegre 17% São Paulo 15% Campinas 11% CapitalRossi (Manaus) 8% Rio de Janeiro 7% Norcon Rossi (Aracaju/Recife) 6% Curitiba 6% Brasília 5% Belo Horizonte 3% Vendas Brutas (% Rossi) 9M13 | Regiões Metropolitanas
  • 8.
    Finished 66% Under Construction 34% Rescisão (%Rossi) 9M13 Non-StrategicRegions: 21% Brasília: 11% Porto Alegre: 9% São Paulo: 7% Campinas: 6% Curitiba: 5% Rio de Janeiro: 3% Belo Horizonte:1% CapitalRossi: 1% 41% 38% 32% 34% 59% 62% 68% 66% 4Q12 1Q13 2Q13 3Q13 Rossi Vendas | Rescissions (%) Rossi Vendas Other 8 Sales Cancellation R$ million Construction stage breakdown(% Rossi) | 9M13 Breakdown by Broker 323 177 777 468 80 51 208 135 3Q12 3Q13 9M12 9M13 Rescission |R$ MM Rossi Partners 404 -44% 228 985 -39% 603
  • 9.
    9 Land Bank Residential Developments: Rossi´s PSV of R$ 8.8 billion, equivalent to approximately 3 years of launches  Only land that passed the new feasibility tests as per the company’s new standards was retained  Decrease of 4% in land disablement Land Bank Breakdown Product Breakdown (% Rossi)Metropolitan Region Breakdown (% Rossi) Norcon Rossi (Aracaju/Recife) 27% Porto Alegre 18% Campinas 16% Rio de Janeiro 15% São Paulo 11% Belo Horizonte 5% CapitalRossi (Manaus) 4% Brasília 3% PSV Rossi | R$ PSV 100% PSV RR Units Land Bank 20.489 15.438 76.468 Rossi Residencial 10.889 8.751 26.151 Disablement 2.583 1.871 11.401 Rossi Urbanizadora 7.016 4.817 38.916 R$ 350 to R$ 500 k 26% R$ 200 to R$ 350 k 25% > R$ 750k 20% R$ 650 to R$ 750k 17% R$ 500 to R$ 650k 11%
  • 10.
  • 11.
    19 2 133 39 3Q12 3Q13 9M129M13 -70% -89% 117 136 492 405 3Q12 3Q13 9M12 9M13 +16% -18% 221 208 845 649 3Q12 3Q13 9M12 9M13 -6% -23% 721 736 2.347 2.155 3Q12 3Q13 9M12 9M13 +2% -8% 11 Financial Highlights¹ Net Revenues (R$ million) Gross Profit (R$ million) and Gross Margin² (%) Net Income (R$ million) and Net Margin (%)Adjusted EBITDA (R$ million) and Adjusted EBITDA Margin (%) 30.7% 28.2% 36.0% 30.1% 16.3% 18.5% 20.9% 18.8% 2.6% 5.7% 1.8% 0.3% ¹ Consolidated proporcionally results ² Adjusted Gross Margin by capitalized interests
  • 12.
    Financial Transfers andCash Generation Financial Transfers (R$ MM) | 100% Cash Flow (R$ MM) | 100% 12 Cash Flow¹ R$ MM 9M13 3Q13 2Q13 1Q13 Cash Generation (Burn) ¹ (125) (54) (10) (61) (+) Urban Development Expenses 9 5 2 2 (+) Commercial Properties Expenses 27 14 2 11 (+) Capital Increase Expenses 24 24 Operational Cash Generation (Burn) (65) (35) (6) (24) (+) Interest Expenses 264 79 119 65 Operational Cash Generation (Burn) ex interests 199 45 113 41 ¹ Proportional Net Debt variation 458 461 661 537 469 613 749 1Q12 2Q12 3Q12 4Q12 1Q13 2Q13 3Q13 Financial Transfers (R$ MM) | 100% +60% 606 747 768 2.121 1Q13 2Q13 3Q13 9M13 Cash flow(R$ MM) | 100% +27%
  • 13.
    Liquidity ¹ 13 Indebtedness R$ million3Q13 2Q13 Var. (%) Gross Debt 4.010 4.074 -2% Cash and Equivalents 1.052 1.170 -10% Net Debt 2.958 2.904 2% Net Debt / Equity 123,9% 122,1% 1,9 p.p Debt Profile¹Debt Schedule ¹ | R$ MM ¹ Proportional figures ² Consolidation by IFRS 10 R$ million 3Q13 2Q13 Var. (%) Gross Debt 3.346 3.463 -3% Cash and Equivalents 820 1.005 -18% Net Debt 2.526 2.459 3% Net Debt / Equity 103,0% 100,2% 2,,8 p.p. Liquidity ² Corporate 56% SFH 44% 293 1.015 566 363 117 752 499 405 2013 2014 2015 +2016 Cronograma de Endividamento | R$ MM Corporate Debt SFH 411 1,767 1,064 768
  • 14.
    Equipe de RI Obrigado!IRTeam Phone: +55 (11) 4058-2502 ri@rossiresidencial.com.br www.rossiresidencial.com.br/ri IR Contacts 14