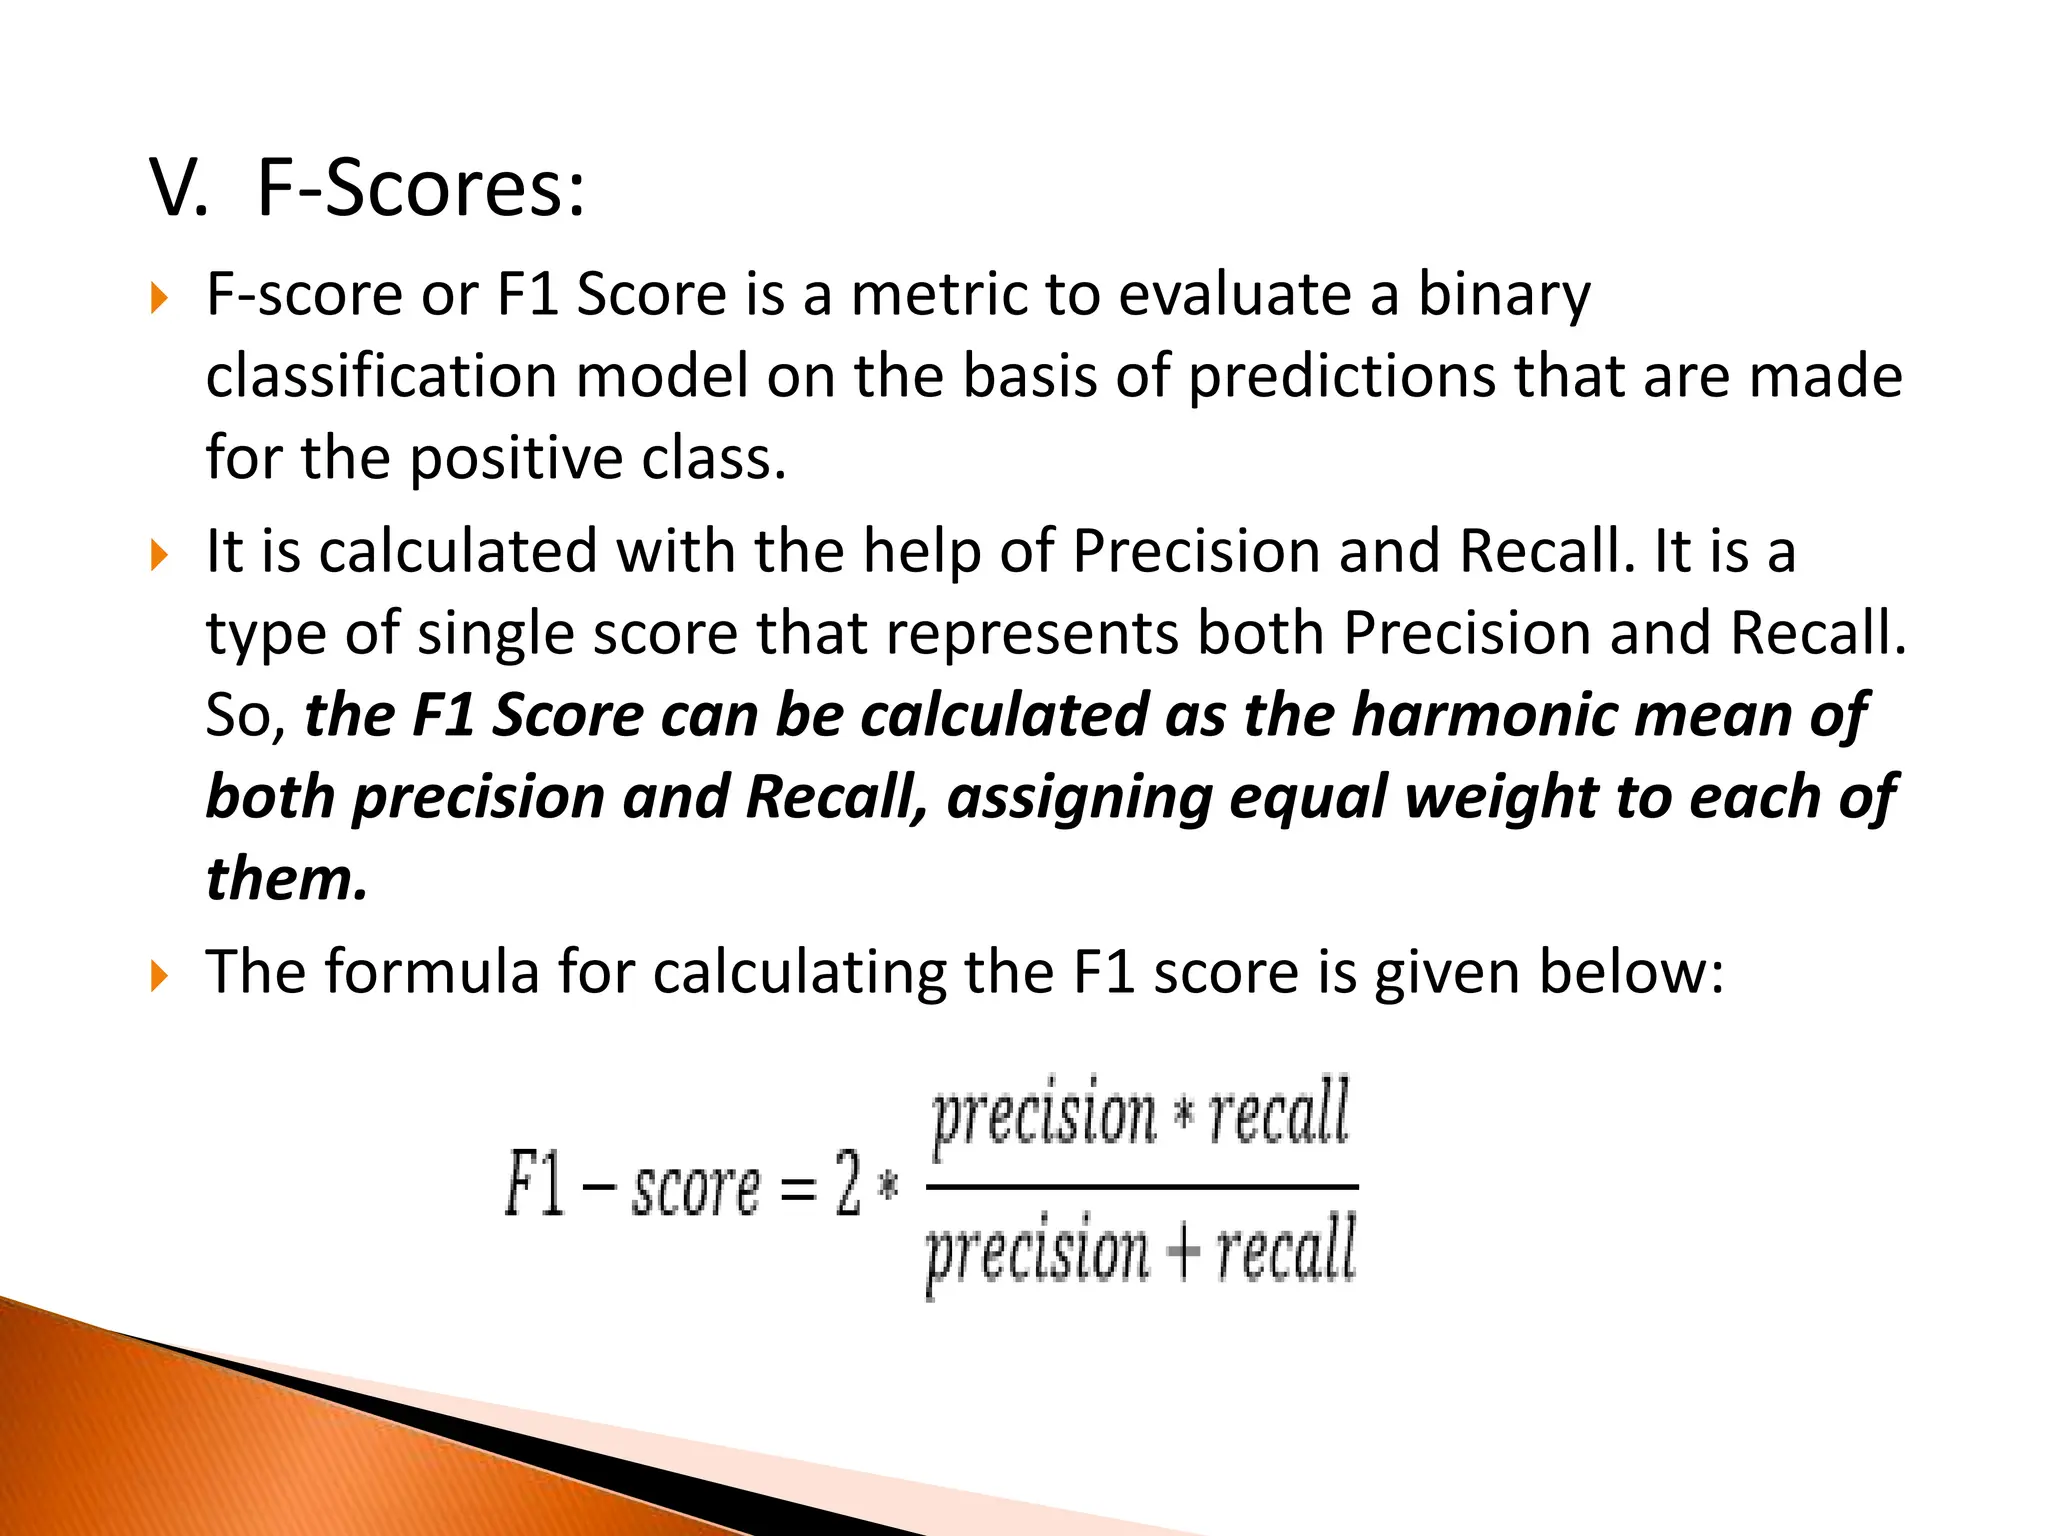
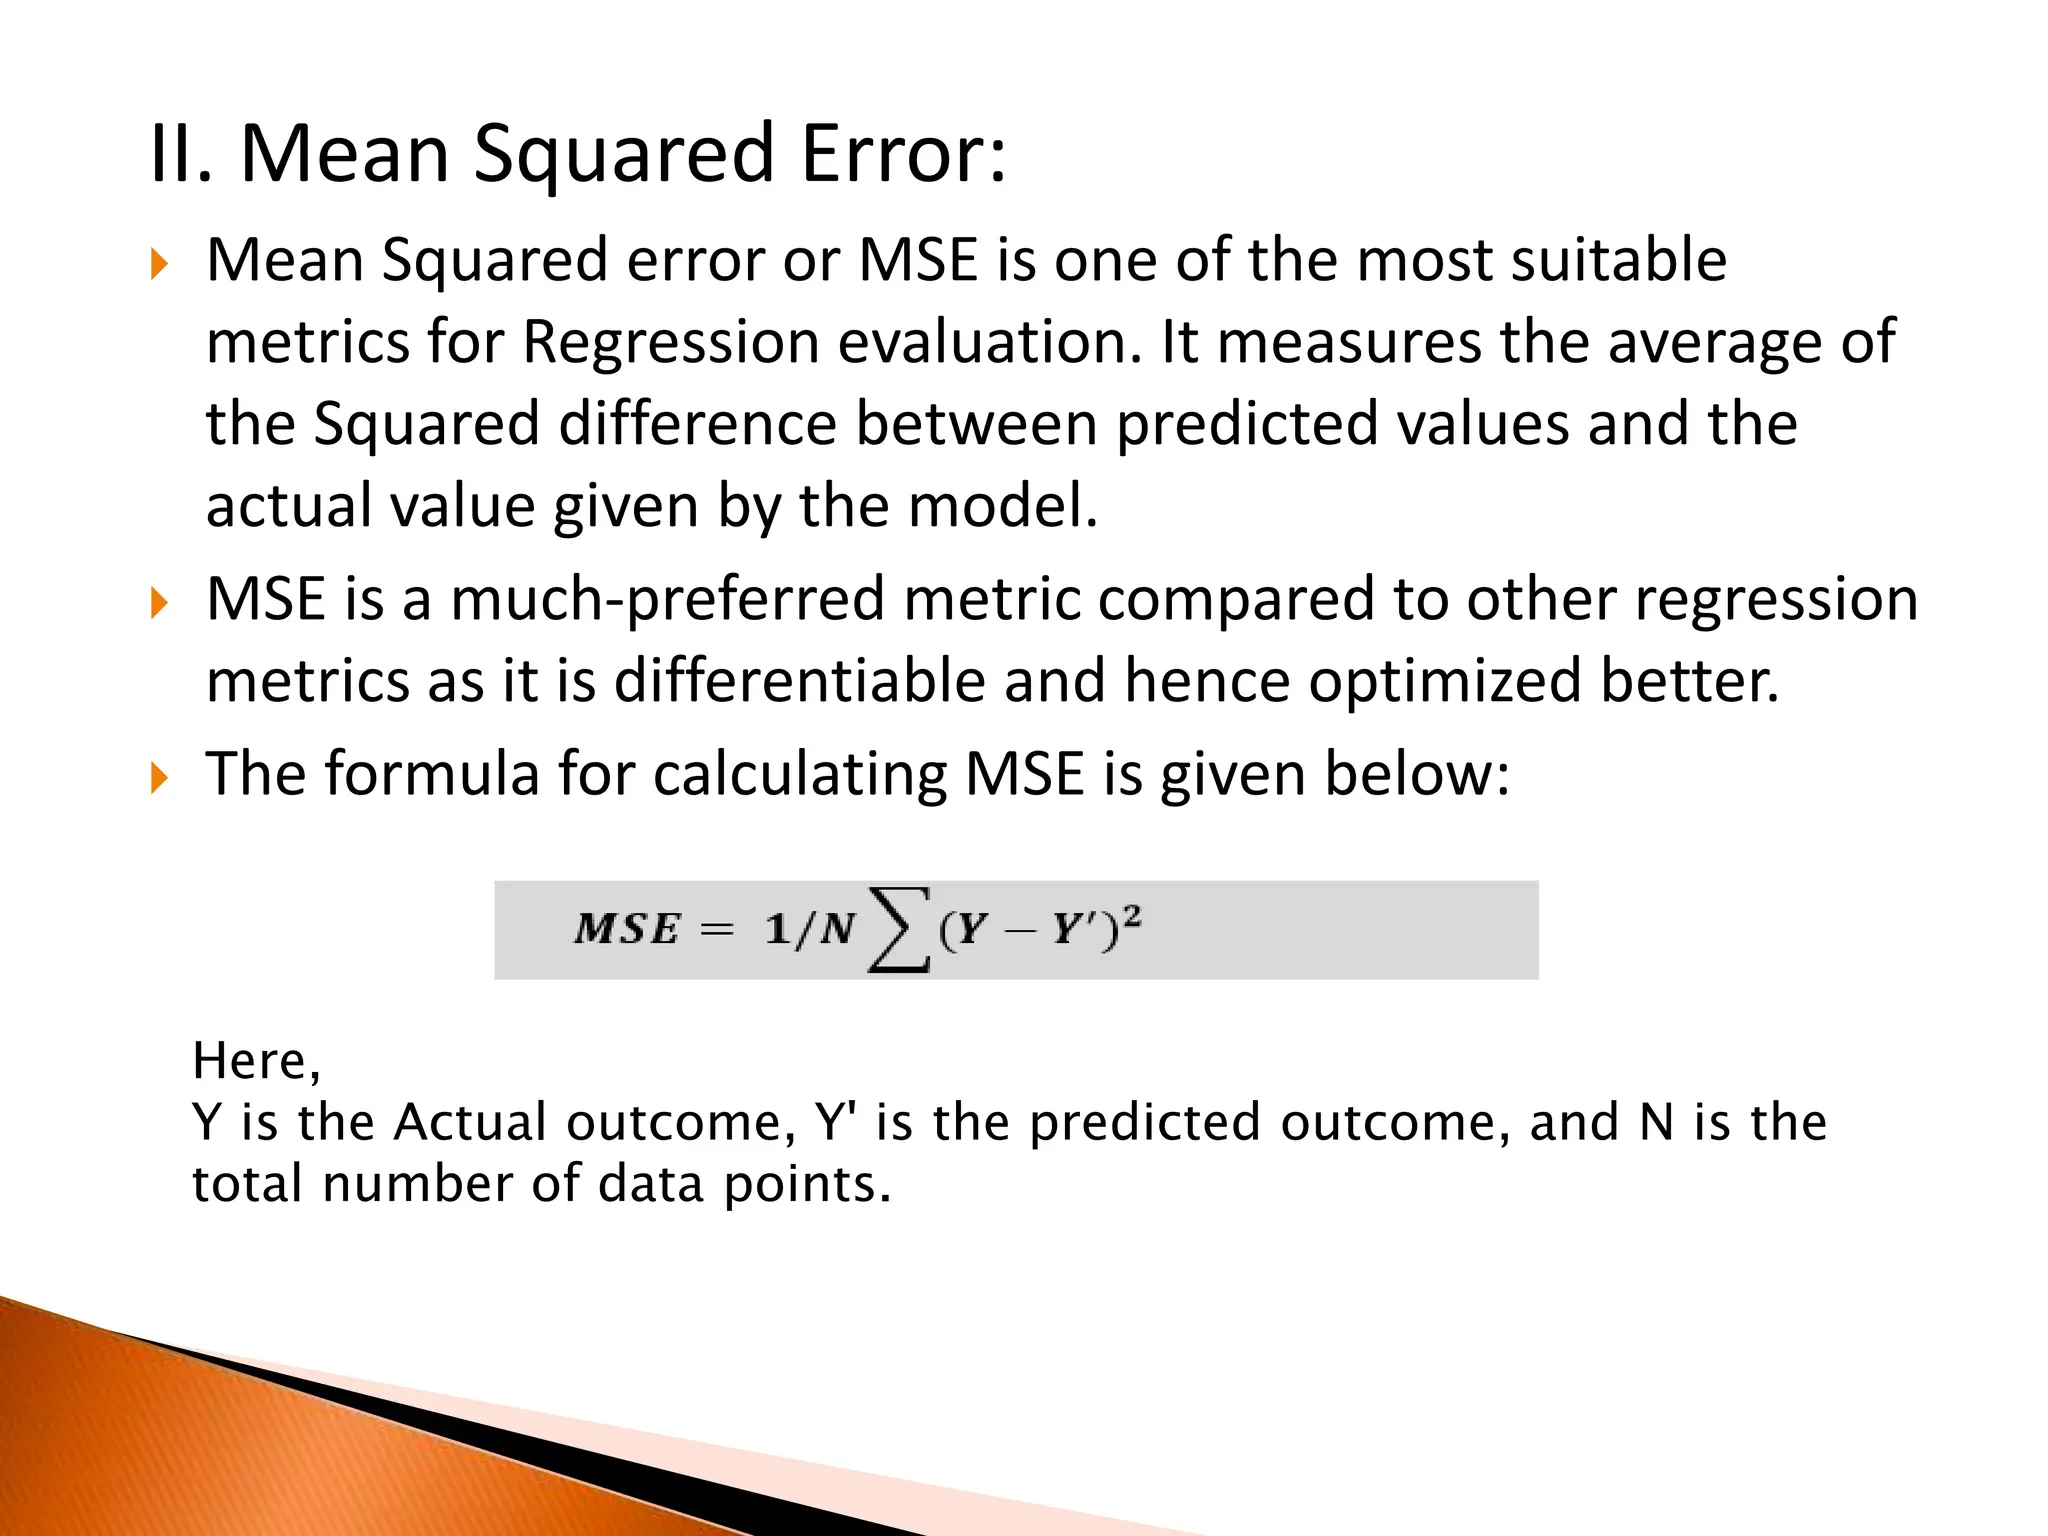
2. Evaluating the performance of a Machine learning model is
one of the important steps while building an effective ML
model.
To evaluate the performance or quality of the model,
different metrics are used, and these metrics are known as
performance metrics or evaluation metrics.
These performance metrics help us understand how well our
model has performed for the given data. In this way, we can
improve the model's performance by tuning the hyper-
parameters..
3. Each ML model aims to generalize well on unseen/new data,
and performance metrics help determine how well the model
generalizes on the new dataset.
In machine learning, each task or problem is divided
into classification and Regression.
1. Performance Metrics for Classification:
In a classification problem, the category or classes of data is
identified based on training data. The model learns from the
given dataset and then classifies the new data into classes or
groups based on the training. It predicts class labels as the
output, such as Yes or No, 0 or 1, Spam or Not Spam, etc. To
evaluate the performance of a classification model, different
metrics are used, and some of them are as follows:
4. Accuracy
Confusion Matrix
Precision
Recall
F-Score
AUC(Area Under the Curve)-ROC.
I. Accuracy:
The accuracy metric is one of the simplest Classification
metrics to implement, and it can be determined as the
number of correct predictions to the total number of
predictions.
5. II. Confusion Matrix:
A confusion matrix is a tabular representation of prediction
outcomes of any binary classifier, which is used to describe
the performance of the classification model on a set of test
data when true values are known.
6. In general, the table is divided into four terminologies, which
are as follows:
True Positive(TP): In this case, the prediction outcome is true,
and it is true in reality, also.
True Negative(TN): in this case, the prediction outcome is
false, and it is false in reality, also.
False Positive(FP): In this case, prediction outcomes are true,
but they are false in actuality.
False Negative(FN): In this case, predictions are false, and
they are true in actuality.
7. III. Precision:
The precision metric is used to overcome the limitation of
Accuracy.
The precision determines the proportion of positive
prediction that was actually correct.
It can be calculated as the True Positive or predictions that
are actually true to the total positive predictions (True
Positive and False Positive).
It can be formulated as:
8. IV. Recall or Sensitivity:
It is also similar to the Precision metric; however, it aims to
calculate the proportion of actual positive that was identified
incorrectly.
It can be calculated as True Positive or predictions that are
actually true to the total number of positives, either correctly
predicted as positive or incorrectly predicted as negative (true
Positive and false negative).
The formula for calculating Recall is given below:
9. V. F-Scores:
F-score or F1 Score is a metric to evaluate a binary
classification model on the basis of predictions that are made
for the positive class.
It is calculated with the help of Precision and Recall. It is a
type of single score that represents both Precision and Recall.
So, the F1 Score can be calculated as the harmonic mean of
both precision and Recall, assigning equal weight to each of
them.
The formula for calculating the F1 score is given below:
10. VI. AUC-ROC:
Sometimes we need to visualize the performance of the
classification model on charts; then, we can use the AUC-ROC
curve. It is one of the popular and important metrics for
evaluating the performance of the classification model.
Firstly, let's understand ROC (Receiver Operating
Characteristic curve) curve. ROC represents a graph to show
the performance of a classification model at different
threshold levels. The curve is plotted between two
parameters, which are:
True Positive Rate
False Positive Rate
11. TPR or true Positive rate is a synonym for Recall, hence can be
calculated as:
FPR or False Positive Rate can be calculated as:
To calculate value at any point in a ROC curve, we can evaluate a
logistic regression model multiple times with different classification
thresholds, but this would not be much efficient. So, for this, one
efficient method is used, which is known as AUC.
12. AUC: Area Under the ROC curve:
AUC is known for Area Under the ROC curve. As its name
suggests, AUC calculates the two-dimensional area under the
entire ROC curve, as shown below image:
13. AUC calculates the performance across all the thresholds and
provides an aggregate measure.
The value of AUC ranges from 0 to 1. It means a model with
100% wrong prediction will have an AUC of 0.0, whereas
models with 100% correct predictions will have an AUC of 1.0.
14. 2. Performance Metrics for Regression:
Regression is a supervised learning technique that aims to
find the relationships between the dependent and
independent variables.
A predictive regression model predicts a numeric or discrete
value. The metrics used for regression are different from the
classification metrics.
It means we cannot use the Accuracy metric (explained
above) to evaluate a regression model; instead, the
performance of a Regression model is reported as errors in
the prediction.
15. Following are the popular metrics that are used to evaluate
the performance of Regression models.
Mean Absolute Error
Mean Squared Error
R2 Score
Adjusted R2.
I. Mean Absolute Error (MAE):
Mean Absolute Error or MAE is one of the simplest metrics,
which measures the absolute difference between actual and
predicted values, where absolute means taking a number as
Positive.
16. The below formula is used to calculate MAE:
Here,
Y is the Actual outcome, Y' is the predicted outcome, and N is the
total number of data points.
MAE is much more robust for the outliers. One of the limitations of
MAE is that it is not differentiable, so for this, we need to apply
different optimizers such as Gradient Descent. However, to
overcome this limitation, another metric can be used, which is
Mean Squared Error or MSE.
17. II. Mean Squared Error:
Mean Squared error or MSE is one of the most suitable
metrics for Regression evaluation. It measures the average of
the Squared difference between predicted values and the
actual value given by the model.
MSE is a much-preferred metric compared to other regression
metrics as it is differentiable and hence optimized better.
The formula for calculating MSE is given below:
Here,
Y is the Actual outcome, Y' is the predicted outcome, and N is the
total number of data points.
18. III. R Squared Score:
R squared error is also known as Coefficient of Determination,
which is another popular metric used for Regression model
evaluation. The R-squared metric enables us to compare our
model with a constant baseline to determine the
performance of the model. To select the constant baseline,
we need to take the mean of the data and draw the line at the
mean.
The R squared score will always be less than or equal to 1
without concerning if the values are too large or small.
19. IV. Adjusted R Squared:
Adjusted R squared, as the name suggests, is the improved
version of R squared error. R square has a limitation of
improvement of a score on increasing the terms, even though
the model is not improving, and it may mislead the data
scientists.
To overcome the issue of R square, adjusted R squared is
used, which will always show a lower value than R². It is
because it adjusts the values of increasing predictors and only
shows improvement if there is a real improvement.
20. We can calculate the adjusted R squared as follows:
Here,
n is the number of observations
k denotes the number of independent variables
and Ra
2 denotes the adjusted R.