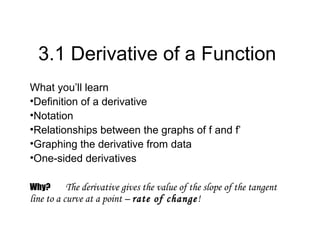
The document defines the derivative of a function and discusses:
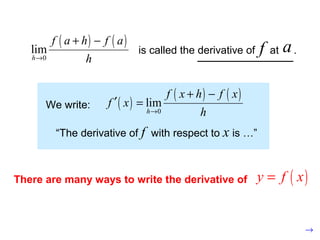
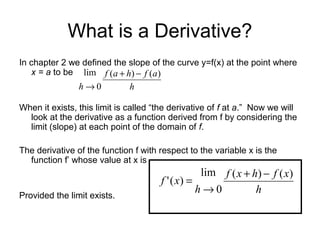
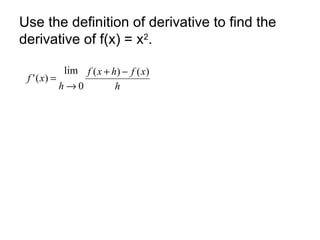
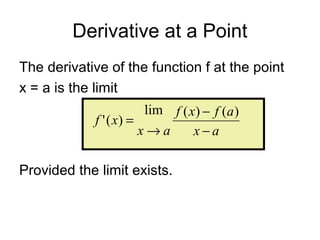
- The definition of the derivative as the limit of the slope between two points as they approach each other.
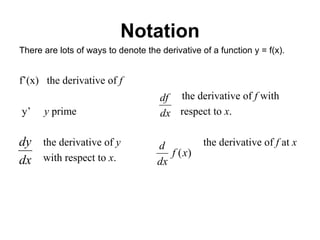
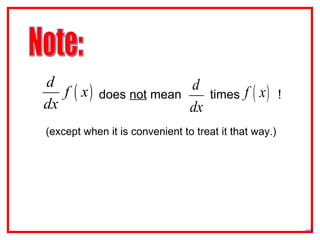
- Notation used to represent derivatives, including f'(x), dy/dx, and df/dx.
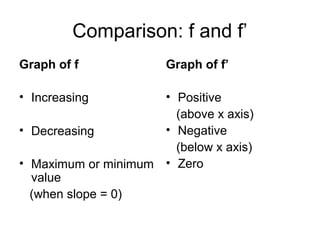
- How the graph of a function's derivative f' relates to the graph of the original function f - where f' is positive/negative/zero corresponds to parts of f that are increasing/decreasing/at an extremum.
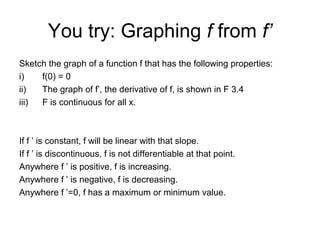
- How to graph f given a graph of its derivative f' by sketching the curve that matches the behavior of f' at each point.
- One-sided derivatives at endpoints of functions defined


![Graphing the Derivative from Data
You are given a table of data.
Create a second table, finding the slopes
between each data points.
Plot f’(x) by plotting your points
(midpoint between 2 data points, slope at midpoint)
])/[],([ 21 xyxx ∆∆−](https://image.slidesharecdn.com/3-160119184400/85/3-1-derivative-of-a-function-19-320.jpg)

![One-Sided Derivatives
A function y = f(x) is differentiable on a closed interval [a,b]
if it has a derivative at every interior point of the interval
and if the right hand derivative at a and the left hand
derivative at b exist.
As with limits, if the functions right-hand and left-hand
derivatives exist and are equal at a point, then the
function is differentiable at that point.](https://image.slidesharecdn.com/3-160119184400/85/3-1-derivative-of-a-function-21-320.jpg)


![[DSC Europe 25] Dragan Jerosimovic - The Anatomy of a Narrative Simulation.pdf](https://cdn.slidesharecdn.com/ss_thumbnails/vzputuprdqr6zwbrwdcw-1-dragan-jerosimovic-the-anatomy-of-a-narrative-simulation-260114111931-9d04fba2-thumbnail.jpg?width=640&height=640&fit=bounds)
![[DSC Europe 25] Ivica Milaric - The Future of Gaming and AI Tools.pptx](https://cdn.slidesharecdn.com/ss_thumbnails/tijgzsmgse2kj2y5pzzp-5-ivica-milaric-the-future-of-gaming-x-ai-tools-260114111931-87c2b3ac-thumbnail.jpg?width=640&height=640&fit=bounds)


![[DSC Europe 25] Stefan Brankovic - #ResumeIsDead. AI-Powered Interviews and C...](https://cdn.slidesharecdn.com/ss_thumbnails/qnmbsv0xq3uysdrq3sev-2-stefan-brankovic-job-bolt-260114111931-a065aa3d-thumbnail.jpg?width=640&height=640&fit=bounds)

![[DSC Europe 25] Slobodan Dolinic - Smart and Intelligent Green Region.pptx](https://cdn.slidesharecdn.com/ss_thumbnails/0bribinjsp6ghwtvsvor-2-sigre-slobodan-dolinic-260115093812-c9c10e90-thumbnail.jpg?width=640&height=640&fit=bounds)
![[DSC Europe 25] Nikola Vasiljevic - Player segmentation by combat playstyles ...](https://cdn.slidesharecdn.com/ss_thumbnails/mnvbf0yvrwaqsipzrrv3-2-nikola-vasiljevic-player-segmentation-by-playstyles-in-action-shooter-games-260114111931-b4d766cd-thumbnail.jpg?width=640&height=640&fit=bounds)


