Download as PDF, PPTX

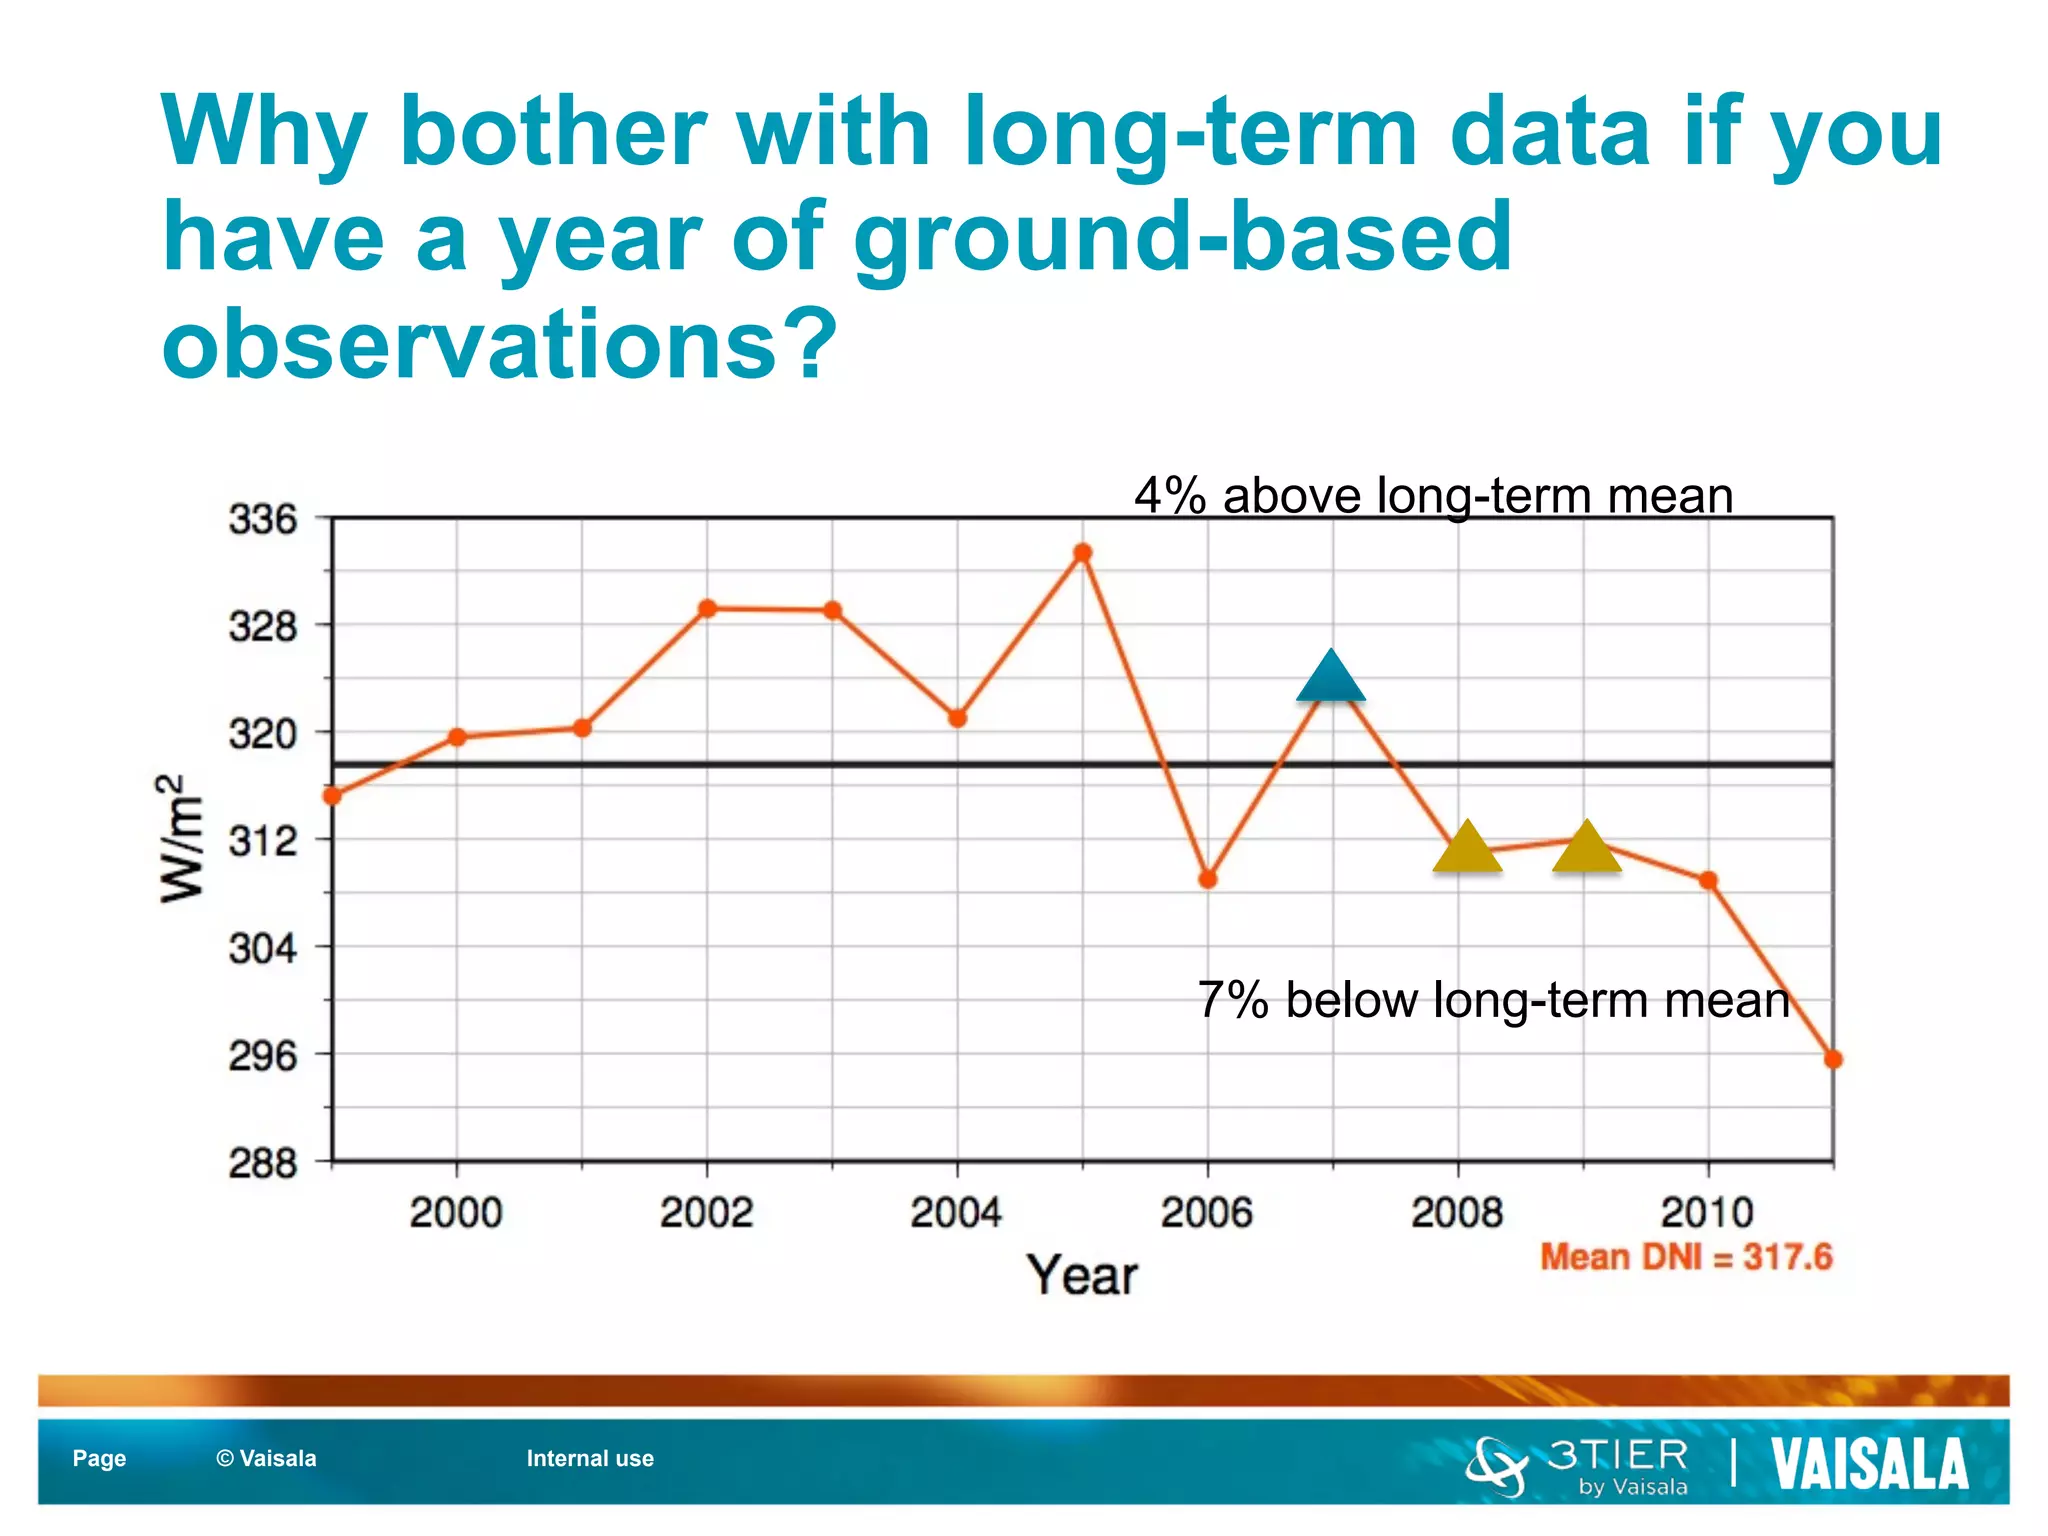
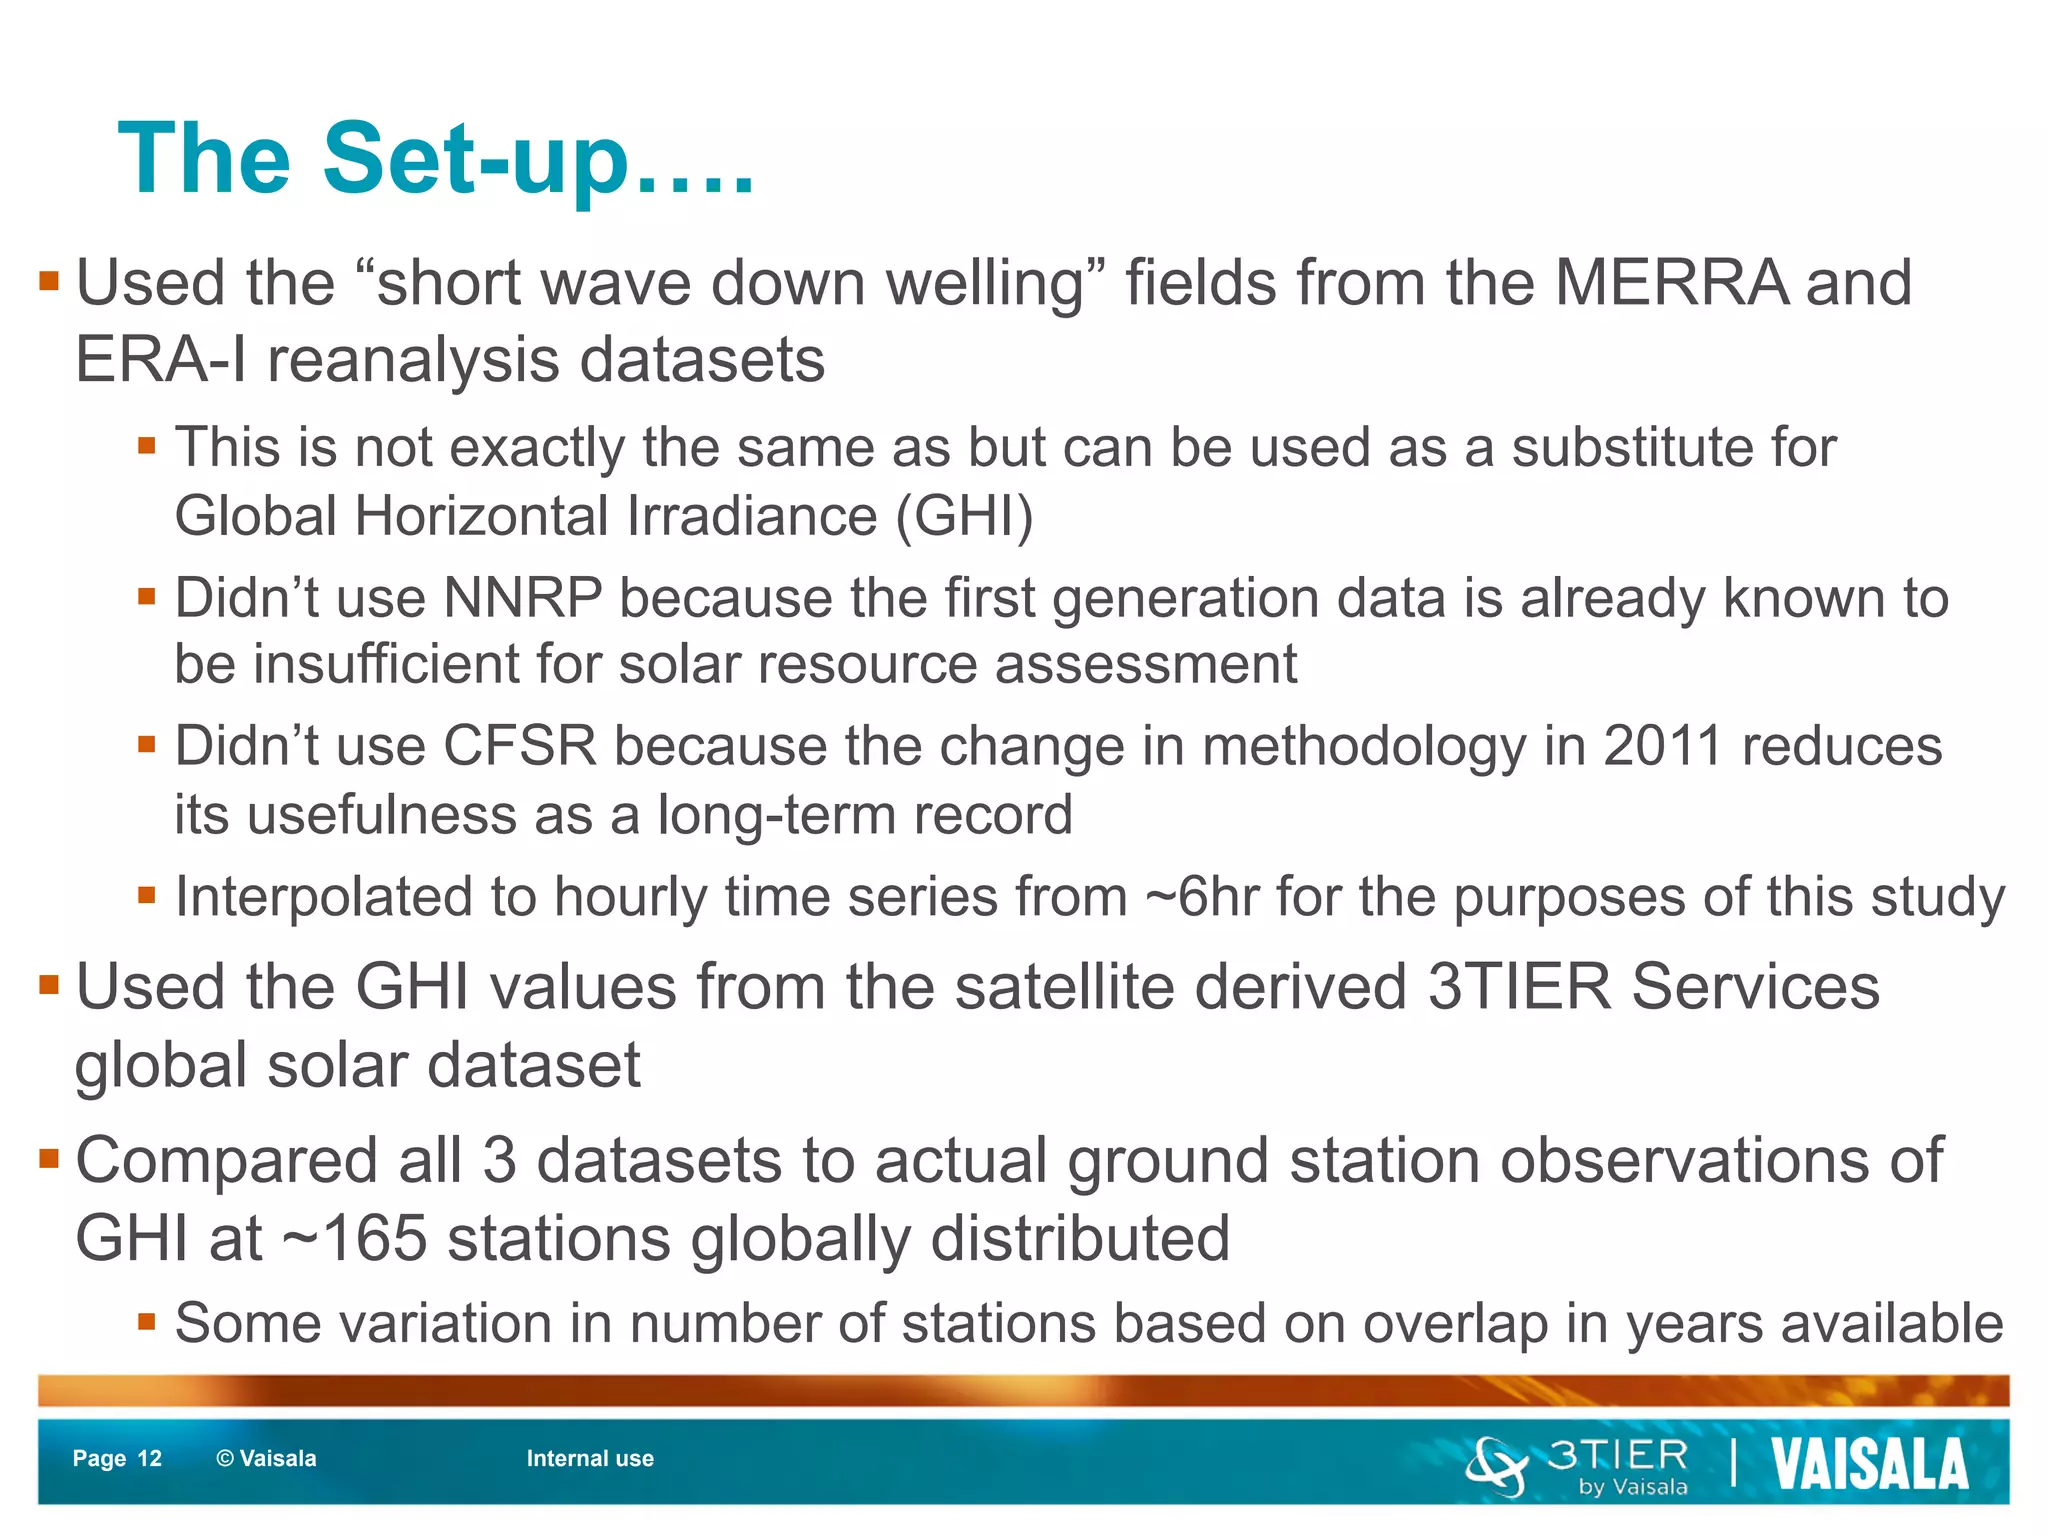
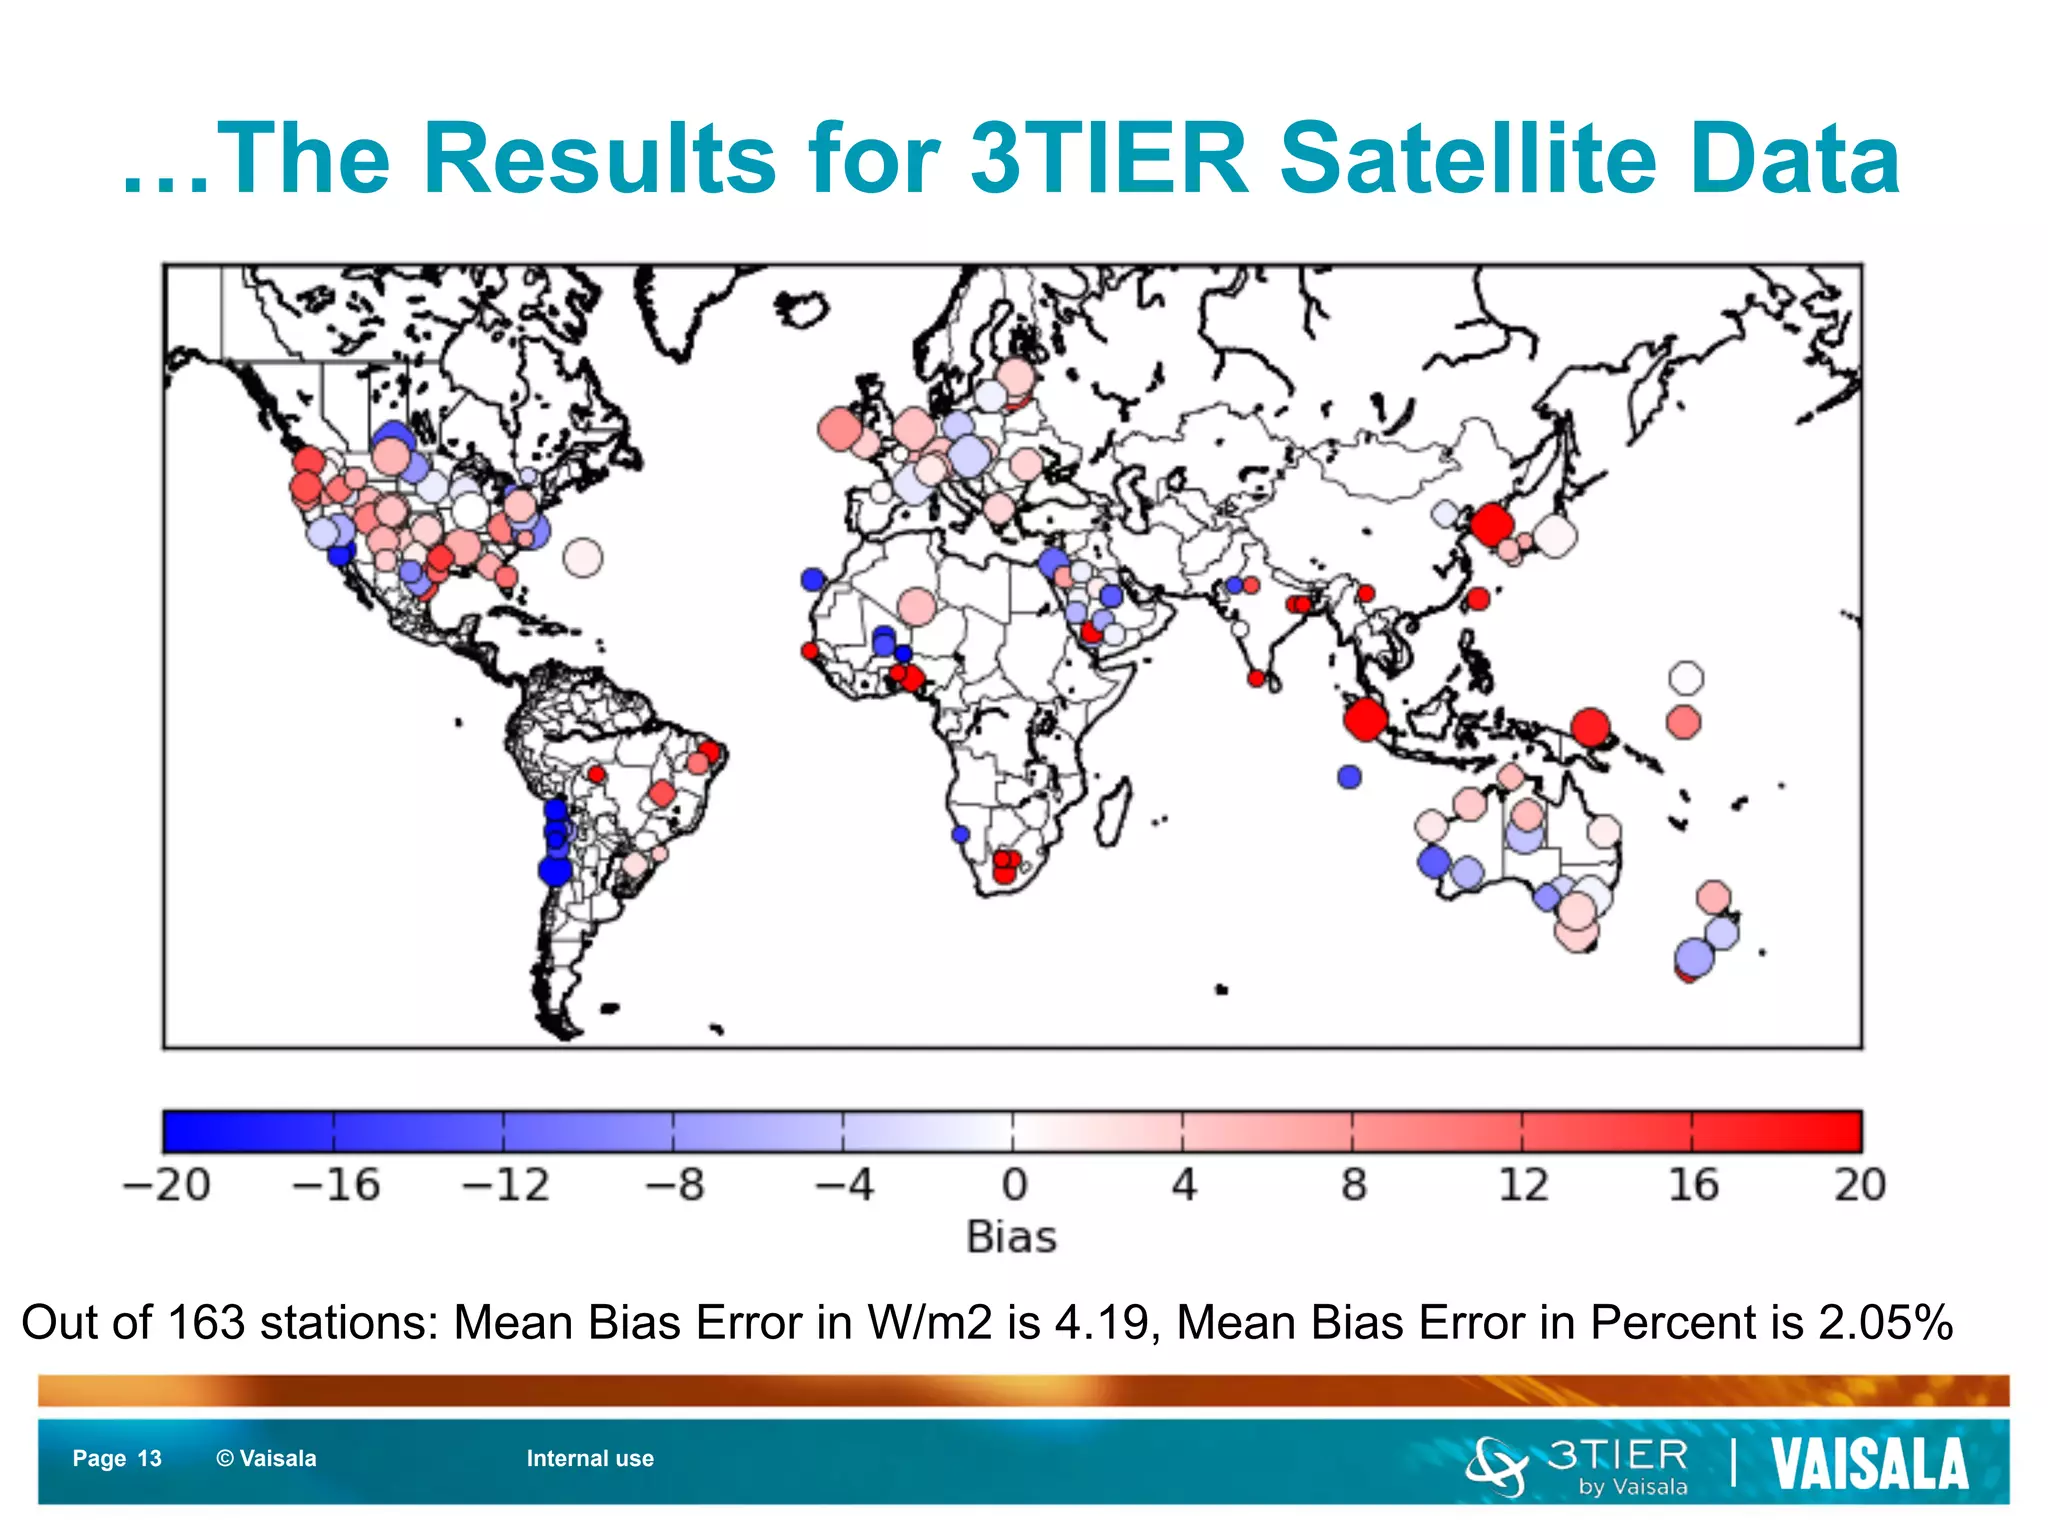
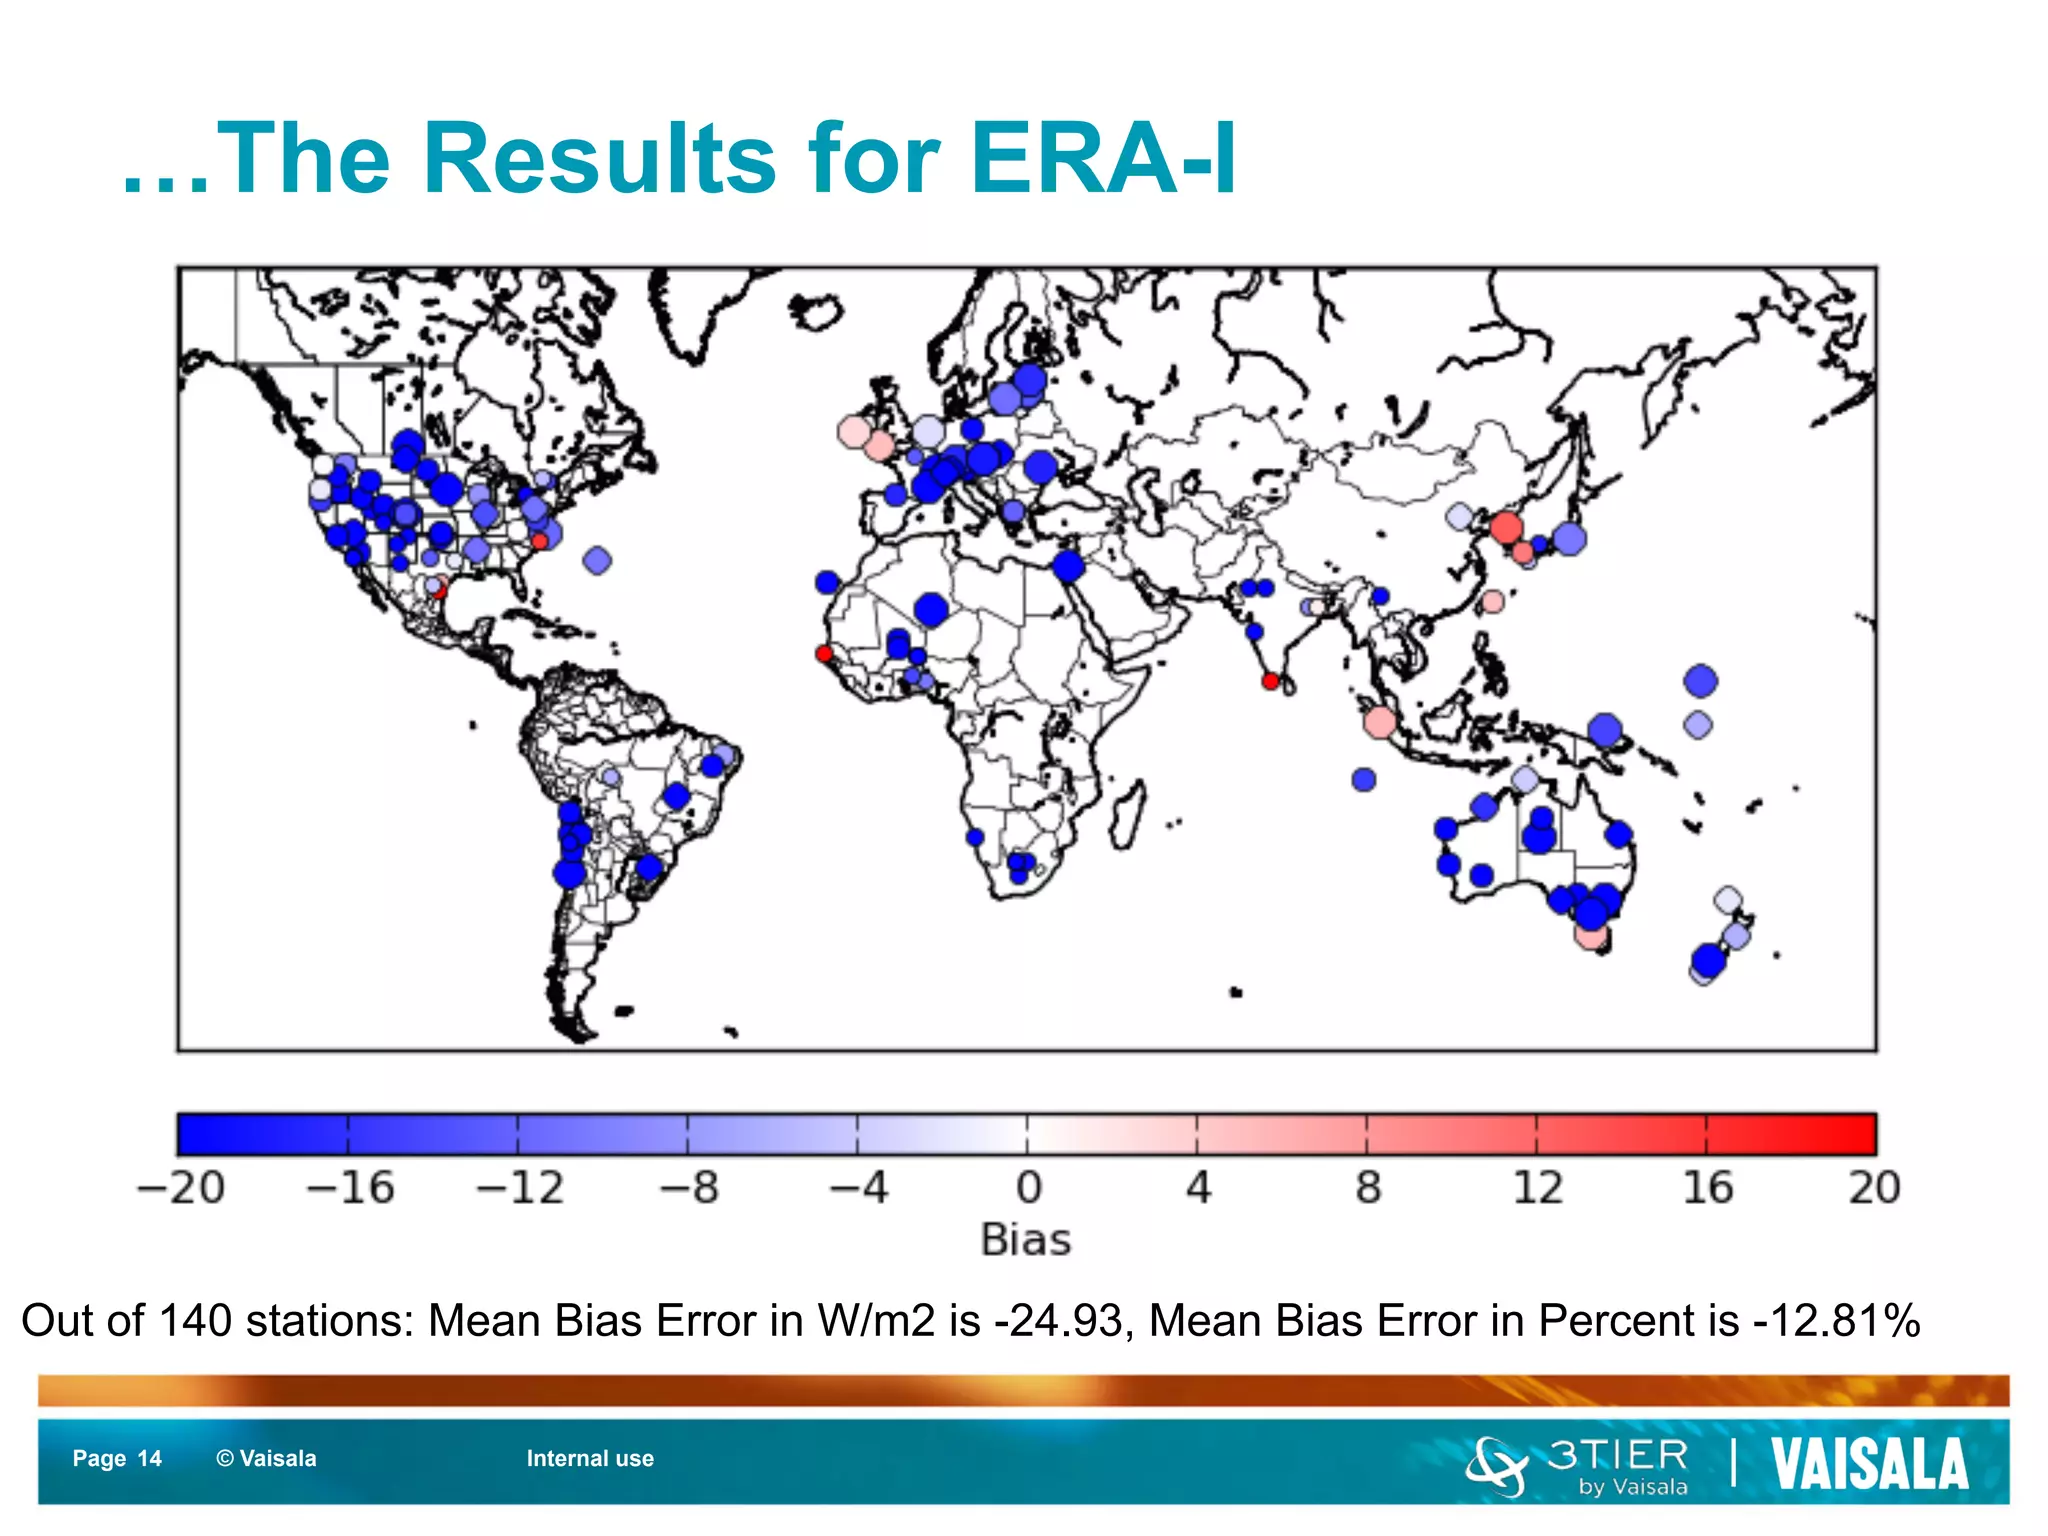
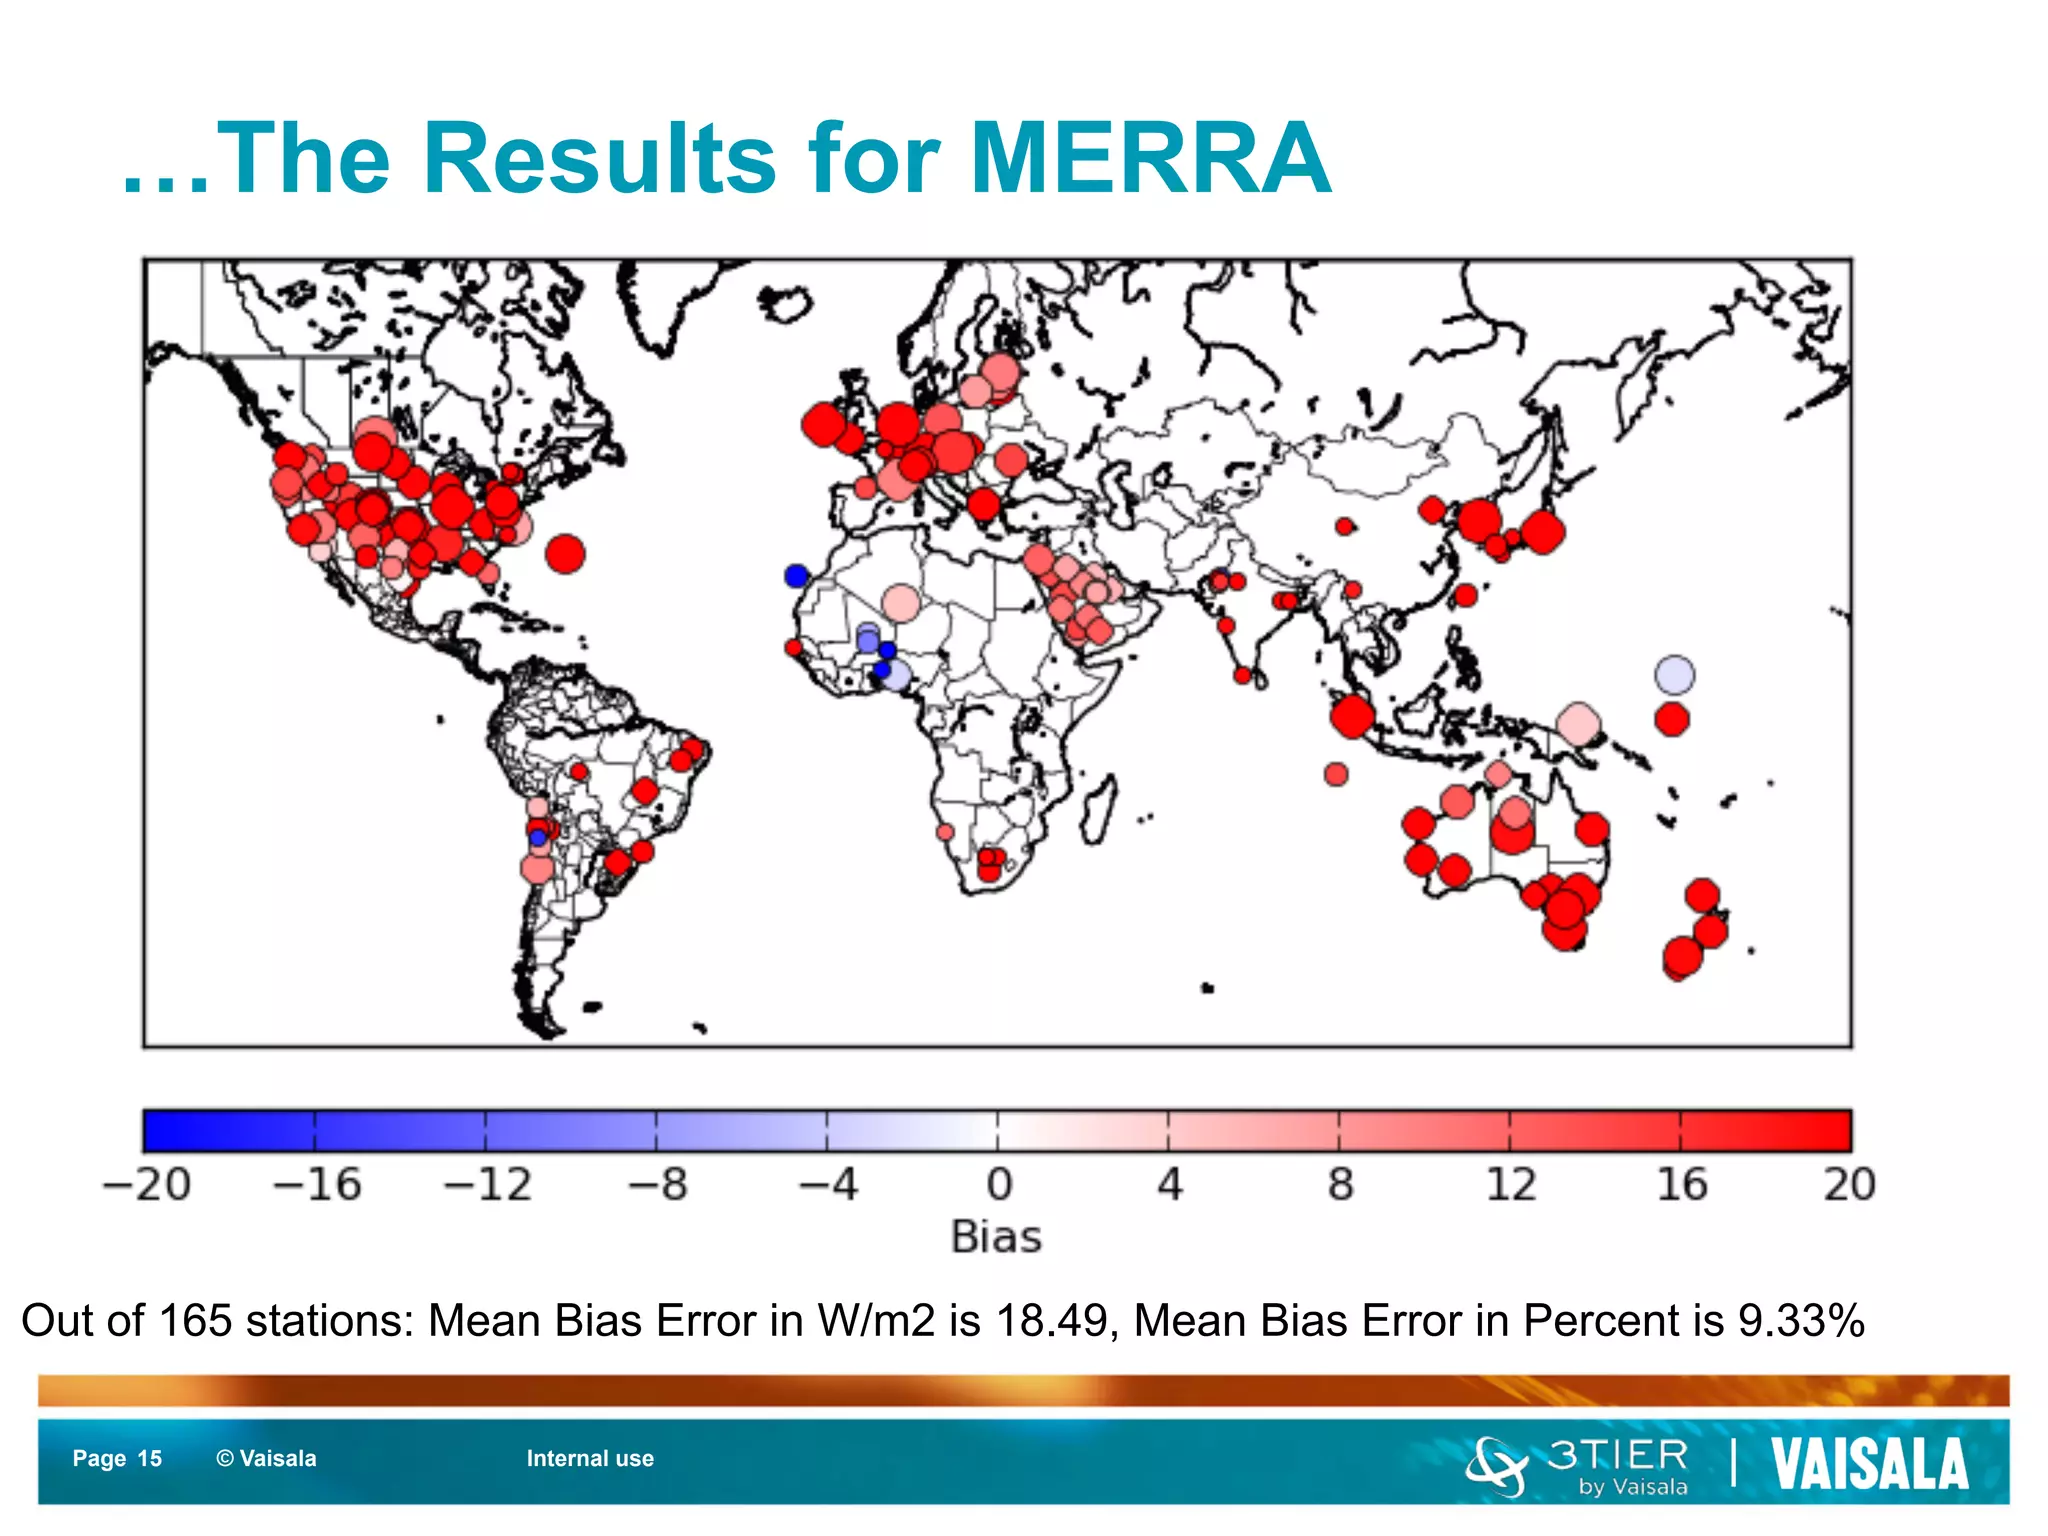
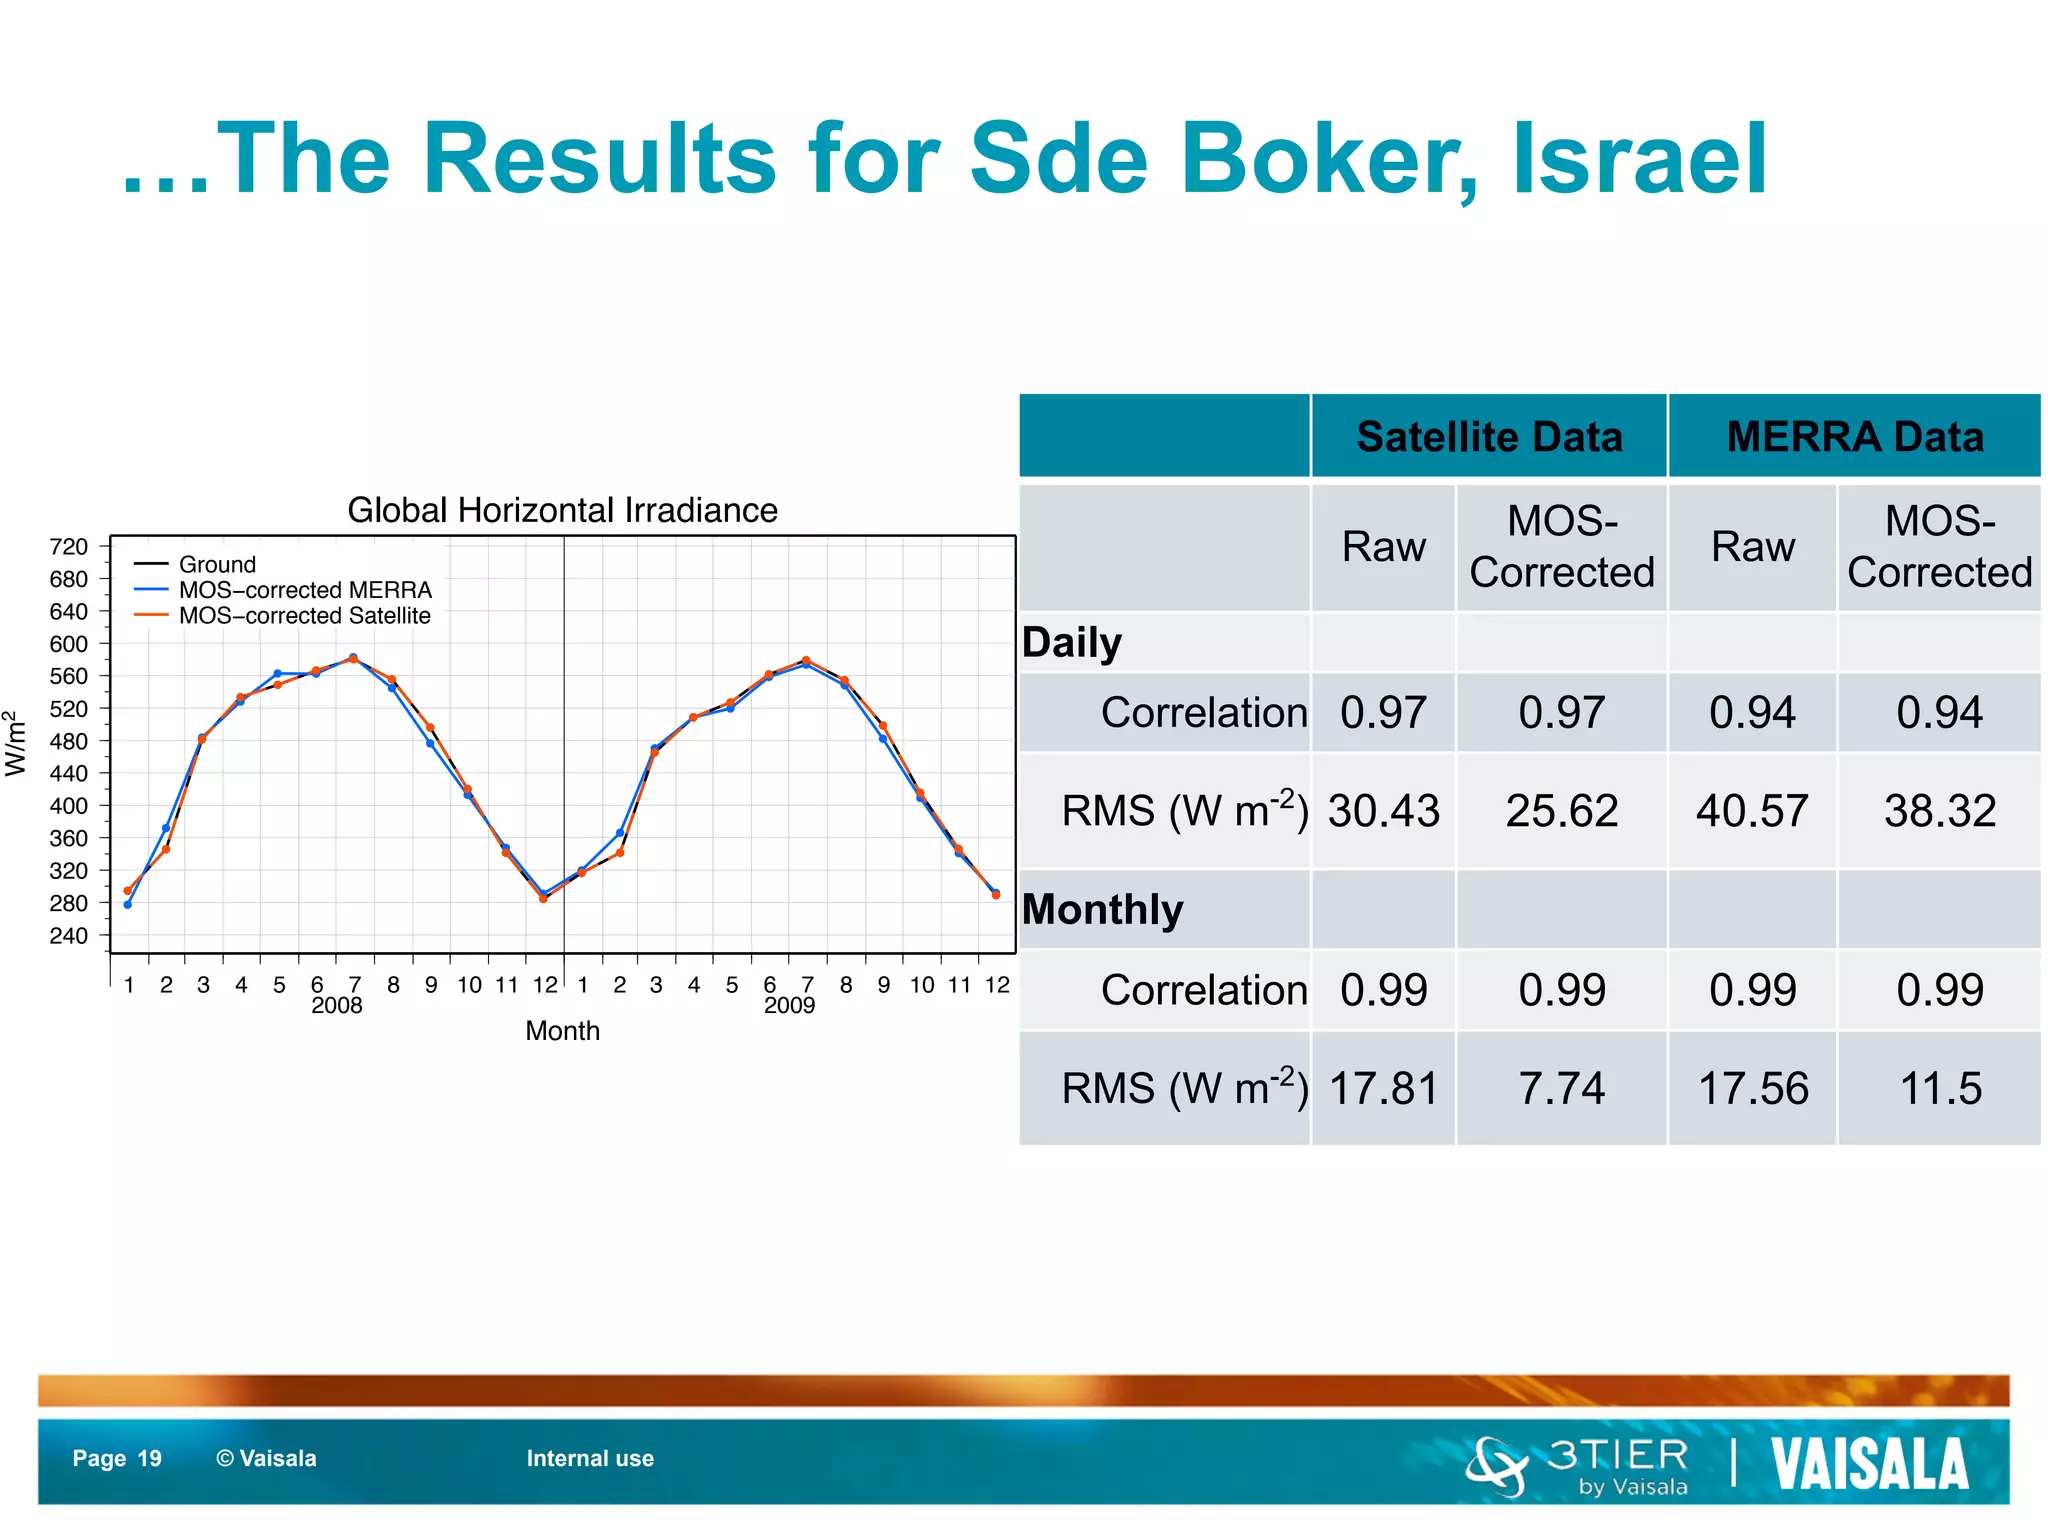

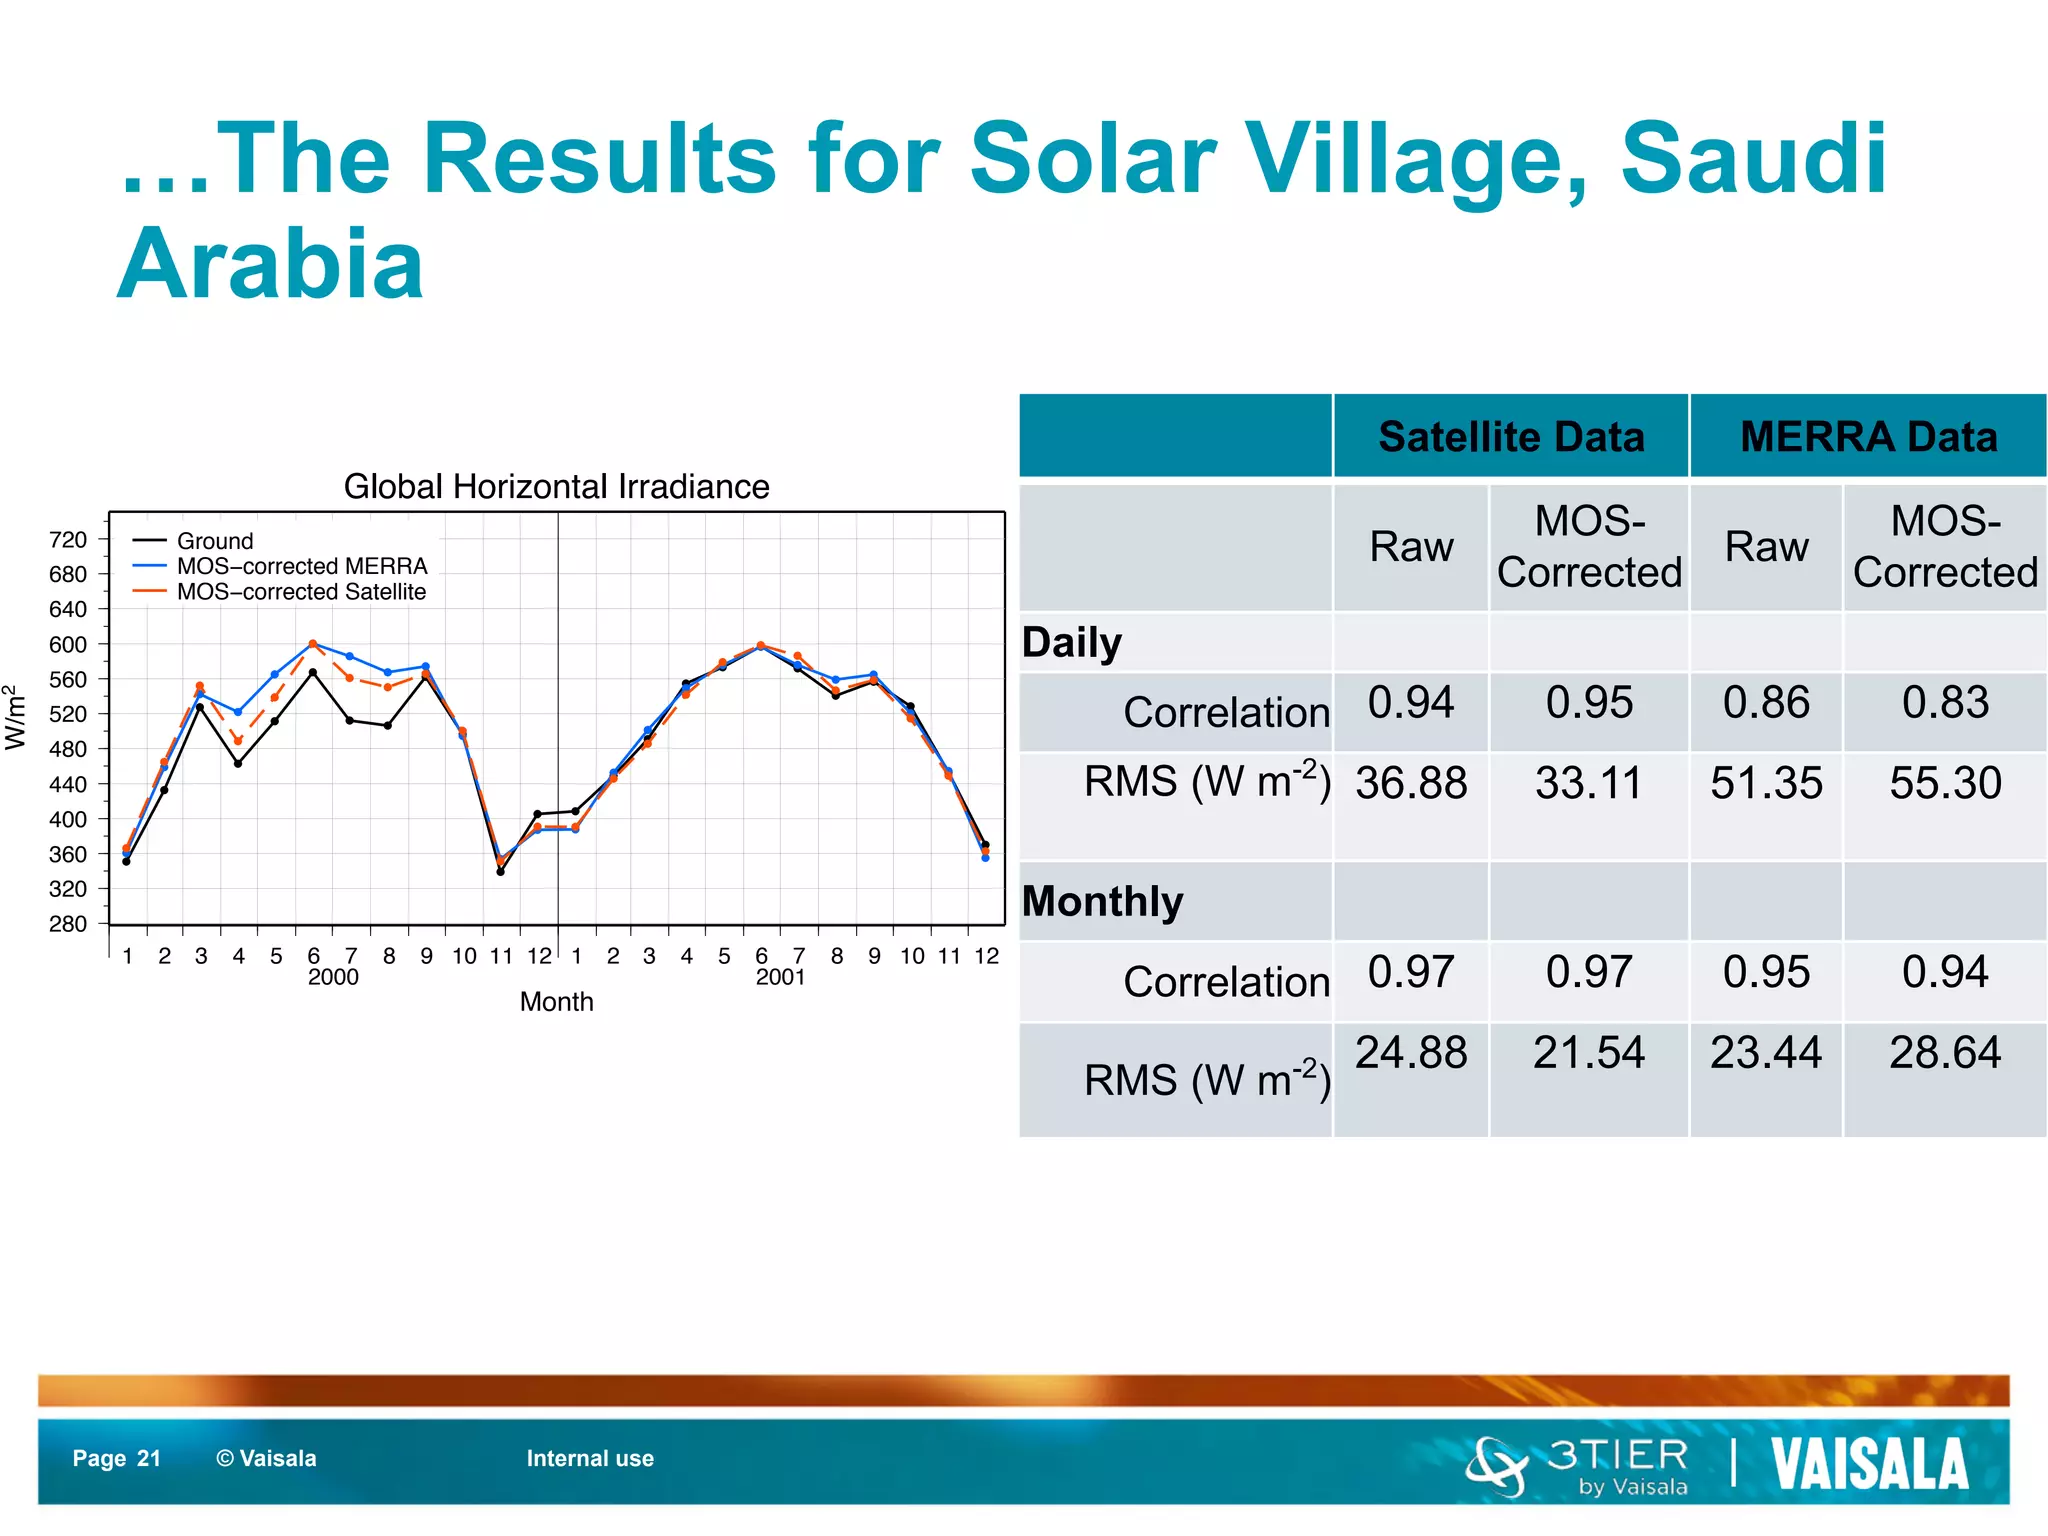

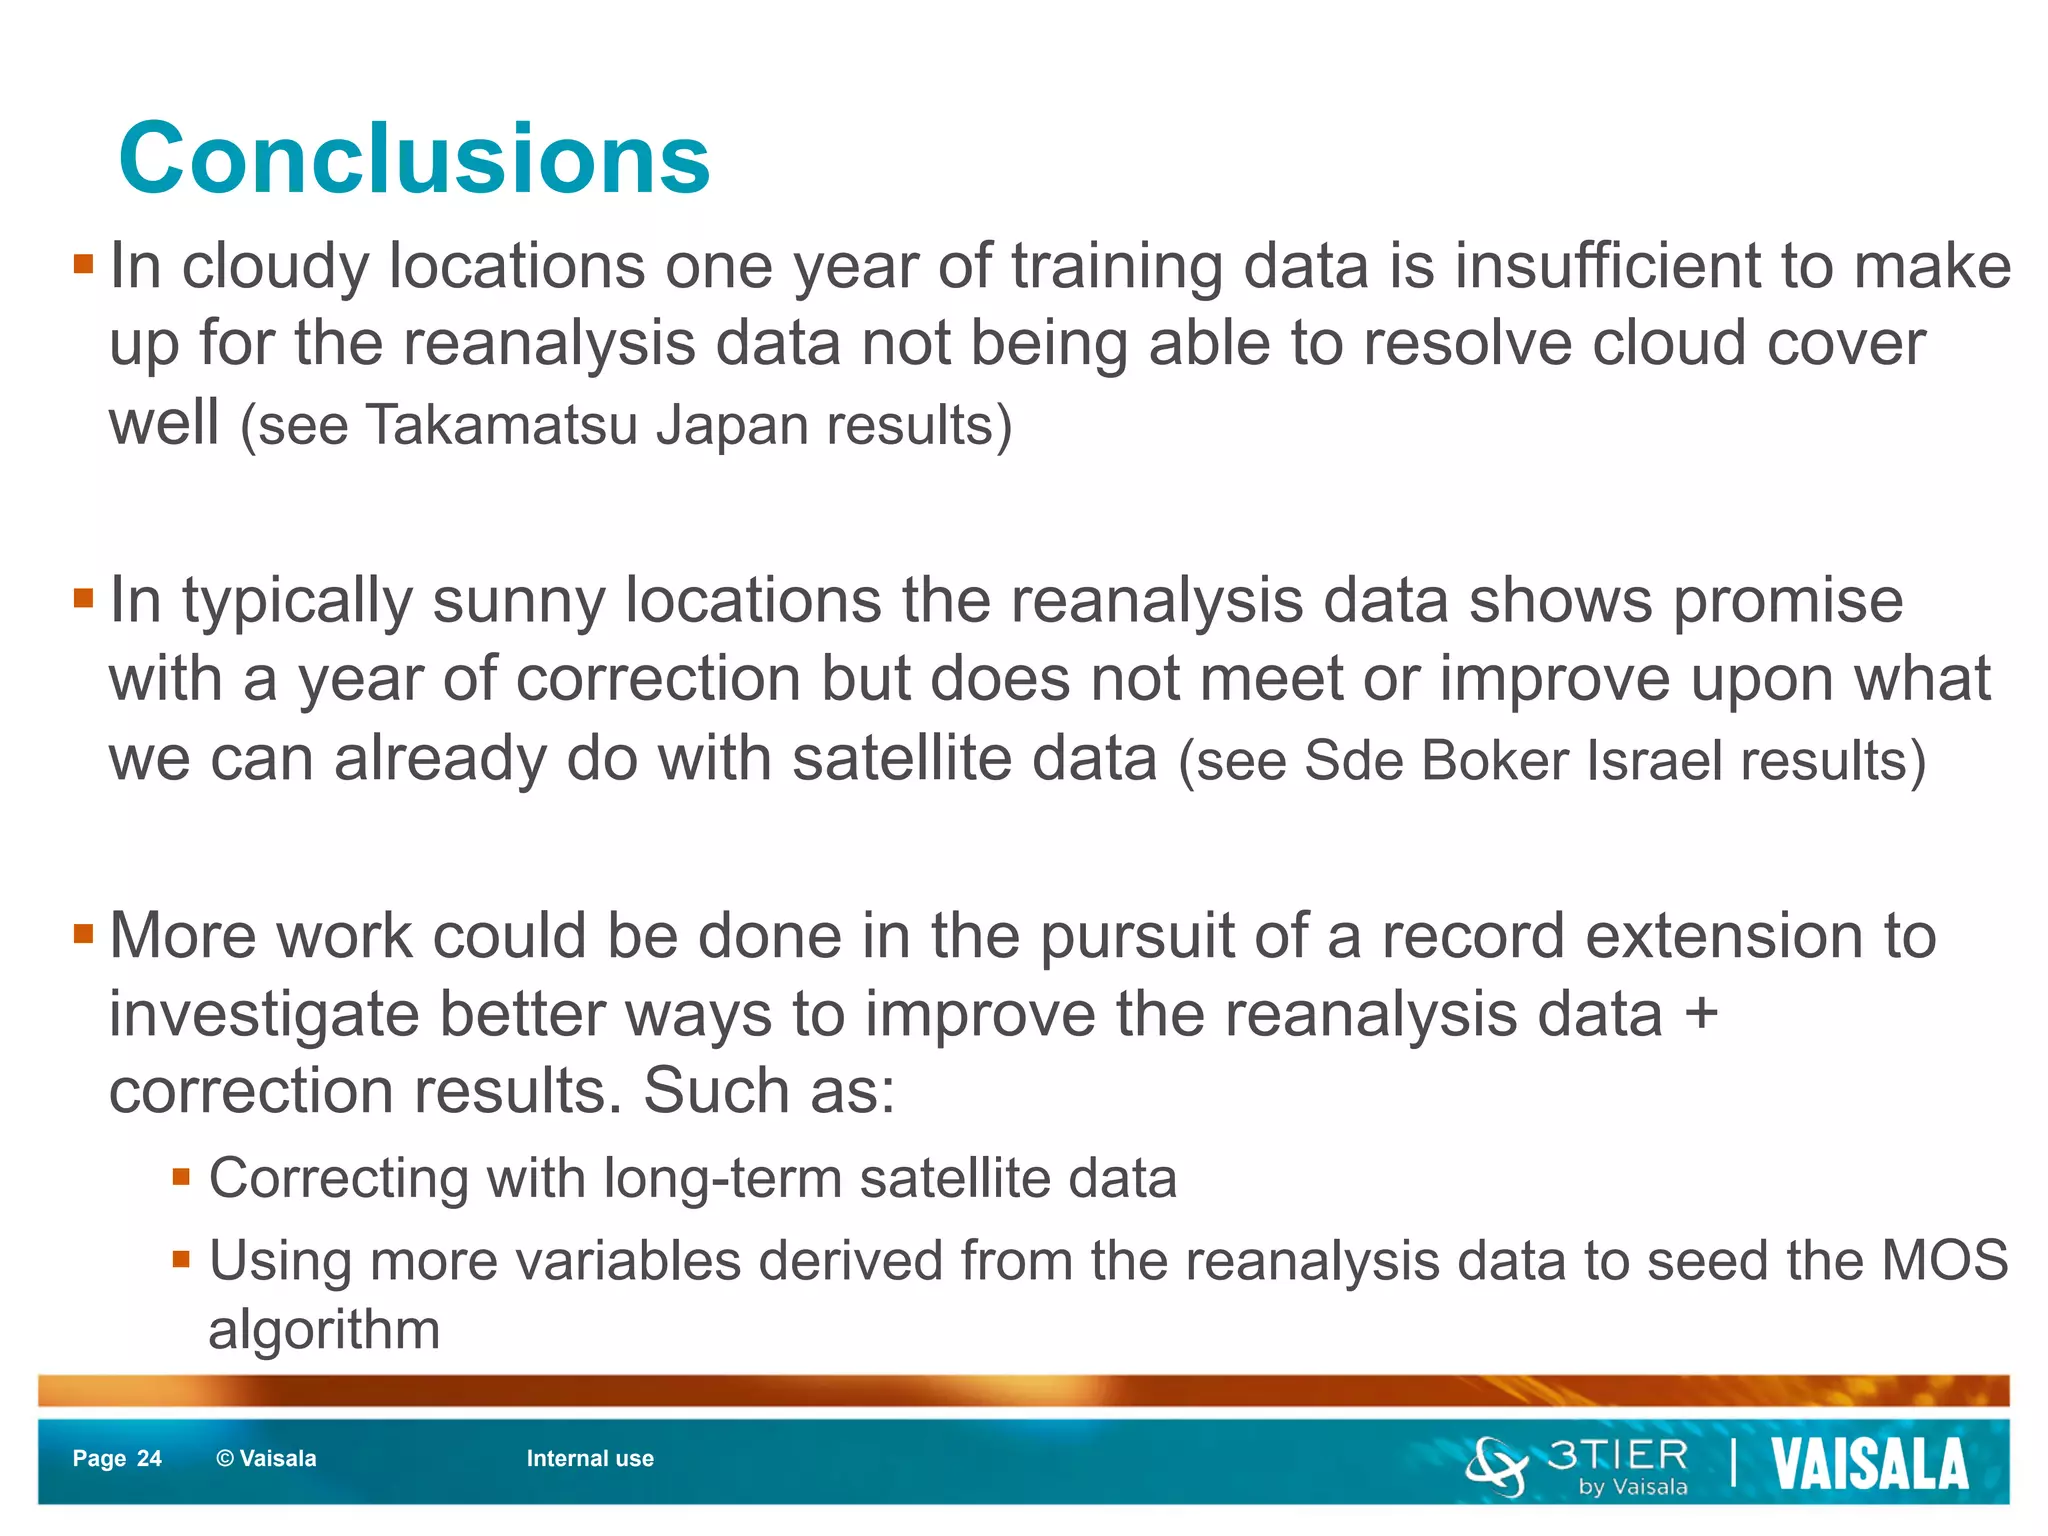


The document compares the accuracy of two second generation reanalysis datasets (MERRA and ERA-Interim) to satellite-derived solar data for solar resource assessment. It finds that MERRA has less error than ERA-Interim or satellite data alone. A bias correction method is applied to improve MERRA, reducing errors further. However, in cloudier locations, one year of training data is insufficient for the correction. While reanalysis datasets provide long-term global data, satellite observations currently provide more accurate short-term solar estimates.