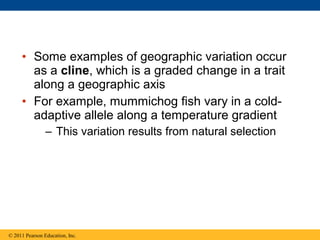
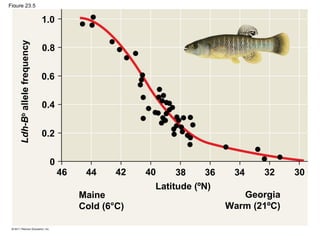
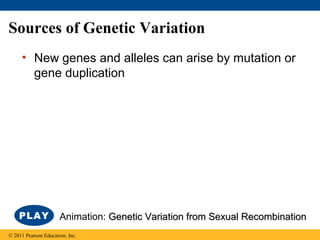
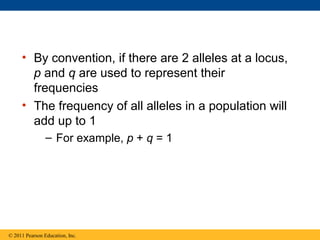
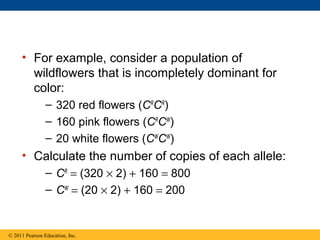
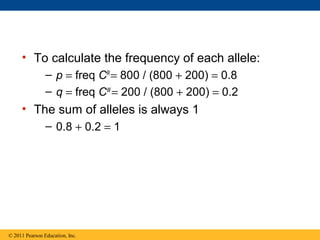
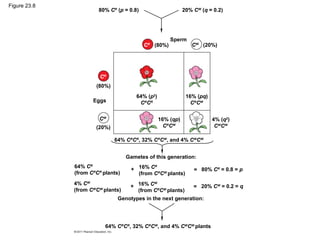
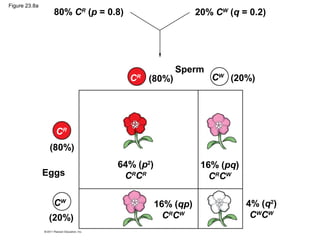
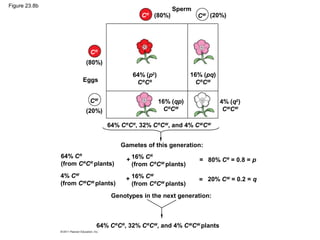
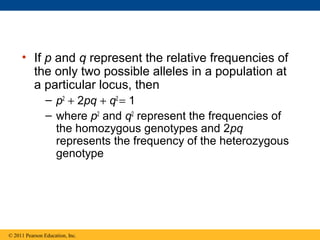
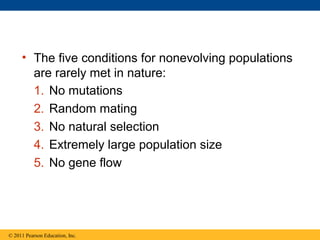
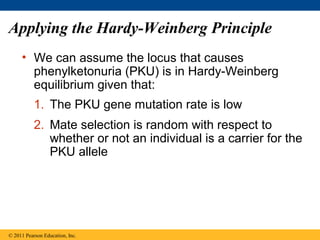
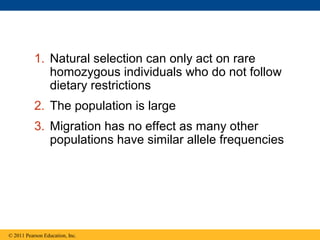
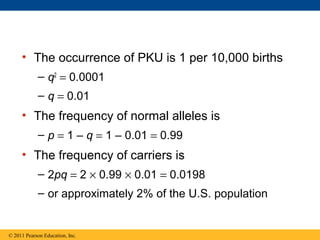
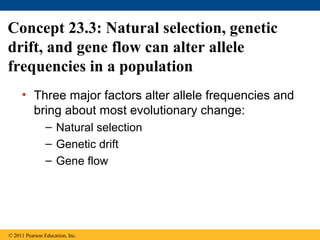
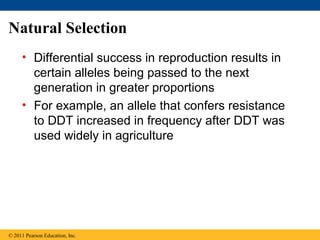
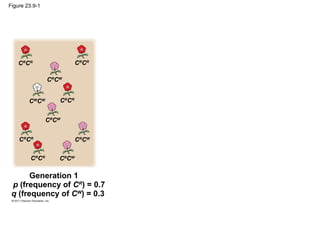
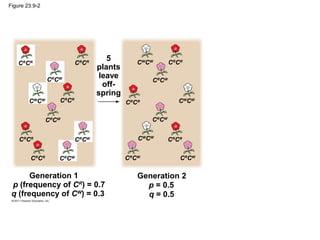
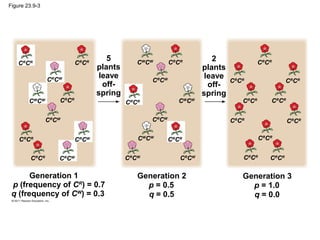
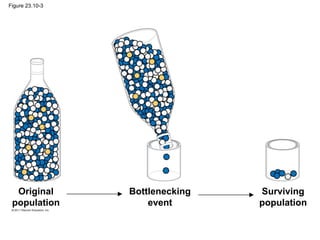
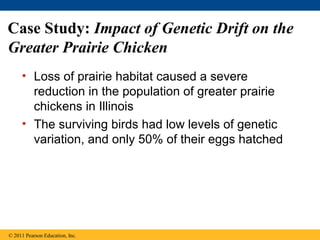
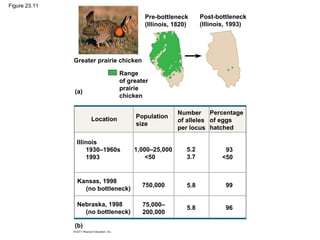
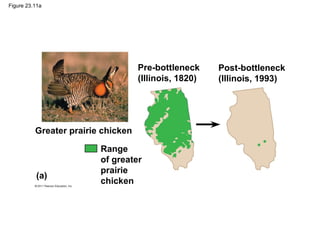
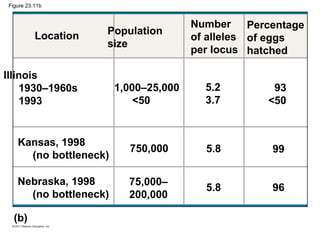
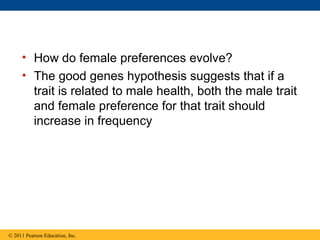
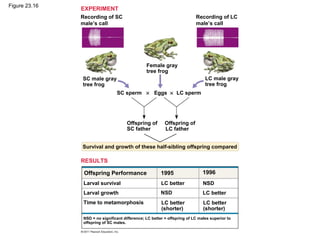
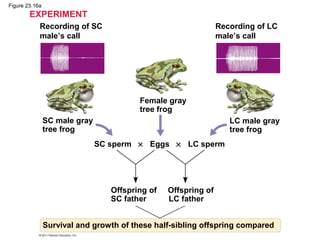
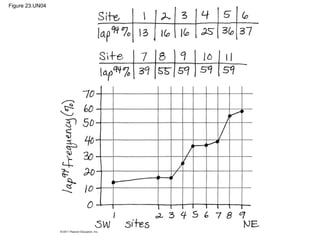
LECTURE PRESENTATIONS
For CAMPBELL BIOLOGY, NINTH EDITION
Jane B. Reece, Lisa A. Urry, Michael L. Cain, Steven A. Wasserman, Peter V. Minorsky, Robert B. Jackson
© 2011 Pearson Education, Inc.
Lectures by
Erin Barley
Kathleen Fitzpatrick
The Evolution of Populations
Chapter 23
Overview: The Smallest Unit of Evolution
• One misconception is that organisms evolve
during their lifetimes
• Natural selection acts on individuals, but only
populations evolve
• Consider, for example, a population of medium
ground finches on Daphne Major Island
– During a drought, large-beaked birds were
more likely to crack large seeds and survive
– The finch population evolved by natural
selection
© 2011 Pearson Education, Inc.
Figure 23.1
Figure 23.2
1976
(similar to the
prior 3 years)
1978
(after
drought)
Averagebeakdepth(mm)
10
9
8
0
• Microevolution is a change in allele
frequencies in a population over generations
• Three mechanisms cause allele frequency
change:
– Natural selection
– Genetic drift
– Gene flow
• Only natural selection causes adaptive
evolution
© 2011 Pearson Education, Inc.
• Variation in heritable traits is a prerequisite for
evolution
• Mendel’s work on pea plants provided evidence
of discrete heritable units (genes)
Concept 23.1: Genetic variation makes
evolution possible
© 2011 Pearson Education, Inc.
Genetic Variation
• Genetic variation among individuals is caused
by differences in genes or other DNA
segments
• Phenotype is the product of inherited genotype
and environmental influences
• Natural selection can only act on variation with
a genetic component
© 2011 Pearson Education, Inc.
Figure 23.3
(a) (b)
Figure 23.3a
(a)
Figure 23.3b
(b)
Variation Within a Population
• Both discrete and quantitative characters
contribute to variation within a population
• Discrete characters can be classified on an
either-or basis
• Quantitative characters vary along a continuum
within a population
© 2011 Pearson Education, Inc.
• Genetic variation can be measured as gene
variability or nucleotide variability
• For gene variability, average heterozygosity
measures the average percent of loci that are
heterozygous in a population
• Nucleotide variability is measured by comparing
the DNA sequences of pairs of individuals
© 2011 Pearson Education, Inc.
Variation Between Populations
• Most species exhibit geographic variation,
differences between gene pools of separate
populations
• For example, Madeira is home to several
isolated populations of mice
– Chromosomal variation among populations is
due to drift, not natural selection
© 2011 Pearson Education, Inc.
Figure 23.4
1 2.4
8.11 9.12 10.16
3.14
13.17
5.18
19
6
XX
7.15
1 2.19
9.10 11.12 13.17
3.8
15.18
4.16 5.14
XX
6.7
Figure 23.4a
1 2.4
8.11 9.12 10.16
3.14
13.17
5.18
19
6
XX
7.15
Figure 23.4b
1 2.19
9.10 11.12 13.17
3.8
15.18
4.16 5.14
XX
6.7
Figure 23.4c
• Some examples of geographic variation occur
as a cline, which is a graded change in a trait
along a geographic axis
• For example, mummichog fish vary in a cold-
adaptive allele along a temperature gradient
– This variation results from natural selection
© 2011 Pearson Education, Inc.
Figure 23.5
1.0
0.8
0.6
0.4
0.2
0
46 44 42 40 38 36 34 32
Maine
Cold (6°C)
Latitude (ºN)
Georgia
Warm (21ºC)
Ldh-Bb
allelefrequency
30
Sources of Genetic Variation
• New genes and alleles can arise by mutation or
gene duplication
© 2011 Pearson Education, Inc.
Animation: Genetic Variation from Sexual RecombinationGenetic Variation from Sexual Recombination
Formation of New Alleles
• A mutation is a change in nucleotide
sequence of DNA
• Only mutations in cells that produce gametes
can be passed to offspring
• A point mutation is a change in one base in a
gene
© 2011 Pearson Education, Inc.
• The effects of point mutations can vary:
– Mutations in noncoding regions of DNA are
often harmless
– Mutations in a genes can be neutral because
of redundancy in the genetic code
© 2011 Pearson Education, Inc.
• The effects of point mutations can vary:
– Mutations that result in a change in protein
production are often harmful
– Mutations that result in a change in protein
production can sometimes be beneficial
© 2011 Pearson Education, Inc.
Altering Gene Number or Position
• Chromosomal mutations that delete, disrupt, or
rearrange many loci are typically harmful
• Duplication of small pieces of DNA increases
genome size and is usually less harmful
• Duplicated genes can take on new functions by
further mutation
• An ancestral odor-detecting gene has been
duplicated many times: humans have 1,000
copies of the gene, mice have 1,300
© 2011 Pearson Education, Inc.
Rapid Reproduction
• Mutation rates are low in animals and plants
• The average is about one mutation in every
100,000 genes per generation
• Mutations rates are often lower in prokaryotes
and higher in viruses
© 2011 Pearson Education, Inc.
Sexual Reproduction
• Sexual reproduction can shuffle existing alleles
into new combinations
• In organisms that reproduce sexually,
recombination of alleles is more important than
mutation in producing the genetic differences
that make adaptation possible
© 2011 Pearson Education, Inc.
Concept 23.2: The Hardy-Weinberg
equation can be used to test whether a
population is evolving
• The first step in testing whether evolution is
occurring in a population is to clarify what we
mean by a population
© 2011 Pearson Education, Inc.
Gene Pools and Allele Frequencies
• A population is a localized group of individuals
capable of interbreeding and producing fertile
offspring
• A gene pool consists of all the alleles for all loci
in a population
• A locus is fixed if all individuals in a population
are homozygous for the same allele
© 2011 Pearson Education, Inc.
Figure 23.6
Porcupine herd
Beaufort Sea
Porcupine
herd range
Fortymile
herd range
Fortymile herd
NORTHW
EST
TERRITORIES
ALASKA
CANADA
MAP
AREA
ALASKA
YUKON
Figure 23.6a
Porcupine herd
Figure 23.6b
Fortymile herd
• The frequency of an allele in a population can
be calculated
– For diploid organisms, the total number of
alleles at a locus is the total number of
individuals times 2
– The total number of dominant alleles at a locus
is 2 alleles for each homozygous dominant
individual plus 1 allele for each heterozygous
individual; the same logic applies for recessive
alleles
© 2011 Pearson Education, Inc.
• By convention, if there are 2 alleles at a locus,
p and q are used to represent their
frequencies
• The frequency of all alleles in a population will
add up to 1
– For example, p + q = 1
© 2011 Pearson Education, Inc.
• For example, consider a population of
wildflowers that is incompletely dominant for
color:
– 320 red flowers (CR
CR
)
– 160 pink flowers (CR
CW
)
– 20 white flowers (CW
CW
)
• Calculate the number of copies of each allele:
– CR
= (320 × 2) + 160 = 800
– CW
= (20 × 2) + 160 = 200
© 2011 Pearson Education, Inc.
• To calculate the frequency of each allele:
– p = freq CR
= 800 / (800 + 200) = 0.8
– q = freq CW
= 200 / (800 + 200) = 0.2
• The sum of alleles is always 1
– 0.8 + 0.2 = 1
© 2011 Pearson Education, Inc.
The Hardy-Weinberg Principle
• The Hardy-Weinberg principle describes a
population that is not evolving
• If a population does not meet the criteria of
the Hardy-Weinberg principle, it can be
concluded that the population is evolving
© 2011 Pearson Education, Inc.
Hardy-Weinberg Equilibrium
• The Hardy-Weinberg principle states that
frequencies of alleles and genotypes in a
population remain constant from generation to
generation
• In a given population where gametes contribute
to the next generation randomly, allele
frequencies will not change
• Mendelian inheritance preserves genetic
variation in a population
© 2011 Pearson Education, Inc.
Figure 23.7
Alleles in the population
Gametes produced
Each egg: Each sperm:
80%
chance
20%
chance
80%
chance
20%
chance
Frequencies of alleles
p = frequency of
q = frequency of
CW
allele = 0.2
CR
allele = 0.8
• Hardy-Weinberg equilibrium describes the
constant frequency of alleles in such a gene
pool
• Consider, for example, the same population
of 500 wildflowers and 100 alleles where
– p = freq CR
= 0.8
– q = freq CW
= 0.2
© 2011 Pearson Education, Inc.
• The frequency of genotypes can be
calculated
– CR
CR
= p2
= (0.8)2
= 0.64
– CR
CW
= 2pq = 2(0.8)(0.2)= 0.32
– CW
CW
= q2
= (0.2)2
= 0.04
• The frequency of genotypes can be
confirmed using a Punnett square
© 2011 Pearson Education, Inc.
Figure 23.8
80% CR
(p = 0.8)
(80%) (20%)
Sperm
20% CW
(q = 0.2)
CR CW
(80%)
(20%)
CR
CW
Eggs
64% (p2
)
CR
CR
16% (pq)
CR
CW
16% (qp)
CR
CW
4% (q2
)
CW
CW
64% CR
CR
, 32% CR
CW
, and 4% CW
CW
Gametes of this generation:
64% CR
(from CR
CR
plants)
4% CW
(from CW
CW
plants)
16% CR
(from CR
CW
plants)
+
+
Genotypes in the next generation:
16% CW
(from CR
CW
plants)
=
=
80% CR
= 0.8 = p
20% CW
= 0.2 = q
64% CR
CR
, 32% CR
CW
, and 4% CW
CW
plants
Figure 23.8a
80% CR
(p = 0.8)
(80%) (20%)
20% CW
(q = 0.2)
CR CW
Sperm
(80%)
(20%)
CR
CW
Eggs
64% (p2
)
CR
CR
16% (pq)
CR
CW
16% (qp)
CR
CW
4% (q2
)
CW
CW
Figure 23.8b
(20%)CR
Sperm
(80%)
(20%)
CR
CW
Eggs
64% (p2
)
CR
CR
16% (pq)
CR
CW
16% (qp)
CR
CW
4% (q2
)
CW
CW
64% CR
CR
, 32% CR
CW
, and 4% CW
CW
Gametes of this generation:
64% CR
(from CR
CR
plants)
4% CW
(from CW
CW
plants)
16% CR
(from CR
CW
plants)
+
+
Genotypes in the next generation:
16% CW
(from CR
CW
plants)
=
=
80% CR
= 0.8 = p
20% CW
= 0.2 = q
64% CR
CR
, 32% CR
CW
, and 4% CW
CW
plants
CW(80%)
• If p and q represent the relative frequencies of
the only two possible alleles in a population at
a particular locus, then
– p2
+ 2pq + q2
= 1
– where p2
and q2
represent the frequencies of
the homozygous genotypes and 2pq
represents the frequency of the heterozygous
genotype
© 2011 Pearson Education, Inc.
Conditions for Hardy-Weinberg Equilibrium
• The Hardy-Weinberg theorem describes a
hypothetical population that is not evolving
• In real populations, allele and genotype
frequencies do change over time
© 2011 Pearson Education, Inc.
• The five conditions for nonevolving populations
are rarely met in nature:
© 2011 Pearson Education, Inc.
1. No mutations
2. Random mating
3. No natural selection
4. Extremely large population size
5. No gene flow
• Natural populations can evolve at some loci,
while being in Hardy-Weinberg equilibrium at
other loci
© 2011 Pearson Education, Inc.
Applying the Hardy-Weinberg Principle
• We can assume the locus that causes
phenylketonuria (PKU) is in Hardy-Weinberg
equilibrium given that:
© 2011 Pearson Education, Inc.
1. The PKU gene mutation rate is low
2. Mate selection is random with respect to
whether or not an individual is a carrier for the
PKU allele
1. Natural selection can only act on rare
homozygous individuals who do not follow
dietary restrictions
2. The population is large
3. Migration has no effect as many other
populations have similar allele frequencies
© 2011 Pearson Education, Inc.
• The occurrence of PKU is 1 per 10,000 births
– q2
= 0.0001
– q = 0.01
• The frequency of normal alleles is
– p = 1 – q = 1 – 0.01 = 0.99
• The frequency of carriers is
– 2pq = 2 × 0.99 × 0.01 = 0.0198
– or approximately 2% of the U.S. population
© 2011 Pearson Education, Inc.
• Three major factors alter allele frequencies and
bring about most evolutionary change:
– Natural selection
– Genetic drift
– Gene flow
Concept 23.3: Natural selection, genetic
drift, and gene flow can alter allele
frequencies in a population
© 2011 Pearson Education, Inc.
Natural Selection
• Differential success in reproduction results in
certain alleles being passed to the next
generation in greater proportions
• For example, an allele that confers resistance
to DDT increased in frequency after DDT was
used widely in agriculture
© 2011 Pearson Education, Inc.
Genetic Drift
• The smaller a sample, the greater the chance of
deviation from a predicted result
• Genetic drift describes how allele frequencies
fluctuate unpredictably from one generation to the
next
• Genetic drift tends to reduce genetic variation
through losses of alleles
© 2011 Pearson Education, Inc.
Animation: Causes of Evolutionary ChangeCauses of Evolutionary Change
Figure 23.9-1
Generation 1
p (frequency of CR
) = 0.7
q (frequency of CW
) = 0.3
CR
CR CR
CR
CR
CW
CW
CW CR
CR
CR
CW
CR
CR
CR
CW
CR
CR
CR
CW
Figure 23.9-2
5
plants
leave
off-
spring
Generation 1
p (frequency of CR
) = 0.7
q (frequency of CW
) = 0.3
CR
CR CR
CR
CR
CW
CW
CW CR
CR
CR
CW
CR
CR
CR
CW
CR
CR
CR
CW
CR
CR
CW
CW
CR
CW
CR
CR CW
CW
CR
CW
CW
CW
CR
CR
CR
CW
CR
CW
Generation 2
p = 0.5
q = 0.5
Figure 23.9-3
5
plants
leave
off-
spring
Generation 1
p (frequency of CR
) = 0.7
q (frequency of CW
) = 0.3
CR
CR CR
CR
CR
CW
CW
CW CR
CR
CR
CW
CR
CR
CR
CW
CR
CR
CR
CW
CR
CR
CW
CW
CR
CW
CR
CR CW
CW
CR
CW
CW
CW
CR
CR
CR
CW
CR
CW
Generation 2
p = 0.5
q = 0.5
2
plants
leave
off-
spring
CR
CR
CR
CR
CR
CR
CR
CR
CR
CR
CR
CR
CR
CR
CR
CR
CR
CR
CR
CR
Generation 3
p = 1.0
q = 0.0
The Founder Effect
• The founder effect occurs when a few
individuals become isolated from a larger
population
• Allele frequencies in the small founder
population can be different from those in the
larger parent population
© 2011 Pearson Education, Inc.
The Bottleneck Effect
• The bottleneck effect is a sudden reduction in
population size due to a change in the
environment
• The resulting gene pool may no longer be
reflective of the original population’s gene pool
• If the population remains small, it may be further
affected by genetic drift
© 2011 Pearson Education, Inc.
Figure 23.10-1
Original
population
Figure 23.10-2
Original
population
Bottlenecking
event
Figure 23.10-3
Original
population
Bottlenecking
event
Surviving
population
• Understanding the bottleneck effect can
increase understanding of how human activity
affects other species
© 2011 Pearson Education, Inc.
Case Study: Impact of Genetic Drift on the
Greater Prairie Chicken
• Loss of prairie habitat caused a severe
reduction in the population of greater prairie
chickens in Illinois
• The surviving birds had low levels of genetic
variation, and only 50% of their eggs hatched
© 2011 Pearson Education, Inc.
Figure 23.11
Pre-bottleneck
(Illinois, 1820)
Post-bottleneck
(Illinois, 1993)
Greater prairie chicken
Range
of greater
prairie
chicken
(a)
Location Population
size
Number
of alleles
per locus
Percentage
of eggs
hatched
93
<50
5.2
3.7
5.8
5.8
99
96
1,000–25,000
<50
750,000
75,000–
200,000
Nebraska, 1998
(no bottleneck)
(b)
Kansas, 1998
(no bottleneck)
Illinois
1930–1960s
1993
Figure 23.11a
Pre-bottleneck
(Illinois, 1820)
Post-bottleneck
(Illinois, 1993)
Greater prairie chicken
Range
of greater
prairie
chicken
(a)
Figure 23.11b
Location Population
size
Number
of alleles
per locus
Percentage
of eggs
hatched
93
<50
5.2
3.7
5.8
5.8
99
96
1,000–25,000
<50
750,000
75,000–
200,000
Nebraska, 1998
(no bottleneck)
(b)
Kansas, 1998
(no bottleneck)
Illinois
1930–1960s
1993
Figure 23.11c
Greater prairie chicken
• Researchers used DNA from museum
specimens to compare genetic variation in the
population before and after the bottleneck
• The results showed a loss of alleles at several
loci
• Researchers introduced greater prairie
chickens from population in other states and
were successful in introducing new alleles and
increasing the egg hatch rate to 90%
© 2011 Pearson Education, Inc.
Effects of Genetic Drift: A Summary
1. Genetic drift is significant in small populations
2. Genetic drift causes allele frequencies to
change at random
3. Genetic drift can lead to a loss of genetic
variation within populations
4. Genetic drift can cause harmful alleles to
become fixed
© 2011 Pearson Education, Inc.
Gene Flow
• Gene flow consists of the movement of alleles
among populations
• Alleles can be transferred through the movement
of fertile individuals or gametes (for example,
pollen)
• Gene flow tends to reduce variation among
populations over time
© 2011 Pearson Education, Inc.
• Gene flow can decrease the fitness of a population
• Consider, for example, the great tit (Parus major)
on the Dutch island of Vlieland
– Mating causes gene flow between the central and
eastern populations
– Immigration from the mainland introduces alleles
that decrease fitness
– Natural selection selects for alleles that increase
fitness
– Birds in the central region with high immigration
have a lower fitness; birds in the east with low
immigration have a higher fitness
© 2011 Pearson Education, Inc.
Figure 23.12
Population in which the
surviving females
eventually bred
Central
Eastern
Survivalrate(%)
Females born
in central
population
Females born
in eastern
population
Parus major
60
50
40
30
20
10
0
Central
population
NORTH SEA Eastern
population
Vlieland,
the Netherlands
2 km
Figure 23.12a
Parus major
• Gene flow can increase the fitness of a population
• Consider, for example, the spread of alleles for
resistance to insecticides
– Insecticides have been used to target mosquitoes
that carry West Nile virus and malaria
– Alleles have evolved in some populations that
confer insecticide resistance to these mosquitoes
– The flow of insecticide resistance alleles into a
population can cause an increase in fitness
© 2011 Pearson Education, Inc.
• Gene flow is an important agent of evolutionary
change in human populations
© 2011 Pearson Education, Inc.
• Evolution by natural selection involves both
change and “sorting”
– New genetic variations arise by chance
– Beneficial alleles are “sorted” and favored by
natural selection
• Only natural selection consistently results in
adaptive evolution
Concept 23.4: Natural selection is the only
mechanism that consistently causes adaptive
evolution
© 2011 Pearson Education, Inc.
A Closer Look at Natural Selection
• Natural selection brings about adaptive
evolution by acting on an organism’s
phenotype
© 2011 Pearson Education, Inc.
Relative Fitness
• The phrases “struggle for existence” and
“survival of the fittest” are misleading as they
imply direct competition among individuals
• Reproductive success is generally more
subtle and depends on many factors
© 2011 Pearson Education, Inc.
• Relative fitness is the contribution an
individual makes to the gene pool of the next
generation, relative to the contributions of other
individuals
• Selection favors certain genotypes by acting on
the phenotypes of certain organisms
© 2011 Pearson Education, Inc.
Directional, Disruptive, and Stabilizing
Selection
• Three modes of selection:
– Directional selection favors individuals at one
end of the phenotypic range
– Disruptive selection favors individuals at both
extremes of the phenotypic range
– Stabilizing selection favors intermediate
variants and acts against extreme phenotypes
© 2011 Pearson Education, Inc.
Figure 23.13
Original population
Phenotypes (fur color)Frequencyof
individualsOriginal
population
Evolved
population
(a) Directional selection (b) Disruptive selection (c) Stabilizing selection
Figure 23.13a
Original
population
Evolved
population
(a) Directional selection
Figure 23.13b
Original
population
Evolved
population
(b) Disruptive selection
Figure 23.13c
Original
population
Evolved
population
(c) Stabilizing selection
The Key Role of Natural Selection in
Adaptive Evolution
• Striking adaptation have arisen by natural
selection
– For example, cuttlefish can change color
rapidly for camouflage
– For example, the jaws of snakes allow them
to swallow prey larger than their heads
© 2011 Pearson Education, Inc.
Figure 23.14
Bones shown in
green are movable.
Ligament
Figure 23.14a
• Natural selection increases the frequencies of
alleles that enhance survival and reproduction
• Adaptive evolution occurs as the match between
an organism and its environment increases
• Because the environment can change, adaptive
evolution is a continuous process
© 2011 Pearson Education, Inc.
• Genetic drift and gene flow do not consistently
lead to adaptive evolution as they can increase
or decrease the match between an organism
and its environment
© 2011 Pearson Education, Inc.
Sexual Selection
• Sexual selection is natural selection for mating
success
• It can result in sexual dimorphism, marked
differences between the sexes in secondary
sexual characteristics
© 2011 Pearson Education, Inc.
Figure 23.15
• Intrasexual selection is competition among
individuals of one sex (often males) for mates
of the opposite sex
• Intersexual selection, often called mate
choice, occurs when individuals of one sex
(usually females) are choosy in selecting their
mates
• Male showiness due to mate choice can
increase a male’s chances of attracting a
female, while decreasing his chances of
survival
© 2011 Pearson Education, Inc.
• How do female preferences evolve?
• The good genes hypothesis suggests that if a
trait is related to male health, both the male trait
and female preference for that trait should
increase in frequency
© 2011 Pearson Education, Inc.
Figure 23.16
EXPERIMENT
Recording of SC
male’s call
Recording of LC
male’s call
LC male gray
tree frog
SC male gray
tree frog
Female gray
tree frog
SC sperm × Eggs × LC sperm
Offspring of Offspring of
SC father LC father
Survival and growth of these half-sibling offspring compared
RESULTS
Time to metamorphosis
Larval survival
Larval growth
NSD = no significant difference; LC better = offspring of LC males superior to
offspring of SC males.
Offspring Performance 1995 1996
LC better NSD
NSD
LC better
(shorter)
LC better
(shorter)
LC better
Figure 23.16a
EXPERIMENT
Recording of SC
male’s call
Recording of LC
male’s call
LC male gray
tree frog
SC male gray
tree frog
Female gray
tree frog
SC sperm × Eggs × LC sperm
Offspring of Offspring of
SC father LC father
Survival and growth of these half-sibling offspring compared
Figure 23.16b
RESULTS
Time to metamorphosis
Larval survival
Larval growth
NSD = no significant difference; LC better = offspring of LC males superior to
offspring of SC males.
Offspring Performance 1995 1996
LC better NSD
NSD
LC better
(shorter)
LC better
(shorter)
LC better
The Preservation of Genetic Variation
• Neutral variation is genetic variation that does
not confer a selective advantage or disadvantage
• Various mechanisms help to preserve genetic
variation in a population
© 2011 Pearson Education, Inc.
Diploidy
• Diploidy maintains genetic variation in the form
of hidden recessive alleles
• Heterozygotes can carry recessive alleles that
are hidden from the effects of selection
© 2011 Pearson Education, Inc.
Balancing Selection
• Balancing selection occurs when natural
selection maintains stable frequencies of two or
more phenotypic forms in a population
• Balancing selection includes
– Heterozygote advantage
– Frequency-dependent selection
© 2011 Pearson Education, Inc.
• Heterozygote advantage occurs when
heterozygotes have a higher fitness than do
both homozygotes
• Natural selection will tend to maintain two or
more alleles at that locus
• The sickle-cell allele causes mutations in
hemoglobin but also confers malaria resistance
Heterozygote Advantage
© 2011 Pearson Education, Inc.
Figure 23.17
Distribution of
malaria caused by
Plasmodium falciparum
(a parasitic unicellular eukaryote)
Key
Frequencies of the
sickle-cell allele
0–2.5%
2.5–5.0%
5.0–7.5%
7.5–10.0%
10.0–12.5%
>12.5%
• In frequency-dependent selection, the fitness
of a phenotype declines if it becomes too
common in the population
• Selection can favor whichever phenotype is
less common in a population
• For example, frequency-dependent selection
selects for approximately equal numbers of
“right-mouthed” and “left-mouthed” scale-eating
fish
Frequency-Dependent Selection
© 2011 Pearson Education, Inc.
“Left-mouthed”
P. microlepis
“Right-mouthed”
P. microlepis
1.0
0.5
0
1981
Sample year
’82 ’83 ’84 ’85 ’86 ’87 ’88 ’89 ’90
Frequencyof
“left-mouthed”individuals
Figure 23.18
Why Natural Selection Cannot Fashion
Perfect Organisms
1. Selection can act only on existing variations
2. Evolution is limited by historical constraints
3. Adaptations are often compromises
4. Chance, natural selection, and the
environment interact
© 2011 Pearson Education, Inc.
Figure 23.19
Figure 23.UN01
CR
CR
CW
CW
CR
CW
Figure 23.UN02
Original
population
Evolved
population
Directional
selection
Disruptive
selection
Stabilizing
selection
Figure 23.UN03
Sampling sites
(1–8 represent
pairs of sites)
Allele
frequencies
lap94
alleles Other lap alleles
Salinity increases toward the open ocean
Long Island
Sound
Atlantic
Ocean
Data from R. K. Koehn and T. J. Hilbish, The adaptive importance of genetic variation,
American Scientist 75:134–141 (1987).
1
2
2 3 4 5 6 7 8 9 10 11
1
2 3
4 5 6 7 8
9
10
11
Figure 23.UN04

23 lecture evolution_populations

  • 1.
    LECTURE PRESENTATIONS For CAMPBELLBIOLOGY, NINTH EDITION Jane B. Reece, Lisa A. Urry, Michael L. Cain, Steven A. Wasserman, Peter V. Minorsky, Robert B. Jackson © 2011 Pearson Education, Inc. Lectures by Erin Barley Kathleen Fitzpatrick The Evolution of Populations Chapter 23
  • 2.
    Overview: The SmallestUnit of Evolution • One misconception is that organisms evolve during their lifetimes • Natural selection acts on individuals, but only populations evolve • Consider, for example, a population of medium ground finches on Daphne Major Island – During a drought, large-beaked birds were more likely to crack large seeds and survive – The finch population evolved by natural selection © 2011 Pearson Education, Inc.
  • 3.
  • 4.
    Figure 23.2 1976 (similar tothe prior 3 years) 1978 (after drought) Averagebeakdepth(mm) 10 9 8 0
  • 5.
    • Microevolution isa change in allele frequencies in a population over generations • Three mechanisms cause allele frequency change: – Natural selection – Genetic drift – Gene flow • Only natural selection causes adaptive evolution © 2011 Pearson Education, Inc.
  • 6.
    • Variation inheritable traits is a prerequisite for evolution • Mendel’s work on pea plants provided evidence of discrete heritable units (genes) Concept 23.1: Genetic variation makes evolution possible © 2011 Pearson Education, Inc.
  • 7.
    Genetic Variation • Geneticvariation among individuals is caused by differences in genes or other DNA segments • Phenotype is the product of inherited genotype and environmental influences • Natural selection can only act on variation with a genetic component © 2011 Pearson Education, Inc.
  • 8.
  • 9.
  • 10.
  • 11.
    Variation Within aPopulation • Both discrete and quantitative characters contribute to variation within a population • Discrete characters can be classified on an either-or basis • Quantitative characters vary along a continuum within a population © 2011 Pearson Education, Inc.
  • 12.
    • Genetic variationcan be measured as gene variability or nucleotide variability • For gene variability, average heterozygosity measures the average percent of loci that are heterozygous in a population • Nucleotide variability is measured by comparing the DNA sequences of pairs of individuals © 2011 Pearson Education, Inc.
  • 13.
    Variation Between Populations •Most species exhibit geographic variation, differences between gene pools of separate populations • For example, Madeira is home to several isolated populations of mice – Chromosomal variation among populations is due to drift, not natural selection © 2011 Pearson Education, Inc.
  • 14.
    Figure 23.4 1 2.4 8.119.12 10.16 3.14 13.17 5.18 19 6 XX 7.15 1 2.19 9.10 11.12 13.17 3.8 15.18 4.16 5.14 XX 6.7
  • 15.
    Figure 23.4a 1 2.4 8.119.12 10.16 3.14 13.17 5.18 19 6 XX 7.15
  • 16.
    Figure 23.4b 1 2.19 9.1011.12 13.17 3.8 15.18 4.16 5.14 XX 6.7
  • 17.
  • 18.
    • Some examplesof geographic variation occur as a cline, which is a graded change in a trait along a geographic axis • For example, mummichog fish vary in a cold- adaptive allele along a temperature gradient – This variation results from natural selection © 2011 Pearson Education, Inc.
  • 19.
    Figure 23.5 1.0 0.8 0.6 0.4 0.2 0 46 4442 40 38 36 34 32 Maine Cold (6°C) Latitude (ºN) Georgia Warm (21ºC) Ldh-Bb allelefrequency 30
  • 20.
    Sources of GeneticVariation • New genes and alleles can arise by mutation or gene duplication © 2011 Pearson Education, Inc. Animation: Genetic Variation from Sexual RecombinationGenetic Variation from Sexual Recombination
  • 21.
    Formation of NewAlleles • A mutation is a change in nucleotide sequence of DNA • Only mutations in cells that produce gametes can be passed to offspring • A point mutation is a change in one base in a gene © 2011 Pearson Education, Inc.
  • 22.
    • The effectsof point mutations can vary: – Mutations in noncoding regions of DNA are often harmless – Mutations in a genes can be neutral because of redundancy in the genetic code © 2011 Pearson Education, Inc.
  • 23.
    • The effectsof point mutations can vary: – Mutations that result in a change in protein production are often harmful – Mutations that result in a change in protein production can sometimes be beneficial © 2011 Pearson Education, Inc.
  • 24.
    Altering Gene Numberor Position • Chromosomal mutations that delete, disrupt, or rearrange many loci are typically harmful • Duplication of small pieces of DNA increases genome size and is usually less harmful • Duplicated genes can take on new functions by further mutation • An ancestral odor-detecting gene has been duplicated many times: humans have 1,000 copies of the gene, mice have 1,300 © 2011 Pearson Education, Inc.
  • 25.
    Rapid Reproduction • Mutationrates are low in animals and plants • The average is about one mutation in every 100,000 genes per generation • Mutations rates are often lower in prokaryotes and higher in viruses © 2011 Pearson Education, Inc.
  • 26.
    Sexual Reproduction • Sexualreproduction can shuffle existing alleles into new combinations • In organisms that reproduce sexually, recombination of alleles is more important than mutation in producing the genetic differences that make adaptation possible © 2011 Pearson Education, Inc.
  • 27.
    Concept 23.2: TheHardy-Weinberg equation can be used to test whether a population is evolving • The first step in testing whether evolution is occurring in a population is to clarify what we mean by a population © 2011 Pearson Education, Inc.
  • 28.
    Gene Pools andAllele Frequencies • A population is a localized group of individuals capable of interbreeding and producing fertile offspring • A gene pool consists of all the alleles for all loci in a population • A locus is fixed if all individuals in a population are homozygous for the same allele © 2011 Pearson Education, Inc.
  • 29.
    Figure 23.6 Porcupine herd BeaufortSea Porcupine herd range Fortymile herd range Fortymile herd NORTHW EST TERRITORIES ALASKA CANADA MAP AREA ALASKA YUKON
  • 30.
  • 31.
  • 32.
    • The frequencyof an allele in a population can be calculated – For diploid organisms, the total number of alleles at a locus is the total number of individuals times 2 – The total number of dominant alleles at a locus is 2 alleles for each homozygous dominant individual plus 1 allele for each heterozygous individual; the same logic applies for recessive alleles © 2011 Pearson Education, Inc.
  • 33.
    • By convention,if there are 2 alleles at a locus, p and q are used to represent their frequencies • The frequency of all alleles in a population will add up to 1 – For example, p + q = 1 © 2011 Pearson Education, Inc.
  • 34.
    • For example,consider a population of wildflowers that is incompletely dominant for color: – 320 red flowers (CR CR ) – 160 pink flowers (CR CW ) – 20 white flowers (CW CW ) • Calculate the number of copies of each allele: – CR = (320 × 2) + 160 = 800 – CW = (20 × 2) + 160 = 200 © 2011 Pearson Education, Inc.
  • 35.
    • To calculatethe frequency of each allele: – p = freq CR = 800 / (800 + 200) = 0.8 – q = freq CW = 200 / (800 + 200) = 0.2 • The sum of alleles is always 1 – 0.8 + 0.2 = 1 © 2011 Pearson Education, Inc.
  • 36.
    The Hardy-Weinberg Principle •The Hardy-Weinberg principle describes a population that is not evolving • If a population does not meet the criteria of the Hardy-Weinberg principle, it can be concluded that the population is evolving © 2011 Pearson Education, Inc.
  • 37.
    Hardy-Weinberg Equilibrium • TheHardy-Weinberg principle states that frequencies of alleles and genotypes in a population remain constant from generation to generation • In a given population where gametes contribute to the next generation randomly, allele frequencies will not change • Mendelian inheritance preserves genetic variation in a population © 2011 Pearson Education, Inc.
  • 38.
    Figure 23.7 Alleles inthe population Gametes produced Each egg: Each sperm: 80% chance 20% chance 80% chance 20% chance Frequencies of alleles p = frequency of q = frequency of CW allele = 0.2 CR allele = 0.8
  • 39.
    • Hardy-Weinberg equilibriumdescribes the constant frequency of alleles in such a gene pool • Consider, for example, the same population of 500 wildflowers and 100 alleles where – p = freq CR = 0.8 – q = freq CW = 0.2 © 2011 Pearson Education, Inc.
  • 40.
    • The frequencyof genotypes can be calculated – CR CR = p2 = (0.8)2 = 0.64 – CR CW = 2pq = 2(0.8)(0.2)= 0.32 – CW CW = q2 = (0.2)2 = 0.04 • The frequency of genotypes can be confirmed using a Punnett square © 2011 Pearson Education, Inc.
  • 41.
    Figure 23.8 80% CR (p= 0.8) (80%) (20%) Sperm 20% CW (q = 0.2) CR CW (80%) (20%) CR CW Eggs 64% (p2 ) CR CR 16% (pq) CR CW 16% (qp) CR CW 4% (q2 ) CW CW 64% CR CR , 32% CR CW , and 4% CW CW Gametes of this generation: 64% CR (from CR CR plants) 4% CW (from CW CW plants) 16% CR (from CR CW plants) + + Genotypes in the next generation: 16% CW (from CR CW plants) = = 80% CR = 0.8 = p 20% CW = 0.2 = q 64% CR CR , 32% CR CW , and 4% CW CW plants
  • 42.
    Figure 23.8a 80% CR (p= 0.8) (80%) (20%) 20% CW (q = 0.2) CR CW Sperm (80%) (20%) CR CW Eggs 64% (p2 ) CR CR 16% (pq) CR CW 16% (qp) CR CW 4% (q2 ) CW CW
  • 43.
    Figure 23.8b (20%)CR Sperm (80%) (20%) CR CW Eggs 64% (p2 ) CR CR 16%(pq) CR CW 16% (qp) CR CW 4% (q2 ) CW CW 64% CR CR , 32% CR CW , and 4% CW CW Gametes of this generation: 64% CR (from CR CR plants) 4% CW (from CW CW plants) 16% CR (from CR CW plants) + + Genotypes in the next generation: 16% CW (from CR CW plants) = = 80% CR = 0.8 = p 20% CW = 0.2 = q 64% CR CR , 32% CR CW , and 4% CW CW plants CW(80%)
  • 44.
    • If pand q represent the relative frequencies of the only two possible alleles in a population at a particular locus, then – p2 + 2pq + q2 = 1 – where p2 and q2 represent the frequencies of the homozygous genotypes and 2pq represents the frequency of the heterozygous genotype © 2011 Pearson Education, Inc.
  • 45.
    Conditions for Hardy-WeinbergEquilibrium • The Hardy-Weinberg theorem describes a hypothetical population that is not evolving • In real populations, allele and genotype frequencies do change over time © 2011 Pearson Education, Inc.
  • 46.
    • The fiveconditions for nonevolving populations are rarely met in nature: © 2011 Pearson Education, Inc. 1. No mutations 2. Random mating 3. No natural selection 4. Extremely large population size 5. No gene flow
  • 47.
    • Natural populationscan evolve at some loci, while being in Hardy-Weinberg equilibrium at other loci © 2011 Pearson Education, Inc.
  • 48.
    Applying the Hardy-WeinbergPrinciple • We can assume the locus that causes phenylketonuria (PKU) is in Hardy-Weinberg equilibrium given that: © 2011 Pearson Education, Inc. 1. The PKU gene mutation rate is low 2. Mate selection is random with respect to whether or not an individual is a carrier for the PKU allele
  • 49.
    1. Natural selectioncan only act on rare homozygous individuals who do not follow dietary restrictions 2. The population is large 3. Migration has no effect as many other populations have similar allele frequencies © 2011 Pearson Education, Inc.
  • 50.
    • The occurrenceof PKU is 1 per 10,000 births – q2 = 0.0001 – q = 0.01 • The frequency of normal alleles is – p = 1 – q = 1 – 0.01 = 0.99 • The frequency of carriers is – 2pq = 2 × 0.99 × 0.01 = 0.0198 – or approximately 2% of the U.S. population © 2011 Pearson Education, Inc.
  • 51.
    • Three majorfactors alter allele frequencies and bring about most evolutionary change: – Natural selection – Genetic drift – Gene flow Concept 23.3: Natural selection, genetic drift, and gene flow can alter allele frequencies in a population © 2011 Pearson Education, Inc.
  • 52.
    Natural Selection • Differentialsuccess in reproduction results in certain alleles being passed to the next generation in greater proportions • For example, an allele that confers resistance to DDT increased in frequency after DDT was used widely in agriculture © 2011 Pearson Education, Inc.
  • 53.
    Genetic Drift • Thesmaller a sample, the greater the chance of deviation from a predicted result • Genetic drift describes how allele frequencies fluctuate unpredictably from one generation to the next • Genetic drift tends to reduce genetic variation through losses of alleles © 2011 Pearson Education, Inc. Animation: Causes of Evolutionary ChangeCauses of Evolutionary Change
  • 54.
    Figure 23.9-1 Generation 1 p(frequency of CR ) = 0.7 q (frequency of CW ) = 0.3 CR CR CR CR CR CW CW CW CR CR CR CW CR CR CR CW CR CR CR CW
  • 55.
    Figure 23.9-2 5 plants leave off- spring Generation 1 p(frequency of CR ) = 0.7 q (frequency of CW ) = 0.3 CR CR CR CR CR CW CW CW CR CR CR CW CR CR CR CW CR CR CR CW CR CR CW CW CR CW CR CR CW CW CR CW CW CW CR CR CR CW CR CW Generation 2 p = 0.5 q = 0.5
  • 56.
    Figure 23.9-3 5 plants leave off- spring Generation 1 p(frequency of CR ) = 0.7 q (frequency of CW ) = 0.3 CR CR CR CR CR CW CW CW CR CR CR CW CR CR CR CW CR CR CR CW CR CR CW CW CR CW CR CR CW CW CR CW CW CW CR CR CR CW CR CW Generation 2 p = 0.5 q = 0.5 2 plants leave off- spring CR CR CR CR CR CR CR CR CR CR CR CR CR CR CR CR CR CR CR CR Generation 3 p = 1.0 q = 0.0
  • 57.
    The Founder Effect •The founder effect occurs when a few individuals become isolated from a larger population • Allele frequencies in the small founder population can be different from those in the larger parent population © 2011 Pearson Education, Inc.
  • 58.
    The Bottleneck Effect •The bottleneck effect is a sudden reduction in population size due to a change in the environment • The resulting gene pool may no longer be reflective of the original population’s gene pool • If the population remains small, it may be further affected by genetic drift © 2011 Pearson Education, Inc.
  • 59.
  • 60.
  • 61.
  • 62.
    • Understanding thebottleneck effect can increase understanding of how human activity affects other species © 2011 Pearson Education, Inc.
  • 63.
    Case Study: Impactof Genetic Drift on the Greater Prairie Chicken • Loss of prairie habitat caused a severe reduction in the population of greater prairie chickens in Illinois • The surviving birds had low levels of genetic variation, and only 50% of their eggs hatched © 2011 Pearson Education, Inc.
  • 64.
    Figure 23.11 Pre-bottleneck (Illinois, 1820) Post-bottleneck (Illinois,1993) Greater prairie chicken Range of greater prairie chicken (a) Location Population size Number of alleles per locus Percentage of eggs hatched 93 <50 5.2 3.7 5.8 5.8 99 96 1,000–25,000 <50 750,000 75,000– 200,000 Nebraska, 1998 (no bottleneck) (b) Kansas, 1998 (no bottleneck) Illinois 1930–1960s 1993
  • 65.
    Figure 23.11a Pre-bottleneck (Illinois, 1820) Post-bottleneck (Illinois,1993) Greater prairie chicken Range of greater prairie chicken (a)
  • 66.
    Figure 23.11b Location Population size Number ofalleles per locus Percentage of eggs hatched 93 <50 5.2 3.7 5.8 5.8 99 96 1,000–25,000 <50 750,000 75,000– 200,000 Nebraska, 1998 (no bottleneck) (b) Kansas, 1998 (no bottleneck) Illinois 1930–1960s 1993
  • 67.
  • 68.
    • Researchers usedDNA from museum specimens to compare genetic variation in the population before and after the bottleneck • The results showed a loss of alleles at several loci • Researchers introduced greater prairie chickens from population in other states and were successful in introducing new alleles and increasing the egg hatch rate to 90% © 2011 Pearson Education, Inc.
  • 69.
    Effects of GeneticDrift: A Summary 1. Genetic drift is significant in small populations 2. Genetic drift causes allele frequencies to change at random 3. Genetic drift can lead to a loss of genetic variation within populations 4. Genetic drift can cause harmful alleles to become fixed © 2011 Pearson Education, Inc.
  • 70.
    Gene Flow • Geneflow consists of the movement of alleles among populations • Alleles can be transferred through the movement of fertile individuals or gametes (for example, pollen) • Gene flow tends to reduce variation among populations over time © 2011 Pearson Education, Inc.
  • 71.
    • Gene flowcan decrease the fitness of a population • Consider, for example, the great tit (Parus major) on the Dutch island of Vlieland – Mating causes gene flow between the central and eastern populations – Immigration from the mainland introduces alleles that decrease fitness – Natural selection selects for alleles that increase fitness – Birds in the central region with high immigration have a lower fitness; birds in the east with low immigration have a higher fitness © 2011 Pearson Education, Inc.
  • 72.
    Figure 23.12 Population inwhich the surviving females eventually bred Central Eastern Survivalrate(%) Females born in central population Females born in eastern population Parus major 60 50 40 30 20 10 0 Central population NORTH SEA Eastern population Vlieland, the Netherlands 2 km
  • 73.
  • 74.
    • Gene flowcan increase the fitness of a population • Consider, for example, the spread of alleles for resistance to insecticides – Insecticides have been used to target mosquitoes that carry West Nile virus and malaria – Alleles have evolved in some populations that confer insecticide resistance to these mosquitoes – The flow of insecticide resistance alleles into a population can cause an increase in fitness © 2011 Pearson Education, Inc.
  • 75.
    • Gene flowis an important agent of evolutionary change in human populations © 2011 Pearson Education, Inc.
  • 76.
    • Evolution bynatural selection involves both change and “sorting” – New genetic variations arise by chance – Beneficial alleles are “sorted” and favored by natural selection • Only natural selection consistently results in adaptive evolution Concept 23.4: Natural selection is the only mechanism that consistently causes adaptive evolution © 2011 Pearson Education, Inc.
  • 77.
    A Closer Lookat Natural Selection • Natural selection brings about adaptive evolution by acting on an organism’s phenotype © 2011 Pearson Education, Inc.
  • 78.
    Relative Fitness • Thephrases “struggle for existence” and “survival of the fittest” are misleading as they imply direct competition among individuals • Reproductive success is generally more subtle and depends on many factors © 2011 Pearson Education, Inc.
  • 79.
    • Relative fitnessis the contribution an individual makes to the gene pool of the next generation, relative to the contributions of other individuals • Selection favors certain genotypes by acting on the phenotypes of certain organisms © 2011 Pearson Education, Inc.
  • 80.
    Directional, Disruptive, andStabilizing Selection • Three modes of selection: – Directional selection favors individuals at one end of the phenotypic range – Disruptive selection favors individuals at both extremes of the phenotypic range – Stabilizing selection favors intermediate variants and acts against extreme phenotypes © 2011 Pearson Education, Inc.
  • 81.
    Figure 23.13 Original population Phenotypes(fur color)Frequencyof individualsOriginal population Evolved population (a) Directional selection (b) Disruptive selection (c) Stabilizing selection
  • 82.
  • 83.
  • 84.
  • 85.
    The Key Roleof Natural Selection in Adaptive Evolution • Striking adaptation have arisen by natural selection – For example, cuttlefish can change color rapidly for camouflage – For example, the jaws of snakes allow them to swallow prey larger than their heads © 2011 Pearson Education, Inc.
  • 86.
    Figure 23.14 Bones shownin green are movable. Ligament
  • 87.
  • 88.
    • Natural selectionincreases the frequencies of alleles that enhance survival and reproduction • Adaptive evolution occurs as the match between an organism and its environment increases • Because the environment can change, adaptive evolution is a continuous process © 2011 Pearson Education, Inc.
  • 89.
    • Genetic driftand gene flow do not consistently lead to adaptive evolution as they can increase or decrease the match between an organism and its environment © 2011 Pearson Education, Inc.
  • 90.
    Sexual Selection • Sexualselection is natural selection for mating success • It can result in sexual dimorphism, marked differences between the sexes in secondary sexual characteristics © 2011 Pearson Education, Inc.
  • 91.
  • 92.
    • Intrasexual selectionis competition among individuals of one sex (often males) for mates of the opposite sex • Intersexual selection, often called mate choice, occurs when individuals of one sex (usually females) are choosy in selecting their mates • Male showiness due to mate choice can increase a male’s chances of attracting a female, while decreasing his chances of survival © 2011 Pearson Education, Inc.
  • 93.
    • How dofemale preferences evolve? • The good genes hypothesis suggests that if a trait is related to male health, both the male trait and female preference for that trait should increase in frequency © 2011 Pearson Education, Inc.
  • 94.
    Figure 23.16 EXPERIMENT Recording ofSC male’s call Recording of LC male’s call LC male gray tree frog SC male gray tree frog Female gray tree frog SC sperm × Eggs × LC sperm Offspring of Offspring of SC father LC father Survival and growth of these half-sibling offspring compared RESULTS Time to metamorphosis Larval survival Larval growth NSD = no significant difference; LC better = offspring of LC males superior to offspring of SC males. Offspring Performance 1995 1996 LC better NSD NSD LC better (shorter) LC better (shorter) LC better
  • 95.
    Figure 23.16a EXPERIMENT Recording ofSC male’s call Recording of LC male’s call LC male gray tree frog SC male gray tree frog Female gray tree frog SC sperm × Eggs × LC sperm Offspring of Offspring of SC father LC father Survival and growth of these half-sibling offspring compared
  • 96.
    Figure 23.16b RESULTS Time tometamorphosis Larval survival Larval growth NSD = no significant difference; LC better = offspring of LC males superior to offspring of SC males. Offspring Performance 1995 1996 LC better NSD NSD LC better (shorter) LC better (shorter) LC better
  • 97.
    The Preservation ofGenetic Variation • Neutral variation is genetic variation that does not confer a selective advantage or disadvantage • Various mechanisms help to preserve genetic variation in a population © 2011 Pearson Education, Inc.
  • 98.
    Diploidy • Diploidy maintainsgenetic variation in the form of hidden recessive alleles • Heterozygotes can carry recessive alleles that are hidden from the effects of selection © 2011 Pearson Education, Inc.
  • 99.
    Balancing Selection • Balancingselection occurs when natural selection maintains stable frequencies of two or more phenotypic forms in a population • Balancing selection includes – Heterozygote advantage – Frequency-dependent selection © 2011 Pearson Education, Inc.
  • 100.
    • Heterozygote advantageoccurs when heterozygotes have a higher fitness than do both homozygotes • Natural selection will tend to maintain two or more alleles at that locus • The sickle-cell allele causes mutations in hemoglobin but also confers malaria resistance Heterozygote Advantage © 2011 Pearson Education, Inc.
  • 101.
    Figure 23.17 Distribution of malariacaused by Plasmodium falciparum (a parasitic unicellular eukaryote) Key Frequencies of the sickle-cell allele 0–2.5% 2.5–5.0% 5.0–7.5% 7.5–10.0% 10.0–12.5% >12.5%
  • 102.
    • In frequency-dependentselection, the fitness of a phenotype declines if it becomes too common in the population • Selection can favor whichever phenotype is less common in a population • For example, frequency-dependent selection selects for approximately equal numbers of “right-mouthed” and “left-mouthed” scale-eating fish Frequency-Dependent Selection © 2011 Pearson Education, Inc.
  • 103.
    “Left-mouthed” P. microlepis “Right-mouthed” P. microlepis 1.0 0.5 0 1981 Sampleyear ’82 ’83 ’84 ’85 ’86 ’87 ’88 ’89 ’90 Frequencyof “left-mouthed”individuals Figure 23.18
  • 104.
    Why Natural SelectionCannot Fashion Perfect Organisms 1. Selection can act only on existing variations 2. Evolution is limited by historical constraints 3. Adaptations are often compromises 4. Chance, natural selection, and the environment interact © 2011 Pearson Education, Inc.
  • 105.
  • 106.
  • 107.
  • 108.
    Figure 23.UN03 Sampling sites (1–8represent pairs of sites) Allele frequencies lap94 alleles Other lap alleles Salinity increases toward the open ocean Long Island Sound Atlantic Ocean Data from R. K. Koehn and T. J. Hilbish, The adaptive importance of genetic variation, American Scientist 75:134–141 (1987). 1 2 2 3 4 5 6 7 8 9 10 11 1 2 3 4 5 6 7 8 9 10 11
  • 109.

Editor's Notes

  • #4 Figure 23.1 Is this finch evolving?
  • #5 Figure 23.2 Evidence of selection by food source.
  • #9 Figure 23.3 Nonheritable variation.
  • #10 Figure 23.3 Nonheritable variation.
  • #11 Figure 23.3 Nonheritable variation.
  • #15 Figure 23.4 Geographic variation in isolated mouse populations on Madeira.
  • #16 Figure 23.4 Geographic variation in isolated mouse populations on Madeira.
  • #17 Figure 23.4 Geographic variation in isolated mouse populations on Madeira.
  • #18 Figure 23.4 Geographic variation in isolated mouse populations on Madeira.
  • #20 Figure 23.5 A cline determined by temperature.
  • #30 Figure 23.6 One species, two populations.
  • #31 Figure 23.6 One species, two populations.
  • #32 Figure 23.6 One species, two populations.
  • #39 Figure 23.7 Selecting alleles at random from a gene pool.
  • #42 Figure 23.8 The Hardy-Weinberg principle.
  • #43 Figure 23.8 The Hardy-Weinberg principle.
  • #44 Figure 23.8 The Hardy-Weinberg principle.
  • #55 Figure 23.9 Genetic drift.
  • #56 Figure 23.9 Genetic drift.
  • #57 Figure 23.9 Genetic drift.
  • #60 Figure 23.10 The bottleneck effect.
  • #61 Figure 23.10 The bottleneck effect.
  • #62 Figure 23.10 The bottleneck effect.
  • #65 Figure 23.11 Genetic drift and loss of genetic variation.
  • #66 Figure 23.11 Genetic drift and loss of genetic variation.
  • #67 Figure 23.11 Genetic drift and loss of genetic variation.
  • #68 Figure 23.11 Genetic drift and loss of genetic variation.
  • #73 Figure 23.12 Gene flow and local adaptation.
  • #74 Figure 23.12 Gene flow and local adaptation.
  • #82 Figure 23.13 Modes of selection.
  • #83 Figure 23.13 Modes of selection.
  • #84 Figure 23.13 Modes of selection.
  • #85 Figure 23.13 Modes of selection.
  • #87 Figure 23.14 Movable jaw bones in snakes.
  • #88 Figure 23.14 Movable jaw bones in snakes.
  • #92 Figure 23.15 Sexual dimorphism and sexual selection.
  • #95 Figure 23.16 Inquiry: Do females select mates based on traits indicative of “good genes”?
  • #96 Figure 23.16 Inquiry: Do females select mates based on traits indicative of “good genes”?
  • #97 Figure 23.16 Inquiry: Do females select mates based on traits indicative of “good genes”?
  • #102 Figure 23.17 Mapping malaria and the sickle-cell allele.
  • #104 Figure 23.18 Frequency-dependent selection in scale-eating fish (Perissodus microlepis).
  • #106 Figure 23.19 Evolutionary compromise.
  • #107 Figure 23.UN01 In-text figure, p. 473
  • #108 Figure 23.UN02 Summary figure, Concept 23.4
  • #109 Figure 23.UN03 Test Your Understanding, question 8
  • #110 Figure 23.UN04 Appendix A: answer to Test Your Understanding, question 8