Download free for 30 days
Sign in
Upload
Language (EN)
Support
Business
Mobile
Social Media
Marketing
Technology
Art & Photos
Career
Design
Education
Presentations & Public Speaking
Government & Nonprofit
Healthcare
Internet
Law
Leadership & Management
Automotive
Engineering
Software
Recruiting & HR
Retail
Sales
Services
Science
Small Business & Entrepreneurship
Food
Environment
Economy & Finance
Data & Analytics
Investor Relations
Sports
Spiritual
News & Politics
Travel
Self Improvement
Real Estate
Entertainment & Humor
Health & Medicine
Devices & Hardware
Lifestyle
Change Language
Language
English
Español
Português
Français
Deutsche
Cancel
Save
EN
Uploaded by
apkicksit
PPTX, PDF
13 views
Advanced Placement (AP) Biology Chap 23 Notes
Advanced Placement (AP) Biology Chap 23 Notes
Education
◦
Read more
0
Save
Share
Embed
Embed presentation
Download
Download to read offline
1
/ 82
2
/ 82
3
/ 82
4
/ 82
5
/ 82
6
/ 82
7
/ 82
8
/ 82
9
/ 82
10
/ 82
11
/ 82
12
/ 82
13
/ 82
14
/ 82
15
/ 82
16
/ 82
17
/ 82
18
/ 82
19
/ 82
20
/ 82
21
/ 82
22
/ 82
23
/ 82
24
/ 82
25
/ 82
26
/ 82
27
/ 82
28
/ 82
29
/ 82
30
/ 82
31
/ 82
32
/ 82
33
/ 82
34
/ 82
35
/ 82
36
/ 82
37
/ 82
38
/ 82
39
/ 82
40
/ 82
41
/ 82
42
/ 82
43
/ 82
44
/ 82
45
/ 82
46
/ 82
47
/ 82
48
/ 82
49
/ 82
50
/ 82
51
/ 82
52
/ 82
53
/ 82
54
/ 82
55
/ 82
56
/ 82
57
/ 82
58
/ 82
59
/ 82
60
/ 82
61
/ 82
62
/ 82
63
/ 82
64
/ 82
65
/ 82
66
/ 82
67
/ 82
68
/ 82
69
/ 82
70
/ 82
71
/ 82
72
/ 82
73
/ 82
74
/ 82
75
/ 82
76
/ 82
77
/ 82
78
/ 82
79
/ 82
80
/ 82
81
/ 82
82
/ 82
More Related Content
PDF
Chapter 23 The Evolution of Population. pdf
by
azzahraasysyifa1
PDF
05 population variation and selection
by
Indranil Bhattacharjee
PDF
Chapter 23_The Evolution of Populations.ppt.pdf
by
tuannguyen010700
PPT
2.-Explain-the-mechanisms-that-produce-change-in-population.ppt
by
ReymrkDemyBlds
PPT
chap23 (1).ppt
by
whataretthose
PPT
23 lecture evolution_populations
by
veneethmathew
PPT
Biology in Focus - Chapter 21
by
mpattani
PDF
23lecturepresentation-100812184052-phpapp02-180328062258 (1).pdf
by
SBCWongPoonWing
Chapter 23 The Evolution of Population. pdf
by
azzahraasysyifa1
05 population variation and selection
by
Indranil Bhattacharjee
Chapter 23_The Evolution of Populations.ppt.pdf
by
tuannguyen010700
2.-Explain-the-mechanisms-that-produce-change-in-population.ppt
by
ReymrkDemyBlds
chap23 (1).ppt
by
whataretthose
23 lecture evolution_populations
by
veneethmathew
Biology in Focus - Chapter 21
by
mpattani
23lecturepresentation-100812184052-phpapp02-180328062258 (1).pdf
by
SBCWongPoonWing
Similar to Advanced Placement (AP) Biology Chap 23 Notes
PPTX
Population genetics
by
LubnaSSubair
PPTX
microevolution
by
Aftab Badshah
PDF
Population Genetics
by
Nistarini College, Purulia (W.B) India
PPT
Ch 23_Evolution of Population.ppt
by
YdemneYdemne
DOCX
Allele frequency
by
Aftab Badshah
PPTX
23 lecture BIOL 1010-30 Gillette College
by
deskam2
DOC
Form 5 chapter 9-variation
by
Bong Tong
PDF
Population Genetics AQA
by
University of Brighton
PPTX
3)_Hardy_Weinberg_Equilibrium provides a framework.copy.pptx
by
lalaicapute
PPTX
Hardy-Weinberg principle_Birhan Kassa.pptx
by
birhankassa
DOCX
PAGE UMUC Asia DE lab – Evolution© UMUC – all rights reserv.docx
by
alfred4lewis58146
PPT
Campbell chapter 23-for biology lovers i would say
by
thucchi29072009
PPT
Campbell population genetics and evolution.ppt
by
DenizUgur5
PPT
the evolution 23_lecture_presentation_0.ppt
by
khalidmr1830
PPTX
Hardy-Weinberg Principle and Effects of Evolutionary Forces
by
kaurbhavleen25
PPT
11. Hardy-Weinberg Principle.ppt Genetics
by
JenniferEbascoVicent
PPT
23 the evolution of populations
by
kindarspirit
PPTX
chapter_19_powerpoint.pptx
by
birhankassa
PPTX
hardy Weinberg equilibrium.pptx.com..pk.
by
mhab0869
PPTX
Hardy-Weinberg Principle and Effects of Evolutionary Forces.pptx
by
kaurbhavleen25
Population genetics
by
LubnaSSubair
microevolution
by
Aftab Badshah
Population Genetics
by
Nistarini College, Purulia (W.B) India
Ch 23_Evolution of Population.ppt
by
YdemneYdemne
Allele frequency
by
Aftab Badshah
23 lecture BIOL 1010-30 Gillette College
by
deskam2
Form 5 chapter 9-variation
by
Bong Tong
Population Genetics AQA
by
University of Brighton
3)_Hardy_Weinberg_Equilibrium provides a framework.copy.pptx
by
lalaicapute
Hardy-Weinberg principle_Birhan Kassa.pptx
by
birhankassa
PAGE UMUC Asia DE lab – Evolution© UMUC – all rights reserv.docx
by
alfred4lewis58146
Campbell chapter 23-for biology lovers i would say
by
thucchi29072009
Campbell population genetics and evolution.ppt
by
DenizUgur5
the evolution 23_lecture_presentation_0.ppt
by
khalidmr1830
Hardy-Weinberg Principle and Effects of Evolutionary Forces
by
kaurbhavleen25
11. Hardy-Weinberg Principle.ppt Genetics
by
JenniferEbascoVicent
23 the evolution of populations
by
kindarspirit
chapter_19_powerpoint.pptx
by
birhankassa
hardy Weinberg equilibrium.pptx.com..pk.
by
mhab0869
Hardy-Weinberg Principle and Effects of Evolutionary Forces.pptx
by
kaurbhavleen25
Recently uploaded
PDF
Pharmaceutical Quality Assurance Unit 1 (BP606T)
by
Chetan Mali
PPTX
Greengnorance Toolkit Module 2 Energy saving
by
Karl Donert
PPTX
Plant fibres used as surgical dressings & Sutures – Surgical Catgut and Ligat...
by
Sai Meer College of Pharmacy
PPTX
Problem and Solution (PowerPoint Game Template)
by
acpaulite
PPTX
How to Change Shipping Label Size in Odoo 18 Inventory
by
Celine George
PDF
Workshop 29 Crystal Review All Students by YogiGoddess
by
©LDMMIA, ©Reiki Yoga
PDF
Bones by Sadu Kassam (play) story ppt pdf
by
RonnieMaeBorres
PPTX
Greengnorance Toolkit Module 4 Active Mobility and Transport
by
Karl Donert
PPTX
Greengnorance Toolkit Module 5 Waste Management
by
Karl Donert
PDF
Nursing care plan for Vomiting /B.Sc nsg
by
Dr. Sudhadevi Sadanandan
PDF
Pratishta Educational Society., Courses & Opportunities
by
GanapathiVankudoth
PPTX
ENGLISH-7-Quarter-4-Week-3 Matatag .pptx
by
KimberlyJadeCuyos
PPTX
GRADE 8_WEEK 2_QUARTER 4_ENGLISH_MATATAG.pptx
by
RoinelReyes1
PPTX
Math 8 Quarter 4 Week 3 PRIMARY DATA.pptx
by
shahanieabbat3
PPTX
Math 8 Quarter 4 Week 4-SECONDARY DATA.pptx
by
shahanieabbat3
PPTX
Q4_PPT MUSIC & ARTS 7 week 1-2, matatag curriculum
by
ZEN
PDF
Chapter 05 Drugs Acting on the Central Nervous System: Anti-Depressant Drugs
by
SandeshSul
PPTX
How to Configure Dispatch Management System in Odoo 18 Inventory
by
Celine George
PDF
How "Raiders of the Lost Ark" and "Ordinary People" Employ Non-Verbal Acting
by
6x5csns4pn
PDF
Artificial Intelligence in Research and Academic Writing, Workshop on Researc...
by
Prof. Vinod Kumar Kanvaria
Pharmaceutical Quality Assurance Unit 1 (BP606T)
by
Chetan Mali
Greengnorance Toolkit Module 2 Energy saving
by
Karl Donert
Plant fibres used as surgical dressings & Sutures – Surgical Catgut and Ligat...
by
Sai Meer College of Pharmacy
Problem and Solution (PowerPoint Game Template)
by
acpaulite
How to Change Shipping Label Size in Odoo 18 Inventory
by
Celine George
Workshop 29 Crystal Review All Students by YogiGoddess
by
©LDMMIA, ©Reiki Yoga
Bones by Sadu Kassam (play) story ppt pdf
by
RonnieMaeBorres
Greengnorance Toolkit Module 4 Active Mobility and Transport
by
Karl Donert
Greengnorance Toolkit Module 5 Waste Management
by
Karl Donert
Nursing care plan for Vomiting /B.Sc nsg
by
Dr. Sudhadevi Sadanandan
Pratishta Educational Society., Courses & Opportunities
by
GanapathiVankudoth
ENGLISH-7-Quarter-4-Week-3 Matatag .pptx
by
KimberlyJadeCuyos
GRADE 8_WEEK 2_QUARTER 4_ENGLISH_MATATAG.pptx
by
RoinelReyes1
Math 8 Quarter 4 Week 3 PRIMARY DATA.pptx
by
shahanieabbat3
Math 8 Quarter 4 Week 4-SECONDARY DATA.pptx
by
shahanieabbat3
Q4_PPT MUSIC & ARTS 7 week 1-2, matatag curriculum
by
ZEN
Chapter 05 Drugs Acting on the Central Nervous System: Anti-Depressant Drugs
by
SandeshSul
How to Configure Dispatch Management System in Odoo 18 Inventory
by
Celine George
How "Raiders of the Lost Ark" and "Ordinary People" Employ Non-Verbal Acting
by
6x5csns4pn
Artificial Intelligence in Research and Academic Writing, Workshop on Researc...
by
Prof. Vinod Kumar Kanvaria
Advanced Placement (AP) Biology Chap 23 Notes
1.
© 2014 Pearson
Education, Inc. The Evolution of Populations Chapter 23
2.
© 2014 Pearson
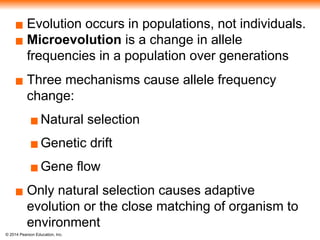
Education, Inc. ▪ Evolution occurs in populations, not individuals. ▪ Microevolution is a change in allele frequencies in a population over generations ▪ Three mechanisms cause allele frequency change: ▪Natural selection ▪Genetic drift ▪Gene flow ▪ Only natural selection causes adaptive evolution or the close matching of organism to environment
3.
© 2014 Pearson
Education, Inc. 23.1 Genetic Variation ▪ Genetic variation among individuals is caused by differences in genes or other DNA segments ▪ Phenotype is the product of ▪inherited genotype ▪environmental influences (ex: nutrition, temperature, light) ▪ Natural selection can only act on variation with a genetic component
4.
© 2014 Pearson
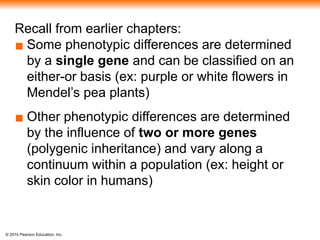
Education, Inc. Recall from earlier chapters: ▪ Some phenotypic differences are determined by a single gene and can be classified on an either-or basis (ex: purple or white flowers in Mendel’s pea plants) ▪ Other phenotypic differences are determined by the influence of two or more genes (polygenic inheritance) and vary along a continuum within a population (ex: height or skin color in humans)
5.
© 2014 Pearson
Education, Inc. Figure 23.4 Base-pair substitutions Insertion sites Exon Intron Deletion Substitution resulting in translation of different amino acid 1 500 1,000 1,500 2,000 2,500 Genetic variation can also be measured at the molecular level of DNA (nucleotide variability) but little results in phenotypic variation. Why?
6.
© 2014 Pearson
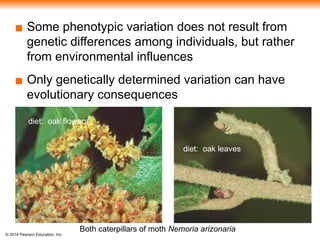
Education, Inc. ▪ Some phenotypic variation does not result from genetic differences among individuals, but rather from environmental influences ▪ Only genetically determined variation can have evolutionary consequences diet: oak flowers diet: oak leaves Both caterpillars of moth Nemoria arizonaria
7.
© 2014 Pearson
Education, Inc. Sources of Genetic Variation ▪ new genes can arise by mutation (can be harmful, helpful, or neutral) ▪ gene duplication ▪ rapid reproduction ▪ Sexual reproduction can result in genetic variation by recombining existing alleles (shuffling in crossing over, independent assortment, myriad of possible mating combinations during fertilization)
8.
© 2014 Pearson
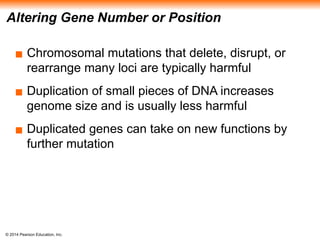
Education, Inc. Altering Gene Number or Position ▪ Chromosomal mutations that delete, disrupt, or rearrange many loci are typically harmful ▪ Duplication of small pieces of DNA increases genome size and is usually less harmful ▪ Duplicated genes can take on new functions by further mutation
9.
© 2014 Pearson
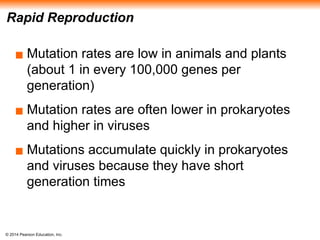
Education, Inc. Rapid Reproduction ▪ Mutation rates are low in animals and plants (about 1 in every 100,000 genes per generation) ▪ Mutation rates are often lower in prokaryotes and higher in viruses ▪ Mutations accumulate quickly in prokaryotes and viruses because they have short generation times
10.
© 2014 Pearson
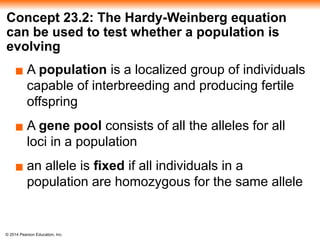
Education, Inc. Concept 23.2: The Hardy-Weinberg equation can be used to test whether a population is evolving ▪ A population is a localized group of individuals capable of interbreeding and producing fertile offspring ▪ A gene pool consists of all the alleles for all loci in a population ▪ an allele is fixed if all individuals in a population are homozygous for the same allele
11.
© 2014 Pearson
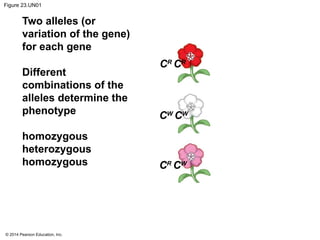
Education, Inc. Figure 23.UN01 CR CR CR CW CW CW Two alleles (or variation of the gene) for each gene Different combinations of the alleles determine the phenotype homozygous heterozygous homozygous
12.
© 2014 Pearson
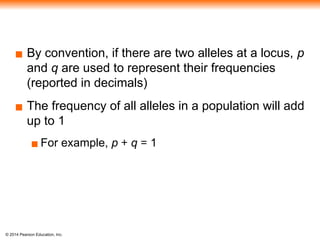
Education, Inc. ▪ By convention, if there are two alleles at a locus, p and q are used to represent their frequencies (reported in decimals) ▪ The frequency of all alleles in a population will add up to 1 ▪ For example, p + q = 1
13.
© 2014 Pearson
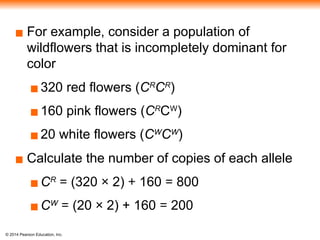
Education, Inc. ▪ For example, consider a population of wildflowers that is incompletely dominant for color ▪320 red flowers (CR CR ) ▪160 pink flowers (CR CW ) ▪20 white flowers (CW CW ) ▪ Calculate the number of copies of each allele ▪CR = (320 × 2) + 160 = 800 ▪CW = (20 × 2) + 160 = 200
14.
© 2014 Pearson
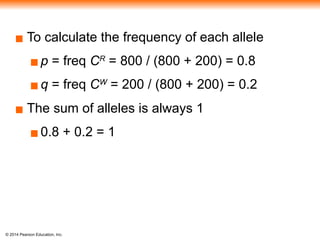
Education, Inc. ▪ To calculate the frequency of each allele ▪p = freq CR = 800 / (800 + 200) = 0.8 ▪q = freq CW = 200 / (800 + 200) = 0.2 ▪ The sum of alleles is always 1 ▪0.8 + 0.2 = 1
15.
© 2014 Pearson
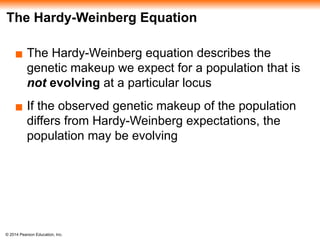
Education, Inc. The Hardy-Weinberg Equation ▪ The Hardy-Weinberg equation describes the genetic makeup we expect for a population that is not evolving at a particular locus ▪ If the observed genetic makeup of the population differs from Hardy-Weinberg expectations, the population may be evolving
16.
© 2014 Pearson
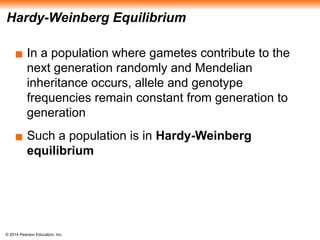
Education, Inc. Hardy-Weinberg Equilibrium ▪ In a population where gametes contribute to the next generation randomly and Mendelian inheritance occurs, allele and genotype frequencies remain constant from generation to generation ▪ Such a population is in Hardy-Weinberg equilibrium
17.
© 2014 Pearson
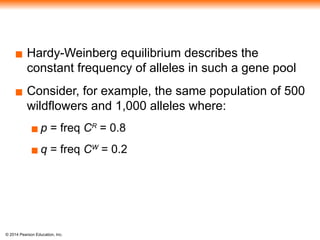
Education, Inc. ▪ Hardy-Weinberg equilibrium describes the constant frequency of alleles in such a gene pool ▪ Consider, for example, the same population of 500 wildflowers and 1,000 alleles where: ▪ p = freq CR = 0.8 ▪ q = freq CW = 0.2
18.
© 2014 Pearson
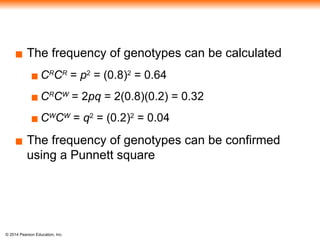
Education, Inc. ▪ The frequency of genotypes can be calculated ▪ CR CR = p2 = (0.8)2 = 0.64 ▪ CR CW = 2pq = 2(0.8)(0.2) = 0.32 ▪ CW CW = q2 = (0.2)2 = 0.04 ▪ The frequency of genotypes can be confirmed using a Punnett square
19.
© 2014 Pearson
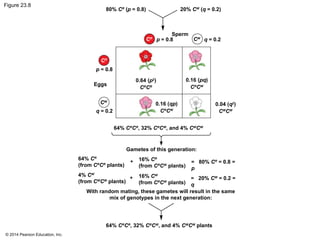
Education, Inc. Figure 23.8 80% CR (p = 0.8) 20% CW (q = 0.2) Sperm p = 0.8 q = 0.2 CW CR CR CW p = 0.8 q = 0.2 Eggs 0.64 (p2 ) CR CR 0.16 (qp) CR CW 0.04 (q2 ) CW CW 0.16 (pq) CR CW 64% CR CR , 32% CR CW , and 4% CW CW 64% CR (from CR CR plants) 16% CR (from CR CW plants) 4% CW (from CW CW plants) 16% CW (from CR CW plants) = 80% CR = 0.8 = p = 20% CW = 0.2 = q + + 64% CR CR , 32% CR CW , and 4% CW CW plants Gametes of this generation: With random mating, these gametes will result in the same mix of genotypes in the next generation:
20.
© 2014 Pearson
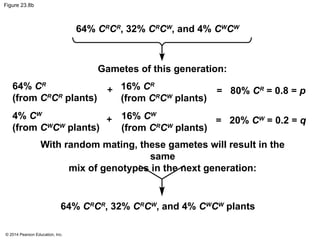
Education, Inc. Figure 23.8b 64% CR CR , 32% CR CW , and 4% CW CW 64% CR (from CR CR plants) 16% CR (from CR CW plants) 4% CW (from CW CW plants) 16% CW (from CR CW plants) = 80% CR = 0.8 = p = 20% CW = 0.2 = q + + 64% CR CR , 32% CR CW , and 4% CW CW plants Gametes of this generation: With random mating, these gametes will result in the same mix of genotypes in the next generation:
21.
© 2014 Pearson
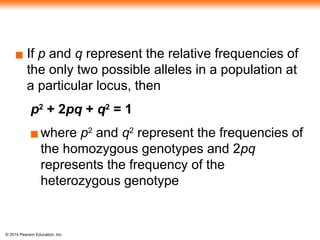
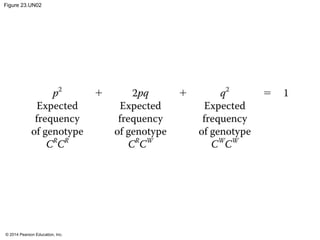
Education, Inc. ▪ If p and q represent the relative frequencies of the only two possible alleles in a population at a particular locus, then p2 + 2pq + q2 = 1 ▪where p2 and q2 represent the frequencies of the homozygous genotypes and 2pq represents the frequency of the heterozygous genotype
22.
© 2014 Pearson
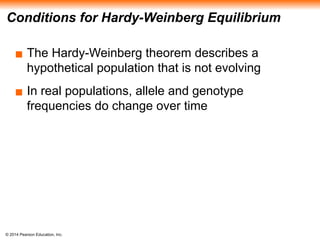
Education, Inc. Conditions for Hardy-Weinberg Equilibrium ▪ The Hardy-Weinberg theorem describes a hypothetical population that is not evolving ▪ In real populations, allele and genotype frequencies do change over time
23.
© 2014 Pearson
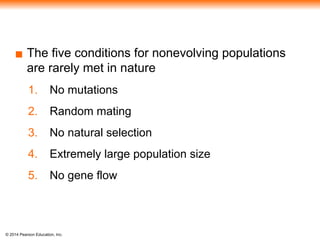
Education, Inc. ▪ The five conditions for nonevolving populations are rarely met in nature 1. No mutations 2. Random mating 3. No natural selection 4. Extremely large population size 5. No gene flow
24.
© 2014 Pearson
Education, Inc. ▪ Natural populations can evolve at some loci, while being in Hardy-Weinberg equilibrium at other loci
25.
© 2014 Pearson
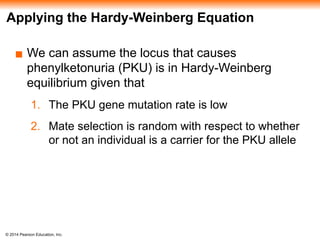
Education, Inc. Applying the Hardy-Weinberg Equation ▪ We can assume the locus that causes phenylketonuria (PKU) is in Hardy-Weinberg equilibrium given that 1. The PKU gene mutation rate is low 2. Mate selection is random with respect to whether or not an individual is a carrier for the PKU allele
26.
© 2014 Pearson
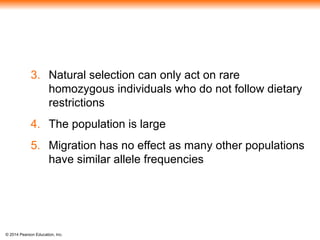
Education, Inc. 3. Natural selection can only act on rare homozygous individuals who do not follow dietary restrictions 4. The population is large 5. Migration has no effect as many other populations have similar allele frequencies
27.
© 2014 Pearson
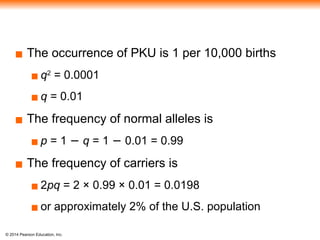
Education, Inc. ▪ The occurrence of PKU is 1 per 10,000 births ▪ q2 = 0.0001 ▪ q = 0.01 ▪ The frequency of normal alleles is ▪ p = 1 − q = 1 − 0.01 = 0.99 ▪ The frequency of carriers is ▪ 2pq = 2 × 0.99 × 0.01 = 0.0198 ▪ or approximately 2% of the U.S. population
28.
© 2014 Pearson
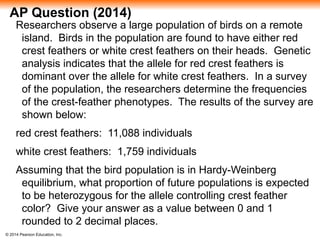
Education, Inc. AP Question (2014) Researchers observe a large population of birds on a remote island. Birds in the population are found to have either red crest feathers or white crest feathers on their heads. Genetic analysis indicates that the allele for red crest feathers is dominant over the allele for white crest feathers. In a survey of the population, the researchers determine the frequencies of the crest-feather phenotypes. The results of the survey are shown below: red crest feathers: 11,088 individuals white crest feathers: 1,759 individuals Assuming that the bird population is in Hardy-Weinberg equilibrium, what proportion of future populations is expected to be heterozygous for the allele controlling crest feather color? Give your answer as a value between 0 and 1 rounded to 2 decimal places.
29.
© 2014 Pearson
Education, Inc. Concept 23.3: Natural selection, genetic drift, and gene flow can alter allele frequencies in a population ▪ Three major factors alter allele frequencies and bring about most evolutionary change ▪ Natural selection ▪ Genetic drift ▪ Gene flow
30.
© 2014 Pearson
Education, Inc. Natural Selection ▪ Differential success in reproduction results in certain alleles being passed to the next generation in greater proportions ▪ For example, an allele that confers resistance to DDT in fruit flies increased in frequency after DDT was used widely in agriculture
31.
© 2014 Pearson
Education, Inc. ▪ Natural selection can cause adaptive evolution, an improvement in the match between organisms and their environment
32.
© 2014 Pearson
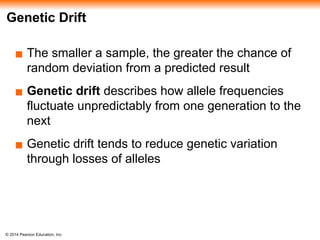
Education, Inc. Genetic Drift ▪ The smaller a sample, the greater the chance of random deviation from a predicted result ▪ Genetic drift describes how allele frequencies fluctuate unpredictably from one generation to the next ▪ Genetic drift tends to reduce genetic variation through losses of alleles
33.
© 2014 Pearson
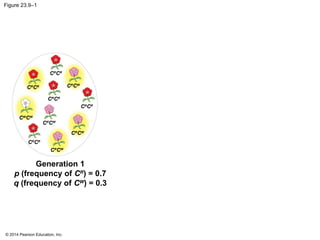
Education, Inc. Figure 23.9–1 Generation 1 p (frequency of CR ) = 0.7 q (frequency of CW ) = 0.3 CR CR CR CR CR CR CR CR CR CR CR CW CR CW CR CW CR CW CW CW
34.
© 2014 Pearson
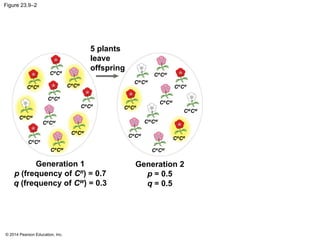
Education, Inc. Figure 23.9–2 Generation 1 p (frequency of CR ) = 0.7 q (frequency of CW ) = 0.3 Generation 2 p = 0.5 q = 0.5 CR CW CW CW CR CW CR CW CW CW CR CR CR CR CW CW CR CW CR CR 5 plants leave offspring CR CR CR CR CR CR CR CR CR CW CR CW CR CW CR CW CW CW CR CR
35.
© 2014 Pearson
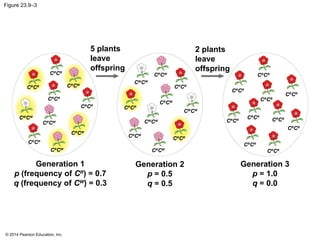
Education, Inc. Figure 23.9–3 Generation 2 p = 0.5 q = 0.5 5 plants leave offspring Generation 3 p = 1.0 q = 0.0 CR CR CR CR CR CR 2 plants leave offspring CR CR CR CR CR CR CR CR CR CR CR CR CR CR Generation 1 p (frequency of CR ) = 0.7 q (frequency of CW ) = 0.3 CR CW CW CW CR CW CR CW CW CW CR CR CR CR CW CW CR CW CR CR CR CR CR CR CR CR CR CR CR CW CR CW CR CW CR CW CW CW CR CR
36.
© 2014 Pearson
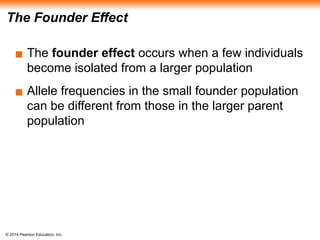
Education, Inc. The Founder Effect ▪ The founder effect occurs when a few individuals become isolated from a larger population ▪ Allele frequencies in the small founder population can be different from those in the larger parent population
37.
© 2014 Pearson
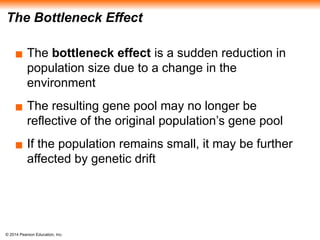
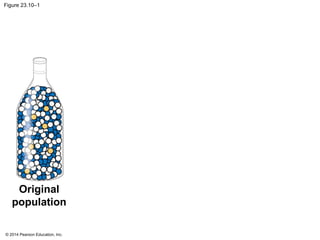
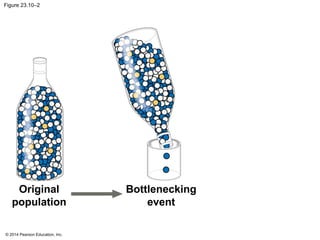
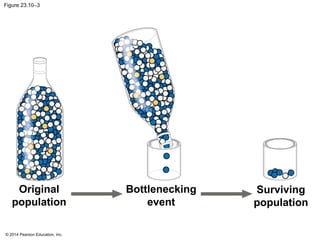
Education, Inc. The Bottleneck Effect ▪ The bottleneck effect is a sudden reduction in population size due to a change in the environment ▪ The resulting gene pool may no longer be reflective of the original population’s gene pool ▪ If the population remains small, it may be further affected by genetic drift
38.
© 2014 Pearson
Education, Inc. Figure 23.10–1 Original population
39.
© 2014 Pearson
Education, Inc. Figure 23.10–2 Original population Bottlenecking event
40.
© 2014 Pearson
Education, Inc. Figure 23.10–3 Original population Bottlenecking event Surviving population
41.
© 2014 Pearson
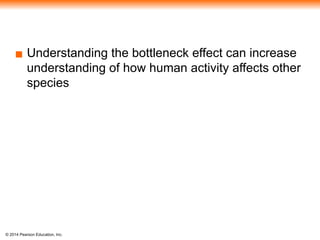
Education, Inc. ▪ Understanding the bottleneck effect can increase understanding of how human activity affects other species
42.
© 2014 Pearson
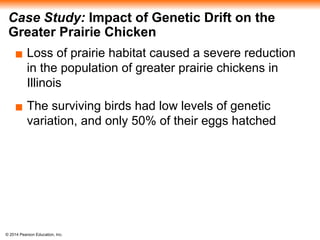
Education, Inc. Case Study: Impact of Genetic Drift on the Greater Prairie Chicken ▪ Loss of prairie habitat caused a severe reduction in the population of greater prairie chickens in Illinois ▪ The surviving birds had low levels of genetic variation, and only 50% of their eggs hatched
43.
© 2014 Pearson
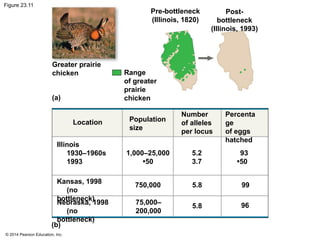
Education, Inc. Figure 23.11 Greater prairie chicken Pre-bottleneck (Illinois, 1820) Range of greater prairie chicken Post- bottleneck (Illinois, 1993) (a) Location Population size Number of alleles per locus Percenta ge of eggs hatched Illinois 1930–1960s 1993 Kansas, 1998 (no bottleneck) Nebraska, 1998 (no bottleneck) 1,000–25,000 •50 750,000 75,000– 200,000 5.2 3.7 93 •50 5.8 5.8 99 96 (b)
44.
© 2014 Pearson
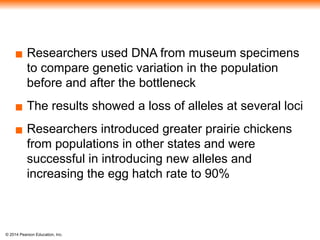
Education, Inc. ▪ Researchers used DNA from museum specimens to compare genetic variation in the population before and after the bottleneck ▪ The results showed a loss of alleles at several loci ▪ Researchers introduced greater prairie chickens from populations in other states and were successful in introducing new alleles and increasing the egg hatch rate to 90%
45.
© 2014 Pearson
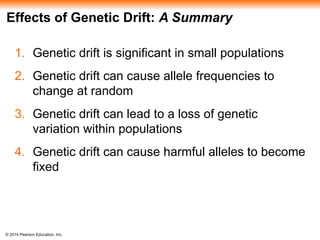
Education, Inc. Effects of Genetic Drift: A Summary 1. Genetic drift is significant in small populations 2. Genetic drift can cause allele frequencies to change at random 3. Genetic drift can lead to a loss of genetic variation within populations 4. Genetic drift can cause harmful alleles to become fixed
46.
© 2014 Pearson
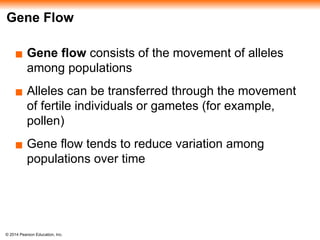
Education, Inc. Gene Flow ▪ Gene flow consists of the movement of alleles among populations ▪ Alleles can be transferred through the movement of fertile individuals or gametes (for example, pollen) ▪ Gene flow tends to reduce variation among populations over time
47.
© 2014 Pearson
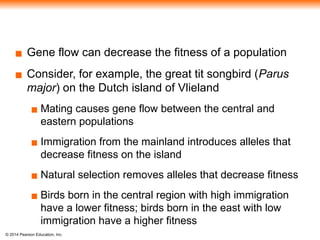
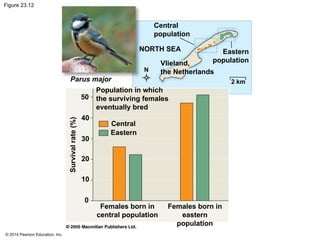
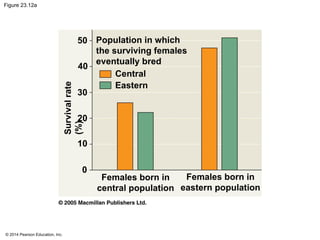
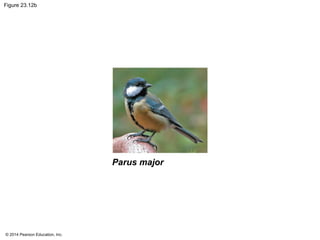
Education, Inc. ▪ Gene flow can decrease the fitness of a population ▪ Consider, for example, the great tit songbird (Parus major) on the Dutch island of Vlieland ▪ Mating causes gene flow between the central and eastern populations ▪ Immigration from the mainland introduces alleles that decrease fitness on the island ▪ Natural selection removes alleles that decrease fitness ▪ Birds born in the central region with high immigration have a lower fitness; birds born in the east with low immigration have a higher fitness
48.
© 2014 Pearson
Education, Inc. Figure 23.12 Parus major Central population NORTH SEA Eastern population Vlieland, the Netherlands N 2 km Population in which the surviving females eventually bred Central Eastern Survival rate (%) Females born in central population 50 40 30 20 10 0 Females born in eastern population
49.
© 2014 Pearson
Education, Inc. Figure 23.12a Population in which the surviving females eventually bred Central Eastern Survival rate (%) Females born in central population 50 40 30 20 10 0 Females born in eastern population
50.
© 2014 Pearson
Education, Inc. Figure 23.12b Parus major
51.
© 2014 Pearson
Education, Inc. ▪ Gene flow can increase the fitness of a population ▪ Consider, for example, the spread of alleles for resistance to insecticides ▪ Insecticides have been used to target mosquitoes that carry West Nile virus and malaria ▪ Alleles have evolved in some populations that confer insecticide resistance to these mosquitoes ▪ The flow of insecticide resistance alleles into a population can cause an increase in fitness
52.
© 2014 Pearson
Education, Inc. ▪ Gene flow is an important agent of evolutionary change in modern human populations
53.
© 2014 Pearson
Education, Inc. Concept 23.4: Natural selection is the only mechanism that consistently causes adaptive evolution ▪ Evolution by natural selection involves both chance and “sorting” ▪ New genetic variations arise by chance ▪ Beneficial alleles are “sorted” and favored by natural selection ▪ Only natural selection consistently increases the frequencies of alleles that provide reproductive advantage
54.
© 2014 Pearson
Education, Inc. Natural Selection: A Closer Look ▪ Natural selection brings about adaptive evolution by acting on an organism’s phenotype
55.
© 2014 Pearson
Education, Inc. Relative Fitness ▪ The phrases “struggle for existence” and “survival of the fittest” are misleading as they imply direct competition among individuals ▪ Reproductive success is generally more subtle and depends on many factors
56.
© 2014 Pearson
Education, Inc. ▪ Relative fitness is the contribution an individual makes to the gene pool of the next generation, relative to the contributions of other individuals ▪ Selection favors certain genotypes by acting on the phenotypes of individuals
57.
© 2014 Pearson
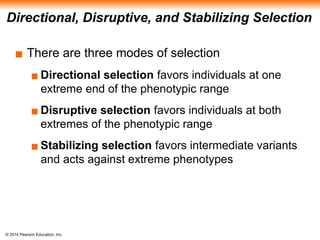
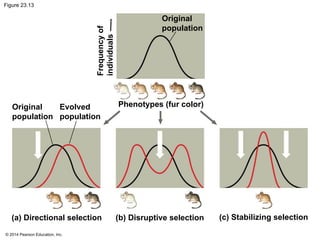
Education, Inc. Directional, Disruptive, and Stabilizing Selection ▪ There are three modes of selection ▪ Directional selection favors individuals at one extreme end of the phenotypic range ▪ Disruptive selection favors individuals at both extremes of the phenotypic range ▪ Stabilizing selection favors intermediate variants and acts against extreme phenotypes
58.
© 2014 Pearson
Education, Inc. Figure 23.13 (a) Directional selection (b) Disruptive selection (c) Stabilizing selection Original population Original population Evolved population Phenotypes (fur color) Frequency of individuals
59.
© 2014 Pearson
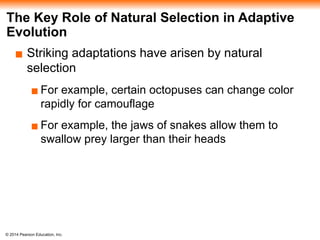
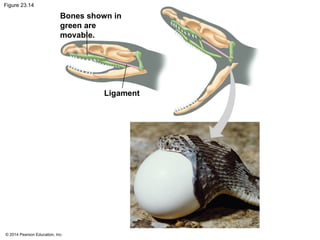
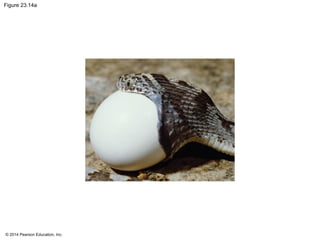
Education, Inc. The Key Role of Natural Selection in Adaptive Evolution ▪ Striking adaptations have arisen by natural selection ▪ For example, certain octopuses can change color rapidly for camouflage ▪ For example, the jaws of snakes allow them to swallow prey larger than their heads
60.
© 2014 Pearson
Education, Inc. Figure 23.14 Bones shown in green are movable. Ligament
61.
© 2014 Pearson
Education, Inc. Figure 23.14a
62.
© 2014 Pearson
Education, Inc. ▪ Natural selection increases the frequencies of alleles that enhance survival and reproduction ▪ Adaptive evolution occurs as the match between a species and its environment increases ▪ Because the environment can change, adaptive evolution is a continuous process
63.
© 2014 Pearson
Education, Inc. ▪ Genetic drift and gene flow do not consistently lead to adaptive evolution as they can increase or decrease the match between an organism and its environment
64.
© 2014 Pearson
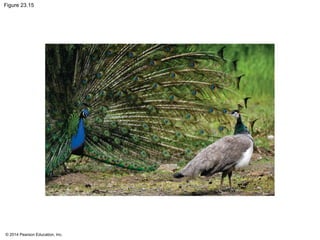
Education, Inc. Sexual Selection ▪ Sexual selection is natural selection for mating success ▪ It can result in sexual dimorphism, marked differences between the sexes in secondary sexual characteristics
65.
© 2014 Pearson
Education, Inc. Figure 23.15
66.
© 2014 Pearson
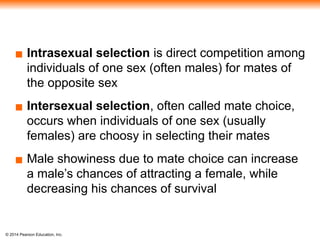
Education, Inc. ▪ Intrasexual selection is direct competition among individuals of one sex (often males) for mates of the opposite sex ▪ Intersexual selection, often called mate choice, occurs when individuals of one sex (usually females) are choosy in selecting their mates ▪ Male showiness due to mate choice can increase a male’s chances of attracting a female, while decreasing his chances of survival
67.
© 2014 Pearson
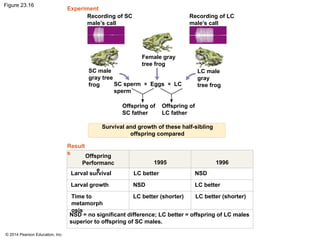
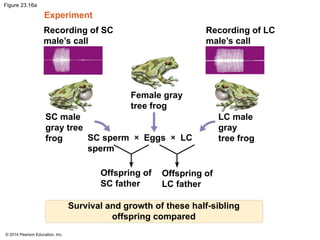
Education, Inc. ▪ How do female preferences evolve? ▪ The “good genes” hypothesis suggests that if a trait is related to male genetic quality or health, both the male trait and female preference for that trait should increase in frequency
68.
© 2014 Pearson
Education, Inc. Figure 23.16 Recording of SC male’s call Recording of LC male’s call Female gray tree frog SC male gray tree frog LC male gray tree frog SC sperm × Eggs × LC sperm Offspring of SC father Offspring of LC father Survival and growth of these half-sibling offspring compared Experiment Result s Offspring Performanc e 1995 1996 Larval survival Larval growth Time to metamorph osis LC better NSD LC better (shorter) NSD LC better LC better (shorter) NSD = no significant difference; LC better = offspring of LC males superior to offspring of SC males.
69.
© 2014 Pearson
Education, Inc. Figure 23.16a Recording of SC male’s call Recording of LC male’s call Female gray tree frog SC male gray tree frog LC male gray tree frog SC sperm × Eggs × LC sperm Offspring of SC father Offspring of LC father Survival and growth of these half-sibling offspring compared Experiment
70.
© 2014 Pearson
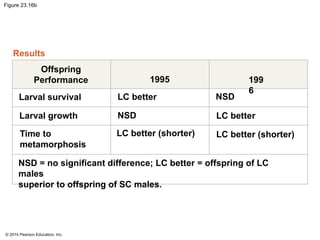
Education, Inc. Figure 23.16b Results Offspring Performance 1995 199 6 Larval survival Larval growth Time to metamorphosis LC better NSD LC better (shorter) NSD LC better LC better (shorter) NSD = no significant difference; LC better = offspring of LC males superior to offspring of SC males.
71.
© 2014 Pearson
Education, Inc. Balancing Selection ▪ Diploidy maintains genetic variation in the form of recessive alleles hidden from selection in heterozygotes ▪ Balancing selection occurs when natural selection maintains stable frequencies of two or more phenotypic forms in a population ▪ Balancing selection includes ▪ Heterozygote advantage ▪ Frequency-dependent selection
72.
© 2014 Pearson
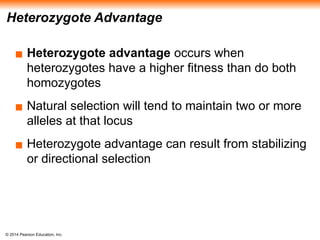
Education, Inc. Heterozygote Advantage ▪ Heterozygote advantage occurs when heterozygotes have a higher fitness than do both homozygotes ▪ Natural selection will tend to maintain two or more alleles at that locus ▪ Heterozygote advantage can result from stabilizing or directional selection
73.
© 2014 Pearson
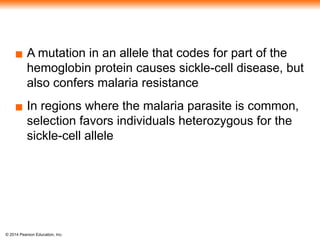
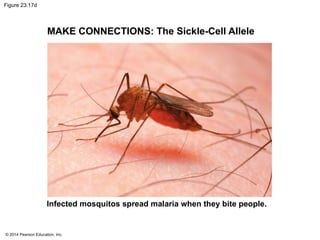
Education, Inc. ▪ A mutation in an allele that codes for part of the hemoglobin protein causes sickle-cell disease, but also confers malaria resistance ▪ In regions where the malaria parasite is common, selection favors individuals heterozygous for the sickle-cell allele
74.
© 2014 Pearson
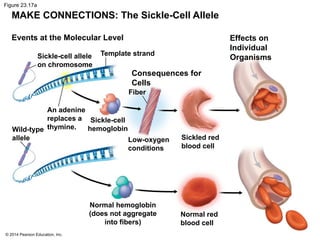
Education, Inc. Figure 23.17a MAKE CONNECTIONS: The Sickle-Cell Allele Events at the Molecular Level Sickle-cell allele on chromosome Template strand Effects on Individual Organisms Consequences for Cells Fiber An adenine replaces a thymine. Wild-type allele Sickle-cell hemoglobin Low-oxygen conditions Sickled red blood cell Normal red blood cell Normal hemoglobin (does not aggregate into fibers)
75.
© 2014 Pearson
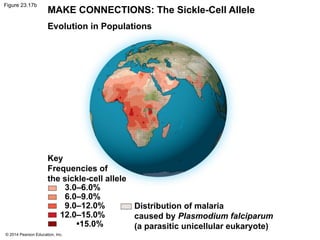
Education, Inc. Figure 23.17b MAKE CONNECTIONS: The Sickle-Cell Allele Evolution in Populations Key Frequencies of the sickle-cell allele Distribution of malaria caused by Plasmodium falciparum (a parasitic unicellular eukaryote) 3.0–6.0% 6.0–9.0% 9.0–12.0% 12.0–15.0% •15.0%
76.
© 2014 Pearson
Education, Inc. Figure 23.17c MAKE CONNECTIONS: The Sickle-Cell Allele
77.
© 2014 Pearson
Education, Inc. Figure 23.17d MAKE CONNECTIONS: The Sickle-Cell Allele Infected mosquitos spread malaria when they bite people.
78.
© 2014 Pearson
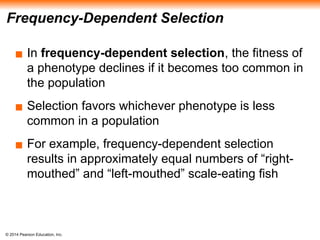
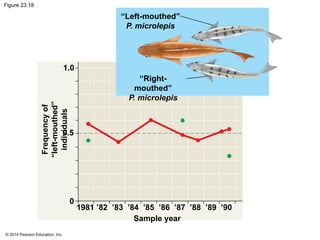
Education, Inc. Frequency-Dependent Selection ▪ In frequency-dependent selection, the fitness of a phenotype declines if it becomes too common in the population ▪ Selection favors whichever phenotype is less common in a population ▪ For example, frequency-dependent selection results in approximately equal numbers of “right- mouthed” and “left-mouthed” scale-eating fish
79.
© 2014 Pearson
Education, Inc. Figure 23.18 “Left-mouthed” P. microlepis “Right- mouthed” P. microlepis Frequency of “left-mouthed” individuals Sample year 1.0 0.5 0 1981 ’82 ’83 ’84 ’85 ’86 ’87 ’88 ’89 ’90
80.
© 2014 Pearson
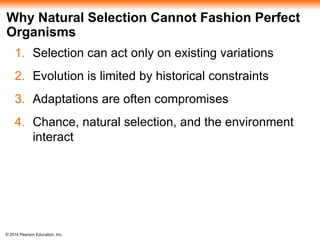
Education, Inc. Why Natural Selection Cannot Fashion Perfect Organisms 1. Selection can act only on existing variations 2. Evolution is limited by historical constraints 3. Adaptations are often compromises 4. Chance, natural selection, and the environment interact
81.
© 2014 Pearson
Education, Inc. Figure 23.UN02
82.
© 2014 Pearson
Education, Inc. Figure 23.UN03a
Editor's Notes
#1
Figure 23.1 Is this finch evolving?
#5
Figure 23.4 Extensive genetic variation at the molecular level
#11
Figure 23.UN01 In-text figure, incomplete dominance, p 484
#19
Figure 23.8 The Hardy-Weinberg principle
#20
Figure 23.8b The Hardy-Weinberg principle (part 2: equations)
#28
0.47
#33
Figure 23.9-1 Genetic drift (step 1)
#34
Figure 23.9-2 Genetic drift (step 2)
#35
Figure 23.9-3 Genetic drift (step 3)
#38
Figure 23.10-1 The bottleneck effect (step 1)
#39
Figure 23.10-2 The bottleneck effect (step 2)
#40
Figure 23.10-3 The bottleneck effect (step 3)
#43
Figure 23.11 Genetic drift and loss of genetic variation
#48
Figure 23.12 Gene flow and local adaptation
#49
Figure 23.12a Gene flow and local adaptation (part 1: graph)
#50
Figure 23.12b Gene flow and local adaptation (part 2: photo)
#58
Figure 23.13 Modes of selection
#60
Figure 23.14 Movable jaw bones in snakes
#61
Figure 23.14a Movable jaw bones in snakes (part 1: photo)
#65
Figure 23.15 Sexual dimorphism and sexual selection
#68
Figure 23.16 Inquiry: Do females select mates based on traits indicative of “good genes”?
#69
Figure 23.16a Inquiry: Do females select mates based on traits indicative of “good genes”? (part 1: experiment)
#70
Figure 23.16b Inquiry: Do females select mates based on traits indicative of “good genes”? (part 2: results)
#74
Figure 23.17a Make connections: the sickle-cell allele (part 1: molecular events and consequences)
#75
Figure 23.17b Make connections: the sickle-cell allele (part 2: evolution in populations)
#76
Figure 23.17c Make connections: the sickle-cell allele (part 3: child with sickle-cell disease)
#77
Figure 23.17d Make connections: the sickle-cell allele (part 4: mosquito)
#79
Figure 23.18 Frequency-dependent selection
#81
Figure 23.UN02 In-text figure, Hardy-Weinberg equation, p. 486
#82
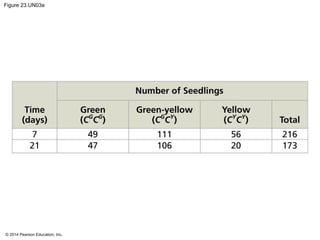
Figure 23.UN03a Skills exercise: using the Hardy-Weinberg equation to interpret data and make predictions (part 1)
Download