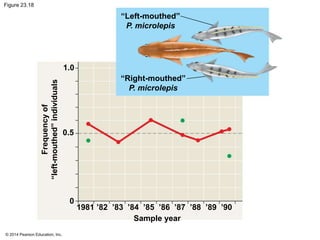
CAMPBELL 
BIOLOGY 
Reece • Urry • Cain •Wasserman • Minorsky • Jackson 
© 2014 Pearson Education, Inc. 
TENTH 
EDITION 
23 
The Evolution 
of Populations 
Lecture Presentation by 
Nicole Tunbridge and 
Kathleen Fitzpatrick
The Smallest Unit of Evolution 
 A common misconception is that organisms evolve 
during their lifetimes 
 Natural selection acts on individuals, but only 
populations evolve 
 Consider, for example, a population of medium 
ground finches on Daphne Major Island 
 During a drought, large-beaked birds were more 
likely to crack large seeds and survive 
 The finch population evolved by natural selection 
© 2014 Pearson Education, Inc.
Figure 23.1 
© 2014 Pearson Education, Inc.
Figure 23.1a 
© 2014 Pearson Education, Inc.
Figure 23.2 
© 2014 Pearson Education, Inc. 
10 
9 
8 
1976 
(similar to the 
prior 3 years) 
1978 
(after 
drought) 
0 
Average beak depth (mm)
 Microevolution is a change in allele frequencies 
in a population over generations 
 Three mechanisms cause allele frequency change 
 Natural selection 
 Genetic drift 
 Gene flow 
 Only natural selection causes adaptive evolution 
© 2014 Pearson Education, Inc.
Concept 23.1: Genetic variation makes 
evolution possible 
 Variation in heritable traits is a prerequisite for 
evolution 
 Mendel’s work on pea plants provided evidence of 
discrete heritable units (genes) 
© 2014 Pearson Education, Inc.
Genetic Variation 
 Genetic variation among individuals is caused by 
differences in genes or other DNA segments 
 Phenotype is the product of inherited genotype 
and environmental influences 
 Natural selection can only act on variation with a 
genetic component 
© 2014 Pearson Education, Inc.
 Some phenotypic differences are determined by a 
single gene and can be classified on an either-or 
basis 
 Other phenotypic differences are determined by 
the influence of two or more genes and vary along 
a continuum within a population 
© 2014 Pearson Education, Inc.
Figure 23.3 
© 2014 Pearson Education, Inc.
Animation: Genetic Variation from Sexual 
Recombination 
© 2014 Pearson Education, Inc.
 Genetic variation can be measured as gene 
variability or nucleotide variability 
 For gene variability, average heterozygosity 
measures the average percent of loci that are 
heterozygous in a population 
 Nucleotide variability is measured by comparing 
the DNA sequences of pairs of individuals 
 Nucleotide variation rarely results in phenotypic 
variation 
© 2014 Pearson Education, Inc.
Figure 23.4 
Base-pair 
substitutions Insertion sites 
1 500 1,000 
Exon Intron 
© 2014 Pearson Education, Inc. 
Deletion 
Substitution resulting 
in translation of 
different amino acid 
1,500 2,000 2,500
 Some phenotypic variation does not result from 
genetic differences among individuals, but rather 
from environmental influences 
 Only genetically determined variation can have 
evolutionary consequences 
© 2014 Pearson Education, Inc.
Figure 23.5 
(a) (b) 
© 2014 Pearson Education, Inc.
Figure 23.5a 
© 2014 Pearson Education, Inc. 
(a)
Figure 23.5b 
© 2014 Pearson Education, Inc. 
(b)
Sources of Genetic Variation 
 New genes and alleles can arise by mutation or 
gene duplication 
 Sexual reproduction can result in genetic variation 
by recombining existing alleles 
© 2014 Pearson Education, Inc.
Formation of New Alleles 
 A mutation is a random change in nucleotide 
sequence of DNA 
 Only mutations in cells that produce gametes can 
be passed to offspring 
 A point mutation is a change in one base in a gene 
© 2014 Pearson Education, Inc.
 The effects of point mutations can vary 
 Mutations that result in a change in protein 
production are often harmful 
 Harmful mutations can be hidden from selection in 
recessive alleles 
 Mutations that result in a change in protein 
production can sometimes be beneficial 
© 2014 Pearson Education, Inc.
 The effects of point mutations can vary 
 Point mutations in noncoding regions generally 
result in neutral variation, conferring no selective 
advantage or disadvantage 
 Mutations to genes can be neutral because of 
redundancy in the genetic code 
© 2014 Pearson Education, Inc.
Altering Gene Number or Position 
 Chromosomal mutations that delete, disrupt, or 
rearrange many loci are typically harmful 
 Duplication of small pieces of DNA increases 
genome size and is usually less harmful 
 Duplicated genes can take on new functions by 
further mutation 
 An ancestral odor-detecting gene has been 
duplicated many times: humans have 350 copies 
of the gene, mice have 1,000 
© 2014 Pearson Education, Inc.
Rapid Reproduction 
 Mutation rates are low in animals and plants 
 The average is about one mutation in every 
100,000 genes per generation 
 Mutation rates are often lower in prokaryotes and 
higher in viruses 
 Mutations accumulate quickly in prokaryotes and 
viruses because they have short generation times 
© 2014 Pearson Education, Inc.
Sexual Reproduction 
 Sexual reproduction can shuffle existing alleles 
into new combinations 
 In organisms that reproduce sexually, 
recombination of alleles is more important than 
mutation in producing the genetic differences that 
make adaptation possible 
© 2014 Pearson Education, Inc.
Concept 23.2: The Hardy-Weinberg equation 
can be used to test whether a population is 
evolving 
 The first step in testing whether evolution is 
occurring in a population is to clarify what we 
mean by a population 
© 2014 Pearson Education, Inc.
Gene Pools and Allele Frequencies 
 A population is a localized group of individuals 
capable of interbreeding and producing fertile 
offspring 
 A gene pool consists of all the alleles for all loci in 
a population 
 A locus is fixed if all individuals in a population are 
homozygous for the same allele 
© 2014 Pearson Education, Inc.
Figure 23.6 
Porcupine herd 
© 2014 Pearson Education, Inc. 
Porcupine 
herd range 
Fortymile 
herd range 
Fortymile herd 
ALASKA 
CANADA 
MAP 
AREA
The Hardy-Weinberg Equation 
 The Hardy-Weinberg equation describes the 
genetic makeup we expect for a population that is 
not evolving at a particular locus 
 If the observed genetic makeup of the population 
differs from expectations under Hardy-Weinberg, it 
suggests that the population may be evolving 
© 2014 Pearson Education, Inc.
Hardy-Weinberg Equilibrium 
 In a population where gametes contribute to the 
next generation randomly and Mendelian 
inheritance occurs, allele and genotype 
frequencies remain constant from generation to 
generation 
 Such a population is in Hardy-Weinberg 
equilibrium 
 Hardy-Weinberg equilibrium describes the 
constant frequency of alleles in such a gene pool 
© 2014 Pearson Education, Inc.
Conditions for Hardy-Weinberg Equilibrium 
 The Hardy-Weinberg theorem describes a 
hypothetical population that is not evolving 
 In real populations, allele and genotype 
frequencies do change over time 
© 2014 Pearson Education, Inc.
 The five conditions for nonevolving populations 
are rarely met in nature 
1. No mutations 
2. Random mating 
3. No natural selection 
4. Extremely large population size 
5. No gene flow 
© 2014 Pearson Education, Inc.
 Natural populations can evolve at some loci, while 
being in Hardy-Weinberg equilibrium at other loci 
© 2014 Pearson Education, Inc.
Natural Selection 
 Differential success in reproduction results in 
certain alleles being passed to the next generation 
in greater proportions 
 For example, an allele that confers resistance to 
DDT in fruit flies increased in frequency after DDT 
was used widely in agriculture 
© 2014 Pearson Education, Inc.
 Natural selection can cause adaptive evolution, 
an improvement in the match between organisms 
and their environment 
© 2014 Pearson Education, Inc.
Genetic Drift 
 The smaller a sample, the greater the chance of 
random deviation from a predicted result 
 Genetic drift describes how allele frequencies 
fluctuate unpredictably from one generation to the 
next 
 Genetic drift tends to reduce genetic variation 
through losses of alleles 
© 2014 Pearson Education, Inc.
BioFlix: Mechanisms of Evolution 
© 2014 Pearson Education, Inc.
The Founder Effect 
 The founder effect occurs when a few individuals 
become isolated from a larger population 
 Allele frequencies in the small founder population 
can be different from those in the larger parent 
population 
© 2014 Pearson Education, Inc.
The Bottleneck Effect 
 The bottleneck effect is a sudden reduction in 
population size due to a change in the 
environment 
 The resulting gene pool may no longer be 
reflective of the original population’s gene pool 
 If the population remains small, it may be further 
affected by genetic drift 
© 2014 Pearson Education, Inc.
Figure 23.10–1 
Original 
population 
© 2014 Pearson Education, Inc.
Figure 23.10–2 
Original 
population 
© 2014 Pearson Education, Inc. 
Bottlenecking 
event
Figure 23.10–3 
Original 
population 
© 2014 Pearson Education, Inc. 
Bottlenecking 
event 
Surviving 
population
 Understanding the bottleneck effect can increase 
understanding of how human activity affects other 
species 
© 2014 Pearson Education, Inc.
Case Study: Impact of Genetic Drift on the 
Greater Prairie Chicken 
 Loss of prairie habitat caused a severe reduction 
in the population of greater prairie chickens in 
Illinois 
 The surviving birds had low levels of genetic 
variation, and only 50% of their eggs hatched 
© 2014 Pearson Education, Inc.
Figure 23.11 
Greater prairie 
chicken 
© 2014 Pearson Education, Inc. 
Pre-bottleneck 
(Illinois, 1820) 
Range 
of greater 
prairie 
chicken 
Post-bottleneck 
(Illinois, 1993) 
(a) 
Location Population 
size 
Number 
of alleles 
per locus 
Percentage 
of eggs 
hatched 
Illinois 
1930–1960s 
1993 
Kansas, 1998 
(no bottleneck) 
Nebraska, 1998 
(no bottleneck) 
1,000–25,000 
<50 
750,000 
75,000– 
200,000 
5.2 
3.7 
93 
<50 
5.8 
5.8 
99 
96 
(b)
Figure 23.11a 
Greater prairie 
chicken 
© 2014 Pearson Education, Inc. 
Pre-bottleneck 
(Illinois, 1820) 
Range 
of greater 
prairie 
chicken 
Post-bottleneck 
(Illinois, 1993) 
(a)
Figure 23.11b 
Location Population 
© 2014 Pearson Education, Inc. 
size 
Number 
of alleles 
per locus 
Percentage 
of eggs 
hatched 
Illinois 
1930–1960s 
1993 
Kansas, 1998 
(no bottleneck) 
Nebraska, 1998 
(no bottleneck) 
1,000–25,000 
<50 
750,000 
75,000– 
200,000 
5.2 
3.7 
93 
<50 
5.8 99 
5.8 
96 
(b)
 Researchers used DNA from museum specimens 
to compare genetic variation in the population 
before and after the bottleneck 
 The results showed a loss of alleles at several loci 
 Researchers introduced greater prairie chickens 
from populations in other states and were 
successful in introducing new alleles and 
increasing the egg hatch rate to 90% 
© 2014 Pearson Education, Inc.
Effects of Genetic Drift: A Summary 
1. Genetic drift is significant in small populations 
2. Genetic drift can cause allele frequencies to 
change at random 
3. Genetic drift can lead to a loss of genetic 
variation within populations 
4. Genetic drift can cause harmful alleles to become 
fixed 
© 2014 Pearson Education, Inc.
Gene Flow 
 Gene flow consists of the movement of alleles 
among populations 
 Alleles can be transferred through the movement 
of fertile individuals or gametes (for example, 
pollen) 
 Gene flow tends to reduce variation among 
populations over time 
© 2014 Pearson Education, Inc.
 Gene flow can decrease the fitness of a population 
 Consider, for example, the great tit (Parus major) on 
the Dutch island of Vlieland 
 Mating causes gene flow between the central and 
eastern populations 
 Immigration from the mainland introduces alleles that 
decrease fitness on the island 
 Natural selection removes alleles that decrease fitness 
 Birds born in the central region with high immigration 
have a lower fitness; birds born in the east with low 
immigration have a higher fitness 
© 2014 Pearson Education, Inc.
Figure 23.12 
© 2014 Pearson Education, Inc. 
Parus major 
Central 
population 
NORTH SEA Eastern 
Vlieland, population 
N the Netherlands 
2 km 
Population in which 
the surviving females 
eventually bred 
Central 
Eastern 
Survival rate (%) 
Females born in 
central population 
50 
40 
30 
20 
10 
0 
Females born in 
eastern population
Figure 23.12a 
© 2014 Pearson Education, Inc. 
Population in which 
the surviving females 
eventually bred 
Central 
Eastern 
Survival rate (%) 
Females born in 
central population 
50 
40 
30 
20 
10 
0 
Females born in 
eastern population
Figure 23.12b 
© 2014 Pearson Education, Inc. 
Parus major
 Gene flow can increase the fitness of a population 
 Consider, for example, the spread of alleles for 
resistance to insecticides 
 Insecticides have been used to target mosquitoes 
that carry West Nile virus and malaria 
 Alleles have evolved in some populations that 
confer insecticide resistance to these mosquitoes 
 The flow of insecticide resistance alleles into a 
population can cause an increase in fitness 
© 2014 Pearson Education, Inc.
 Gene flow is an important agent of evolutionary 
change in modern human populations 
© 2014 Pearson Education, Inc.
Concept 23.4: Natural selection is the only 
mechanism that consistently causes adaptive 
evolution 
 Evolution by natural selection involves both 
chance and “sorting” 
 New genetic variations arise by chance 
 Beneficial alleles are “sorted” and favored by 
natural selection 
 Only natural selection consistently increases the 
frequencies of alleles that provide reproductive 
advantage 
© 2014 Pearson Education, Inc.
Natural Selection: A Closer Look 
 Natural selection brings about adaptive evolution 
by acting on an organism’s phenotype 
© 2014 Pearson Education, Inc.
Relative Fitness 
 The phrases “struggle for existence” and “survival 
of the fittest” are misleading as they imply direct 
competition among individuals 
 Reproductive success is generally more subtle 
and depends on many factors 
© 2014 Pearson Education, Inc.
 Relative fitness is the contribution an individual 
makes to the gene pool of the next generation, 
relative to the contributions of other individuals 
 Selection favors certain genotypes by acting on 
the phenotypes of individuals 
© 2014 Pearson Education, Inc.
Directional, Disruptive, and Stabilizing Selection 
 There are three modes of selection 
 Directional selection favors individuals at one 
extreme end of the phenotypic range 
 Disruptive selection favors individuals at both 
extremes of the phenotypic range 
 Stabilizing selection favors intermediate variants 
and acts against extreme phenotypes 
© 2014 Pearson Education, Inc.
Figure 23.13 
(a) Directional selection (b) Disruptive selection (c) Stabilizing selection 
© 2014 Pearson Education, Inc. 
Original 
population 
Original 
population 
Evolved 
population 
Phenotypes (fur color) 
Frequency of 
individuals
The Key Role of Natural Selection in Adaptive 
Evolution 
 Striking adaptations have arisen by natural 
selection 
 For example, certain octopuses can change color 
rapidly for camouflage 
 For example, the jaws of snakes allow them to 
swallow prey larger than their heads 
© 2014 Pearson Education, Inc.
Figure 23.14 
Bones shown in 
green are movable. 
© 2014 Pearson Education, Inc. 
Ligament
Figure 23.14a 
© 2014 Pearson Education, Inc.
 Natural selection increases the frequencies of 
alleles that enhance survival and reproduction 
 Adaptive evolution occurs as the match between a 
species and its environment increases 
 Because the environment can change, adaptive 
evolution is a continuous process 
© 2014 Pearson Education, Inc.
 Genetic drift and gene flow do not consistently 
lead to adaptive evolution as they can increase or 
decrease the match between an organism and its 
environment 
© 2014 Pearson Education, Inc.
Sexual Selection 
 Sexual selection is natural selection for mating 
success 
 It can result in sexual dimorphism, marked 
differences between the sexes in secondary 
sexual characteristics 
© 2014 Pearson Education, Inc.
Figure 23.15 
© 2014 Pearson Education, Inc.
 Intrasexual selection is direct competition among 
individuals of one sex (often males) for mates of 
the opposite sex 
 Intersexual selection, often called mate choice, 
occurs when individuals of one sex (usually 
females) are choosy in selecting their mates 
 Male showiness due to mate choice can increase 
a male’s chances of attracting a female, while 
decreasing his chances of survival 
© 2014 Pearson Education, Inc.
 How do female preferences evolve? 
 The “good genes” hypothesis suggests that if a 
trait is related to male genetic quality or health, 
both the male trait and female preference for that 
trait should increase in frequency 
© 2014 Pearson Education, Inc.
Balancing Selection 
 Diploidy maintains genetic variation in the form of 
recessive alleles hidden from selection in 
heterozygotes 
 Balancing selection occurs when natural 
selection maintains stable frequencies of two or 
more phenotypic forms in a population 
 Balancing selection includes 
 Heterozygote advantage 
 Frequency-dependent selection 
© 2014 Pearson Education, Inc.
Heterozygote Advantage 
 Heterozygote advantage occurs when 
heterozygotes have a higher fitness than do both 
homozygotes 
 Natural selection will tend to maintain two or more 
alleles at that locus 
 Heterozygote advantage can result from stabilizing 
or directional selection 
© 2014 Pearson Education, Inc.
 A mutation in an allele that codes for part of the 
hemoglobin protein causes sickle-cell disease, but 
also confers malaria resistance 
 In regions where the malaria parasite is common, 
selection favors individuals heterozygous for the 
sickle-cell allele 
© 2014 Pearson Education, Inc.
Figure 23.17a 
MAKE CONNECTIONS: The Sickle-Cell Allele 
Events at the Molecular Level 
Sickle-cell allele 
on chromosome 
© 2014 Pearson Education, Inc. 
Template strand 
Effects on Individual 
Organisms 
Consequences for Cells 
Fiber 
An adenine 
replaces a 
Wild-type thymine. 
allele 
Sickle-cell 
hemoglobin 
Low-oxygen 
conditions 
Sickled red 
blood cell 
Normal red 
blood cell 
Normal hemoglobin 
(does not aggregate 
into fibers)
Figure 23.17b 
MAKE CONNECTIONS: The Sickle-Cell Allele 
Evolution in Populations 
Key 
Frequencies of 
the sickle-cell allele 
© 2014 Pearson Education, Inc. 
Distribution of malaria 
caused by Plasmodium falciparum 
(a parasitic unicellular eukaryote) 
3.0–6.0% 
6.0–9.0% 
9.0–12.0% 
12.0–15.0% 
>15.0%
Figure 23.17c 
MAKE CONNECTIONS: The Sickle-Cell Allele 
© 2014 Pearson Education, Inc.
Figure 23.17d 
MAKE CONNECTIONS: The Sickle-Cell Allele 
Infected mosquitos spread malaria when they bite people. 
© 2014 Pearson Education, Inc.
Frequency-Dependent Selection 
 In frequency-dependent selection, the fitness of 
a phenotype declines if it becomes too common in 
the population 
 Selection favors whichever phenotype is less 
common in a population 
 For example, frequency-dependent selection 
results in approximately equal numbers of “right-mouthed” 
© 2014 Pearson Education, Inc. 
and “left-mouthed” scale-eating fish
Figure 23.18 
© 2014 Pearson Education, Inc. 
“Left-mouthed” 
P. microlepis 
“Right-mouthed” 
P. microlepis 
Frequency of 
“left-mouthed” individuals 
Sample year 
1.0 
0.5 
0 
1981 ’82 ’83 ’84 ’85 ’86 ’87 ’88 ’89 ’90
Why Natural Selection Cannot Fashion Perfect 
Organisms 
1. Selection can act only on existing variations 
2. Evolution is limited by historical constraints 
3. Adaptations are often compromises 
4. Chance, natural selection, and the environment 
interact 
© 2014 Pearson Education, Inc.

23 lecture BIOL 1010-30 Gillette College

  • 1.
    CAMPBELL BIOLOGY Reece• Urry • Cain •Wasserman • Minorsky • Jackson © 2014 Pearson Education, Inc. TENTH EDITION 23 The Evolution of Populations Lecture Presentation by Nicole Tunbridge and Kathleen Fitzpatrick
  • 2.
    The Smallest Unitof Evolution  A common misconception is that organisms evolve during their lifetimes  Natural selection acts on individuals, but only populations evolve  Consider, for example, a population of medium ground finches on Daphne Major Island  During a drought, large-beaked birds were more likely to crack large seeds and survive  The finch population evolved by natural selection © 2014 Pearson Education, Inc.
  • 3.
    Figure 23.1 ©2014 Pearson Education, Inc.
  • 4.
    Figure 23.1a ©2014 Pearson Education, Inc.
  • 5.
    Figure 23.2 ©2014 Pearson Education, Inc. 10 9 8 1976 (similar to the prior 3 years) 1978 (after drought) 0 Average beak depth (mm)
  • 6.
     Microevolution isa change in allele frequencies in a population over generations  Three mechanisms cause allele frequency change  Natural selection  Genetic drift  Gene flow  Only natural selection causes adaptive evolution © 2014 Pearson Education, Inc.
  • 7.
    Concept 23.1: Geneticvariation makes evolution possible  Variation in heritable traits is a prerequisite for evolution  Mendel’s work on pea plants provided evidence of discrete heritable units (genes) © 2014 Pearson Education, Inc.
  • 8.
    Genetic Variation Genetic variation among individuals is caused by differences in genes or other DNA segments  Phenotype is the product of inherited genotype and environmental influences  Natural selection can only act on variation with a genetic component © 2014 Pearson Education, Inc.
  • 9.
     Some phenotypicdifferences are determined by a single gene and can be classified on an either-or basis  Other phenotypic differences are determined by the influence of two or more genes and vary along a continuum within a population © 2014 Pearson Education, Inc.
  • 10.
    Figure 23.3 ©2014 Pearson Education, Inc.
  • 11.
    Animation: Genetic Variationfrom Sexual Recombination © 2014 Pearson Education, Inc.
  • 12.
     Genetic variationcan be measured as gene variability or nucleotide variability  For gene variability, average heterozygosity measures the average percent of loci that are heterozygous in a population  Nucleotide variability is measured by comparing the DNA sequences of pairs of individuals  Nucleotide variation rarely results in phenotypic variation © 2014 Pearson Education, Inc.
  • 13.
    Figure 23.4 Base-pair substitutions Insertion sites 1 500 1,000 Exon Intron © 2014 Pearson Education, Inc. Deletion Substitution resulting in translation of different amino acid 1,500 2,000 2,500
  • 14.
     Some phenotypicvariation does not result from genetic differences among individuals, but rather from environmental influences  Only genetically determined variation can have evolutionary consequences © 2014 Pearson Education, Inc.
  • 15.
    Figure 23.5 (a)(b) © 2014 Pearson Education, Inc.
  • 16.
    Figure 23.5a ©2014 Pearson Education, Inc. (a)
  • 17.
    Figure 23.5b ©2014 Pearson Education, Inc. (b)
  • 18.
    Sources of GeneticVariation  New genes and alleles can arise by mutation or gene duplication  Sexual reproduction can result in genetic variation by recombining existing alleles © 2014 Pearson Education, Inc.
  • 19.
    Formation of NewAlleles  A mutation is a random change in nucleotide sequence of DNA  Only mutations in cells that produce gametes can be passed to offspring  A point mutation is a change in one base in a gene © 2014 Pearson Education, Inc.
  • 20.
     The effectsof point mutations can vary  Mutations that result in a change in protein production are often harmful  Harmful mutations can be hidden from selection in recessive alleles  Mutations that result in a change in protein production can sometimes be beneficial © 2014 Pearson Education, Inc.
  • 21.
     The effectsof point mutations can vary  Point mutations in noncoding regions generally result in neutral variation, conferring no selective advantage or disadvantage  Mutations to genes can be neutral because of redundancy in the genetic code © 2014 Pearson Education, Inc.
  • 22.
    Altering Gene Numberor Position  Chromosomal mutations that delete, disrupt, or rearrange many loci are typically harmful  Duplication of small pieces of DNA increases genome size and is usually less harmful  Duplicated genes can take on new functions by further mutation  An ancestral odor-detecting gene has been duplicated many times: humans have 350 copies of the gene, mice have 1,000 © 2014 Pearson Education, Inc.
  • 23.
    Rapid Reproduction Mutation rates are low in animals and plants  The average is about one mutation in every 100,000 genes per generation  Mutation rates are often lower in prokaryotes and higher in viruses  Mutations accumulate quickly in prokaryotes and viruses because they have short generation times © 2014 Pearson Education, Inc.
  • 24.
    Sexual Reproduction Sexual reproduction can shuffle existing alleles into new combinations  In organisms that reproduce sexually, recombination of alleles is more important than mutation in producing the genetic differences that make adaptation possible © 2014 Pearson Education, Inc.
  • 25.
    Concept 23.2: TheHardy-Weinberg equation can be used to test whether a population is evolving  The first step in testing whether evolution is occurring in a population is to clarify what we mean by a population © 2014 Pearson Education, Inc.
  • 26.
    Gene Pools andAllele Frequencies  A population is a localized group of individuals capable of interbreeding and producing fertile offspring  A gene pool consists of all the alleles for all loci in a population  A locus is fixed if all individuals in a population are homozygous for the same allele © 2014 Pearson Education, Inc.
  • 27.
    Figure 23.6 Porcupineherd © 2014 Pearson Education, Inc. Porcupine herd range Fortymile herd range Fortymile herd ALASKA CANADA MAP AREA
  • 28.
    The Hardy-Weinberg Equation  The Hardy-Weinberg equation describes the genetic makeup we expect for a population that is not evolving at a particular locus  If the observed genetic makeup of the population differs from expectations under Hardy-Weinberg, it suggests that the population may be evolving © 2014 Pearson Education, Inc.
  • 29.
    Hardy-Weinberg Equilibrium In a population where gametes contribute to the next generation randomly and Mendelian inheritance occurs, allele and genotype frequencies remain constant from generation to generation  Such a population is in Hardy-Weinberg equilibrium  Hardy-Weinberg equilibrium describes the constant frequency of alleles in such a gene pool © 2014 Pearson Education, Inc.
  • 30.
    Conditions for Hardy-WeinbergEquilibrium  The Hardy-Weinberg theorem describes a hypothetical population that is not evolving  In real populations, allele and genotype frequencies do change over time © 2014 Pearson Education, Inc.
  • 31.
     The fiveconditions for nonevolving populations are rarely met in nature 1. No mutations 2. Random mating 3. No natural selection 4. Extremely large population size 5. No gene flow © 2014 Pearson Education, Inc.
  • 32.
     Natural populationscan evolve at some loci, while being in Hardy-Weinberg equilibrium at other loci © 2014 Pearson Education, Inc.
  • 33.
    Natural Selection Differential success in reproduction results in certain alleles being passed to the next generation in greater proportions  For example, an allele that confers resistance to DDT in fruit flies increased in frequency after DDT was used widely in agriculture © 2014 Pearson Education, Inc.
  • 34.
     Natural selectioncan cause adaptive evolution, an improvement in the match between organisms and their environment © 2014 Pearson Education, Inc.
  • 35.
    Genetic Drift The smaller a sample, the greater the chance of random deviation from a predicted result  Genetic drift describes how allele frequencies fluctuate unpredictably from one generation to the next  Genetic drift tends to reduce genetic variation through losses of alleles © 2014 Pearson Education, Inc.
  • 36.
    BioFlix: Mechanisms ofEvolution © 2014 Pearson Education, Inc.
  • 37.
    The Founder Effect  The founder effect occurs when a few individuals become isolated from a larger population  Allele frequencies in the small founder population can be different from those in the larger parent population © 2014 Pearson Education, Inc.
  • 38.
    The Bottleneck Effect  The bottleneck effect is a sudden reduction in population size due to a change in the environment  The resulting gene pool may no longer be reflective of the original population’s gene pool  If the population remains small, it may be further affected by genetic drift © 2014 Pearson Education, Inc.
  • 39.
    Figure 23.10–1 Original population © 2014 Pearson Education, Inc.
  • 40.
    Figure 23.10–2 Original population © 2014 Pearson Education, Inc. Bottlenecking event
  • 41.
    Figure 23.10–3 Original population © 2014 Pearson Education, Inc. Bottlenecking event Surviving population
  • 42.
     Understanding thebottleneck effect can increase understanding of how human activity affects other species © 2014 Pearson Education, Inc.
  • 43.
    Case Study: Impactof Genetic Drift on the Greater Prairie Chicken  Loss of prairie habitat caused a severe reduction in the population of greater prairie chickens in Illinois  The surviving birds had low levels of genetic variation, and only 50% of their eggs hatched © 2014 Pearson Education, Inc.
  • 44.
    Figure 23.11 Greaterprairie chicken © 2014 Pearson Education, Inc. Pre-bottleneck (Illinois, 1820) Range of greater prairie chicken Post-bottleneck (Illinois, 1993) (a) Location Population size Number of alleles per locus Percentage of eggs hatched Illinois 1930–1960s 1993 Kansas, 1998 (no bottleneck) Nebraska, 1998 (no bottleneck) 1,000–25,000 <50 750,000 75,000– 200,000 5.2 3.7 93 <50 5.8 5.8 99 96 (b)
  • 45.
    Figure 23.11a Greaterprairie chicken © 2014 Pearson Education, Inc. Pre-bottleneck (Illinois, 1820) Range of greater prairie chicken Post-bottleneck (Illinois, 1993) (a)
  • 46.
    Figure 23.11b LocationPopulation © 2014 Pearson Education, Inc. size Number of alleles per locus Percentage of eggs hatched Illinois 1930–1960s 1993 Kansas, 1998 (no bottleneck) Nebraska, 1998 (no bottleneck) 1,000–25,000 <50 750,000 75,000– 200,000 5.2 3.7 93 <50 5.8 99 5.8 96 (b)
  • 47.
     Researchers usedDNA from museum specimens to compare genetic variation in the population before and after the bottleneck  The results showed a loss of alleles at several loci  Researchers introduced greater prairie chickens from populations in other states and were successful in introducing new alleles and increasing the egg hatch rate to 90% © 2014 Pearson Education, Inc.
  • 48.
    Effects of GeneticDrift: A Summary 1. Genetic drift is significant in small populations 2. Genetic drift can cause allele frequencies to change at random 3. Genetic drift can lead to a loss of genetic variation within populations 4. Genetic drift can cause harmful alleles to become fixed © 2014 Pearson Education, Inc.
  • 49.
    Gene Flow Gene flow consists of the movement of alleles among populations  Alleles can be transferred through the movement of fertile individuals or gametes (for example, pollen)  Gene flow tends to reduce variation among populations over time © 2014 Pearson Education, Inc.
  • 50.
     Gene flowcan decrease the fitness of a population  Consider, for example, the great tit (Parus major) on the Dutch island of Vlieland  Mating causes gene flow between the central and eastern populations  Immigration from the mainland introduces alleles that decrease fitness on the island  Natural selection removes alleles that decrease fitness  Birds born in the central region with high immigration have a lower fitness; birds born in the east with low immigration have a higher fitness © 2014 Pearson Education, Inc.
  • 51.
    Figure 23.12 ©2014 Pearson Education, Inc. Parus major Central population NORTH SEA Eastern Vlieland, population N the Netherlands 2 km Population in which the surviving females eventually bred Central Eastern Survival rate (%) Females born in central population 50 40 30 20 10 0 Females born in eastern population
  • 52.
    Figure 23.12a ©2014 Pearson Education, Inc. Population in which the surviving females eventually bred Central Eastern Survival rate (%) Females born in central population 50 40 30 20 10 0 Females born in eastern population
  • 53.
    Figure 23.12b ©2014 Pearson Education, Inc. Parus major
  • 54.
     Gene flowcan increase the fitness of a population  Consider, for example, the spread of alleles for resistance to insecticides  Insecticides have been used to target mosquitoes that carry West Nile virus and malaria  Alleles have evolved in some populations that confer insecticide resistance to these mosquitoes  The flow of insecticide resistance alleles into a population can cause an increase in fitness © 2014 Pearson Education, Inc.
  • 55.
     Gene flowis an important agent of evolutionary change in modern human populations © 2014 Pearson Education, Inc.
  • 56.
    Concept 23.4: Naturalselection is the only mechanism that consistently causes adaptive evolution  Evolution by natural selection involves both chance and “sorting”  New genetic variations arise by chance  Beneficial alleles are “sorted” and favored by natural selection  Only natural selection consistently increases the frequencies of alleles that provide reproductive advantage © 2014 Pearson Education, Inc.
  • 57.
    Natural Selection: ACloser Look  Natural selection brings about adaptive evolution by acting on an organism’s phenotype © 2014 Pearson Education, Inc.
  • 58.
    Relative Fitness The phrases “struggle for existence” and “survival of the fittest” are misleading as they imply direct competition among individuals  Reproductive success is generally more subtle and depends on many factors © 2014 Pearson Education, Inc.
  • 59.
     Relative fitnessis the contribution an individual makes to the gene pool of the next generation, relative to the contributions of other individuals  Selection favors certain genotypes by acting on the phenotypes of individuals © 2014 Pearson Education, Inc.
  • 60.
    Directional, Disruptive, andStabilizing Selection  There are three modes of selection  Directional selection favors individuals at one extreme end of the phenotypic range  Disruptive selection favors individuals at both extremes of the phenotypic range  Stabilizing selection favors intermediate variants and acts against extreme phenotypes © 2014 Pearson Education, Inc.
  • 61.
    Figure 23.13 (a)Directional selection (b) Disruptive selection (c) Stabilizing selection © 2014 Pearson Education, Inc. Original population Original population Evolved population Phenotypes (fur color) Frequency of individuals
  • 62.
    The Key Roleof Natural Selection in Adaptive Evolution  Striking adaptations have arisen by natural selection  For example, certain octopuses can change color rapidly for camouflage  For example, the jaws of snakes allow them to swallow prey larger than their heads © 2014 Pearson Education, Inc.
  • 63.
    Figure 23.14 Bonesshown in green are movable. © 2014 Pearson Education, Inc. Ligament
  • 64.
    Figure 23.14a ©2014 Pearson Education, Inc.
  • 65.
     Natural selectionincreases the frequencies of alleles that enhance survival and reproduction  Adaptive evolution occurs as the match between a species and its environment increases  Because the environment can change, adaptive evolution is a continuous process © 2014 Pearson Education, Inc.
  • 66.
     Genetic driftand gene flow do not consistently lead to adaptive evolution as they can increase or decrease the match between an organism and its environment © 2014 Pearson Education, Inc.
  • 67.
    Sexual Selection Sexual selection is natural selection for mating success  It can result in sexual dimorphism, marked differences between the sexes in secondary sexual characteristics © 2014 Pearson Education, Inc.
  • 68.
    Figure 23.15 ©2014 Pearson Education, Inc.
  • 69.
     Intrasexual selectionis direct competition among individuals of one sex (often males) for mates of the opposite sex  Intersexual selection, often called mate choice, occurs when individuals of one sex (usually females) are choosy in selecting their mates  Male showiness due to mate choice can increase a male’s chances of attracting a female, while decreasing his chances of survival © 2014 Pearson Education, Inc.
  • 70.
     How dofemale preferences evolve?  The “good genes” hypothesis suggests that if a trait is related to male genetic quality or health, both the male trait and female preference for that trait should increase in frequency © 2014 Pearson Education, Inc.
  • 71.
    Balancing Selection Diploidy maintains genetic variation in the form of recessive alleles hidden from selection in heterozygotes  Balancing selection occurs when natural selection maintains stable frequencies of two or more phenotypic forms in a population  Balancing selection includes  Heterozygote advantage  Frequency-dependent selection © 2014 Pearson Education, Inc.
  • 72.
    Heterozygote Advantage Heterozygote advantage occurs when heterozygotes have a higher fitness than do both homozygotes  Natural selection will tend to maintain two or more alleles at that locus  Heterozygote advantage can result from stabilizing or directional selection © 2014 Pearson Education, Inc.
  • 73.
     A mutationin an allele that codes for part of the hemoglobin protein causes sickle-cell disease, but also confers malaria resistance  In regions where the malaria parasite is common, selection favors individuals heterozygous for the sickle-cell allele © 2014 Pearson Education, Inc.
  • 74.
    Figure 23.17a MAKECONNECTIONS: The Sickle-Cell Allele Events at the Molecular Level Sickle-cell allele on chromosome © 2014 Pearson Education, Inc. Template strand Effects on Individual Organisms Consequences for Cells Fiber An adenine replaces a Wild-type thymine. allele Sickle-cell hemoglobin Low-oxygen conditions Sickled red blood cell Normal red blood cell Normal hemoglobin (does not aggregate into fibers)
  • 75.
    Figure 23.17b MAKECONNECTIONS: The Sickle-Cell Allele Evolution in Populations Key Frequencies of the sickle-cell allele © 2014 Pearson Education, Inc. Distribution of malaria caused by Plasmodium falciparum (a parasitic unicellular eukaryote) 3.0–6.0% 6.0–9.0% 9.0–12.0% 12.0–15.0% >15.0%
  • 76.
    Figure 23.17c MAKECONNECTIONS: The Sickle-Cell Allele © 2014 Pearson Education, Inc.
  • 77.
    Figure 23.17d MAKECONNECTIONS: The Sickle-Cell Allele Infected mosquitos spread malaria when they bite people. © 2014 Pearson Education, Inc.
  • 78.
    Frequency-Dependent Selection In frequency-dependent selection, the fitness of a phenotype declines if it becomes too common in the population  Selection favors whichever phenotype is less common in a population  For example, frequency-dependent selection results in approximately equal numbers of “right-mouthed” © 2014 Pearson Education, Inc. and “left-mouthed” scale-eating fish
  • 79.
    Figure 23.18 ©2014 Pearson Education, Inc. “Left-mouthed” P. microlepis “Right-mouthed” P. microlepis Frequency of “left-mouthed” individuals Sample year 1.0 0.5 0 1981 ’82 ’83 ’84 ’85 ’86 ’87 ’88 ’89 ’90
  • 80.
    Why Natural SelectionCannot Fashion Perfect Organisms 1. Selection can act only on existing variations 2. Evolution is limited by historical constraints 3. Adaptations are often compromises 4. Chance, natural selection, and the environment interact © 2014 Pearson Education, Inc.