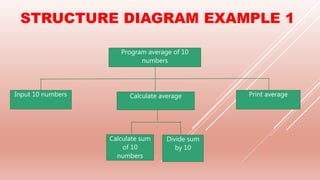
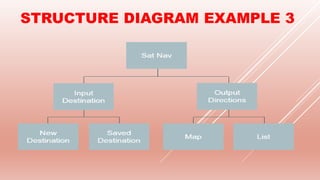
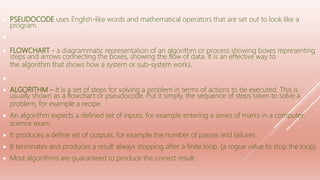
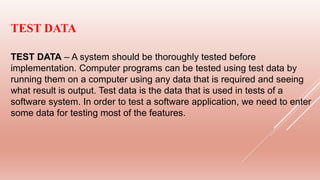
The document covers problem-solving and design principles in computer systems, detailing concepts such as top-down design, modular programming, and the creation of algorithms using flowcharts and pseudocode. It emphasizes the importance of various validation and verification checks on input data, alongside methods like test data and trace tables for error identification and debugging. Additionally, it outlines the stages in producing algorithms, the effectiveness of solutions, and common errors to watch for in algorithm development.


![Study the flowchart very carefully. [JUN 09/P1/14]](https://image.slidesharecdn.com/2-200331055439/85/2-1-1-PROBLEM-SOLVING-DESIGN-26-320.jpg)
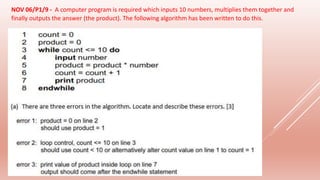
![Study the flowchart. [NOV09/P1/9]](https://image.slidesharecdn.com/2-200331055439/85/2-1-1-PROBLEM-SOLVING-DESIGN-27-320.jpg)
![[NOV 10/P13/11]](https://image.slidesharecdn.com/2-200331055439/85/2-1-1-PROBLEM-SOLVING-DESIGN-28-320.jpg)
![Study the following flowchart very carefully: [JUN 10/P11/5]](https://image.slidesharecdn.com/2-200331055439/85/2-1-1-PROBLEM-SOLVING-DESIGN-29-320.jpg)
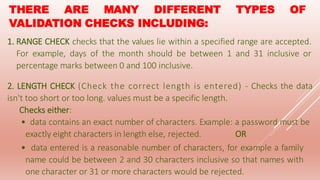
![The following flowchart inputs ten temperatures and outputs the average (mean) temperature and the number of
temperatures which were negative (i.e. < 0). [JUN 11/P12/10]](https://image.slidesharecdn.com/2-200331055439/85/2-1-1-PROBLEM-SOLVING-DESIGN-30-320.jpg)
![Carefully study the following flowchart: [JUN 12/P12/6]](https://image.slidesharecdn.com/2-200331055439/85/2-1-1-PROBLEM-SOLVING-DESIGN-31-320.jpg)
![[NOV 10/P11 & 12/9] - The following algorithm inputs 20 numbers and outputs how many
numbers were positive (> 0) and how many numbers were negative (< 0).](https://image.slidesharecdn.com/2-200331055439/85/2-1-1-PROBLEM-SOLVING-DESIGN-34-320.jpg)


![Algorithm Design and Problem Solving [Autosaved].pptx](https://cdn.slidesharecdn.com/ss_thumbnails/algorithmdesignandproblemsolvingautosaved-230525024624-6a6fb3b2-thumbnail.jpg?width=640&height=640&fit=bounds)