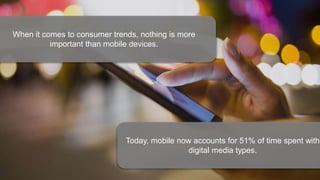
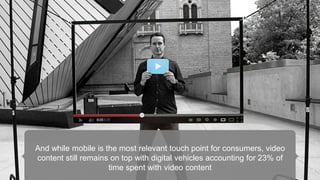
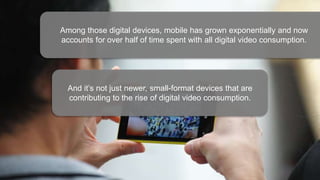
This document summarizes key trends in the 2016 media landscape. It notes that mobile media now accounts for over half of time spent with digital media, with smartphones becoming increasingly important. It also discusses the rise of social media, with users spending over an hour per day on platforms. Major trends highlighted include the growth of mobile and video consumption, the importance of audio streaming via mobile devices, and the increased spending on political advertising and its impact on local media inventory.
Australian Media Consumption Trends 2015 - Created by Ryan Northover - Ninja Digital 2015.
How Are Australians consuming media in 2015? How is the media influencing buying behavior? How can brands get insight into the way we consume and are influenced by media in 2015? A report for brands in Western Australia and Australia.
APAC Mobile First Insights Report - Opera MediaworksOperaMediaworks
The report is designed to help marketers navigate the fast-changing mobile environment and make strategic decisions that will drive real outcomes for the business.
The report found that Asia Pacific is a massive and growing market for app usage and app advertising. Here are the key findings:
- Gaming is the top mobile app category across most APAC countries
- In-app advertising is overtaking the mobile web channel across almost all APAC markets, by as much as 13 times in Singapore and Thailand
- Click-through rates on apps were found to be between 1.3 times to twice as high as mobile web-click through rates in all APAC markets
comScore: Cross-Platform Future in Focus report (2017)Filipp Paster
Idea of this report to provide an examination of recent history in the worlds of TV and digital media with an eye toward what’s to come. One of the threads that immediately jumped out to us in our analysis of the digital media landscape is that there are now clear signs that the mobile media era – which has seen an explosion in incremental digital media usage – appears to be at the latter stages of its growth supercycle. Now, of course, mobile will continue to be a massive channel in terms of how consumers spend their media time, but the rate of growth is clearly beginning to taper off as the market reaches maturity.
A look at what all the big platforms such as Facebook, Twitter, Instagram, YouTube are currently doing, what changes they are making and what marketers will be seeing more of in 2015 from the social media space.
Authors:
Carla Gontier
@GrumpyGont
Tyrone Nell
Social Media Community Size and Growth Benchmarks – February 2016Zuum
A report on the number of fans and the growth rate of those fans across 7 industries, including Luxury Fashion, Soft Drinks, State Tourism, Luxury Autos, Children’s Hospitals, Consumer Electronics, and Snack Foods. Networks include Facebook, Twitter, Instagram, YouTube, Google Plus and Pinterest.
Internet users statistics & trends: Brazil, Russia, India, China, IndonesiaVaibhav Agarwal
Global Internet / Digital / Online users / consumers from Brazil, Russia, India, China and Indonesia including growth patterns and trends in internet and mobile growth.
Opera Mediaworks is the largest mobile advertising and marketing platform in the world, reaching an audience of 1.2 billion consumers globally. We help clients deliver innovative brand experiences that evoke emotion and deliver real outcomes fueled by data, technology and creativity. Trusted by Fortune 500 brands and more than 85% of the world’s top grossing mobile publishers, we are an essential advertising and monetization platform to drive meaningful results on mobile. Known for our exclusive Instant-Play™ HD video technology, our global performance advertising business and our extensive ad SDK footprint in the Top 1000 apps worldwide, we are passionate about helping brands connect with consumers at scale on the most important screen in their lives. A fully-owned subsidiary of Opera ASA, Opera Mediaworks is a global organization with 24 offices worldwide.
Everything you need to know about mobile, internet, social media, and e-commerce use in Egypt in 2015. For more reports, including the latest global trends and individual data for more than 230 countries around the world, visit http://datareportal.com
Mobile apps account for 57 percent of all digital media usage, and smartphone apps alone capture more than half of digital media time spent.
Why have apps become such a powerful force in our daily media lives? The power of habit. The 2017 U.S. Mobile App Report explores the dynamics of mobile media consumption, audiences, and user habits to understand what’s driving this mobile activity, how it has evolved, and how publishers and advertisers can take advantage.
Some key topics covered in the report include:
Mobile app vs. mobile web usage and audience behavior
Highlights of top-ranking and fast-growing apps
App activity among Millennials and other valuable audience segments
Consumers’ attitudes and perceptions towards apps and the app landscape
Usage habits and behavioral tendencies of app users
Deep dives into several app categories, including retail, gaming and online dating
All the data, statistics, and trends you need in order to understand digital in Italy in 2020. Includes the latest reported numbers for internet users, social media users, and mobile connections in Italy, as well as key indicators of ecommerce use. For more reports, including the latest global trends and individual data for more than 230 countries around the world, visit https://datareportal.com/
Vietnam Digital Landscape 2018 - Comprehensive Views Perry Cao
Vietnam Digital Landscape 2018 is a compiling work to recap the Digital Landscape 2018 in Vietnam market. The information is collected from mainstream sources and trustworthy partners. I do not own any copyright information contained in the work.
*** Anyone is into using it for your work, please contact me for your credit request's acceptance.
•Please leave your email in Comment Box to receive The Official Version from ADSOTA
•Vui lòng để lại email bên dưới để nhận được bản chính thức từ ADSOTA
___
•The report delivers an in-depth look at Vietnam digital advertising, including Internet user insights, digital ads statistics and trends during first 6 months of 2018 that Marketers and Advertisers may find very helpful.
•ADSOTA is very pleased to share it with you. Hope that you can make full use of these information for yourselves and your organization's particular purpose.
ABOUT ADSOTA:
• An advertising company under Appota Group.
• The first & only Facebook gaming agency in Vietnam
• Joint venture partner of TNK Factory (of Kakao Group)
• Collaborative partner of Google, executing AppotaX project for mobile publishers to leverage app traffic and maximize in-app ads revenue.
• Facebook Gaming Creator Program’s MCN in Vietnam
• Member of Mobile Marketing Association (MMA)
• Third Party Accreditation:
-Google's Fastest Revenue Growth Channel Partner in SEA
-Top 1 Facebook Ads Team For Game/App In APAC.
-Top 10 SMB Partner Of Google Network
-Top Non-gaming Media Source 2016 (By Appsflyer)
___
BÁO CÁO VỀ THỊ TRƯỜNG QUẢNG CÁO TRỰC TUYẾN VIỆT NAM (Nửa đầu năm 2018)
• ADSOTA xin gửi tới những thông tin về người dùng Internet Việt Nam, các số liệu và xu hướng về thị trường quảng cáo trực tuyến Việt Nam nửa đầu năm 2018.
• Tin rằng, đây sẽ là tài liệu hữu ích đối với các nhà quảng cáo, các doanh nghiệp cùng sản phẩm, dịch vụ, nhãn hàng đang hoạt động tại thị trường Việt Nam.
GIỚI THIỆU - ADSOTA là:
• Adsota là công ty con thuộc Appota Group
• Agency quảng cáo của Facebook trong mảng Game đầu tiên và duy nhất tại Việt Nam
• Đối tác liên doanh của TNK Factory (thuộc tập đoàn Kakao) - Hàn Quốc
• Đối tác chiến lược của Google, triển khai AppotaX – giải pháp gia tăng doanh thu quảng cáo di động trên nền tảng Ad Exchange
• Đối tác triển khai chương trình Gaming Creator duy nhất của Facebook tại Việt Nam
• Thành viên Hiệp Hội Mobile Marketing
•Thành tích nổi bật:
-Đơn vị chạy quảng cáo Game/App hàng đầu APAC do Facebook xếp hạng
-Đối tác của Google có doanh thu tăng trưởng nhanh nhất KV Đông Nam Á
-Top 10 đối tác SMB của Google Network
-Kênh quảng cáo hàng đầu cho app ngoài Game do Appsflyer bình chọn
_____
Website: http://adsota.com
Business inquiries: sale@adsota.com
Hotline (for Advertisers): (+84) 911 983 189
Hotline (for Publishers): (+84) 911 930 190
The main numbers, statistics and trend analysis of Runet (russian segment of the Internet), which describe its fundamental features, concerning Digital Marketing field.
Everything you need to know about mobile, internet, social media, and e-commerce use in China in 2015. For more reports, including the latest global trends and individual data for more than 230 countries around the world, visit http://datareportal.com
TV Commercials still rule in much of Asia - How effective is yours?Cimigo
1. TV Advertising spend in Vietnam is still growing.
2. Spend on TV Advertising dominates all advertising in Vietnam, and is higher than the regional average.
3. Much TV spend though is wasted through failing to advertise the brand and failing to make a connection.
4. AdTraction shows you how well you are making the connection.
5. Use AdTraction to make sure you are getting ROI!
A summary of the key trends and statistics about one of the world’s most dynamic media markets. The information included in this presentation is for reference only.
Digital numbers and landscape in indonesia 2016 updatedSeno Pramuadji
This is the update version of digital number in Indonesia based on APJII survey. Although there has been controversy regarding the survey, I'm just re-compile it into much easier use and read.
This companion report to We Are Social's comprehensive new Digital in 2016 report presents headline internet, social and mobile data for 232 countries around the world. Each country snapshot is presented as its own infographic, ready to be copy-pasted direct into your own presentations or web content. For a more insightful analysis of the numbers in this report, please visit http://bit.ly/DSM2016ES.
The following whitepaper from IBM which throws more light on how digital marketers are leveraging technological tools to engage better with today’s digitally empowered customers.
In 2016, mobile advertising spend will exceed $100B globally! It's now more important than ever for marketers to understand the impact mobile is having on our global economy. In this report, we dive into the major elements of the digital marketplace, as well as the factors driving the year's biggest mobile trends.
We have identified eight major trends that comms and marketing professionals need to be thinking about for 2016. For more details, visit www.grayling.com/global/insights
2015 US digital future in focus - Comscore - 26 March 2015Romain Fonnier
Dans son livre blanc «2015 U.S. Digital Future in Focus», comScore revient sur le bilan de l’année 2014, marquée par de grands changements dans le comportement du consommateur numérique dans différents secteurs : mobile, social media, vidéo, publicité, search et e-commerce. A travers 24 pages, l’institut tire des insights de l’année passée pour projeter les tendances majeures en 2015. Les principaux points abordés au sein du livre blanc sont :
- L’implication d’une population de plus en plus numérique et multiplateforme
- La croissance dynamique des médias numériques et des applications mobiles
- La rupture continue du mobile dans tout l’écosystème digital
- Comment les audiences des principaux réseaux sociaux vont s’accumuler
- La transition de la publicité numérique vers la visibilité des impressions
- La croissance continue de la vidéo en ligne et l’émergence de la vidéo mobile et OTT
- Comment les requêtes sur le web vont se répartir entre desktop, smartphone et tablette
- La croissance incessante de l’e-commerce et l’émergence du m-commerce
The digital world achieved enormous progress in 2014 as several transformative changes shaped how Americans interacted with technology and consumed media. Perhaps more so than at any other time in recent memory, changes were not merely incremental but rather seemed to represent key inflection points in the evolution of various markets and behaviors. We saw platforms collide in ways that upended existing markets, reconfigured the economics of various industries, and suggested that we are embarking on a new era of digital that will look markedly different from its predecessor.
Consider some of the digital milestones of 2014 and what they suggest about the future. This was the year that:
Mobile app usage exploded on its way to becoming the majority of all digital media activity.
Leading publishers saw mobile revenues surpass desktop revenues, signaling a shift towards mobile as the primary digital media platform.
Traditional TV ratings saw pronounced declines as Americans’ viewing habits time-shifted and moved to emerging platforms.
Digital advertising went through a challenging but important transition to transacting on impressions that are actually seen by people.
In this report, we will examine some of the most important sectors of the digital media ecosystem to show how the landscape has changed, who is leading the way, and what it all means for the year ahead – and beyond. It is an exciting time in digital and we hope this exploration of today’s key issues helps put the Digital Future in Focus.
This is a Report about Us Digital Future in Focus (especially in Mobile, Social, Video,..) from Comscore that I appreciate a lots.
In this report, they examine some of the most important sectors of the digital media ecosystem to show how the landscape has changed, who is leading the way, and what it all means for the year ahead – and beyond. It is an exciting time in digital and we hope this exploration of today’s key issues helps put the Digital Future in Focus.
Mobileday 2016 - User behavior & Insight; How to surf the wave? - Phan Tuan AnhTuấn Anh Phan
In order to understand mobile user behavior & insight in Asean & Emerging Market in 2016.
Why mobile?
In fact, users think mobile is just mobile, their smartphone
08 critical points for each Marketer in order to develop mobile marketing strategy
The combination of: Mobile Connects Everything + Consumer Decision Journey + Gamification = Mobile Advocacy Journey
For mobile, it's all about interactive + relative
Harnessing Social and Mobile to Court the Digital ConsumerCognizant
Our recent research shows the myriad ways that digital consumers are increasingly incorporating social and mobile technologies into their shopping and buying experiences.
Altimeter Group, prepared for Facebook
Rebecca Lieb, analyst
Jaimy Szymanski, senior researcher
For brands to build engagement and maintain respectful relationships with consumers, mobile strategies must
become seamlessly integrated into existing marketing strategies and customer-experience efforts. Brands will also need to ensure that strong content for mobile is coupled with an integrated media approach to keep the brand’s message, voice and identity clear.
More people have a cell phone than a toothbrush. Oral hygiene aside, this speaks to the mobile nature of today's consumer culture. Is your message mobile ready?
Digital Advertising Trends 2021 – Mid-Year ReportJomer Gregorio
As more consumers shift towards virtual means of engagement and communication with brands, businesses, and other people, marketers were signaled to adopt a digital-first approach to advertising. Get more insights through this presentation.
Full blog here - https://digitalmarketingphilippines.com/digital-advertising-trends-2021-mid-year-report-infographic/
Winning over and keeping the new ‘always-on’ consumer has become the business imperative at the digital frontier. In the new era of digitalization it is a substantial challenge to reach the multitasking, screen agnostic and much more demanding customer. Recognizing this trend and aiming for digital growth is now a key factor for success.
Our discussion paper shows the importance of digitalization for businesses – B2B as well as B2C. It provides insights about how to exploit new potentials by using globeone’s tools ‘Digital Performance Leadership Measurement’, ‘Digital Consumer Journey’ and our ‘Corporate Website Evaluation Model’.
2. The number of messages PER DAY the average American sees.
3. Today, people spend more time
per day with digital than any other
medium.
And mobile is taking the lion’s
share of that usage, continuing to
gain TSL share.
Conversely, TV is declining YOY,
being surpassed by digital in 2013.
4.
5. When it comes to consumer trends, nothing is more
important than mobile devices.
Today, mobile now accounts for 51% of time spent with
digital media types.
6. And of U.S. adults who own a smartphone, 7% are “smartphone-dependent.”
12% of African Americans and 13% of Latinos are smartphone-dependent, compared
with 4% of whites.
7. So it should come as no
surprise that mobile now
accounts for 51% of time
spent with digital media
types
And when engaging with
consumers, this is the
most relevant touch point
advertisers can utilize.
8. 83%
of respondents say that
when travelling, their mobile
device is crucial when
deciding where to eat!
As location-based targeting
opportunities grow, mobile
devices are becoming more
influential than the PC when
it comes to making casual
dining decisions!
9.
10. And when discussing
Mobile, it’s hard not to
consider Social Media and
the role it plays in the lives
of consumers.
11. Today, the average user logs 1.72 hours per day on
social platforms alone.
In total time spent, that equates to 28% of all online
activity!
12. That’s because a typical consumer has approximately 7 social apps on their phones.
42 minutes
per day
34 minutes
per day
20 minutes
per day
13. And they are using them to influence the decisions of their peers!
14. Confidential and/or Proprietary - Do Not Redistribute
92% of users read
product reviews
89% of
those users
say that
review
influence
their
purchasing
decisions!
72% of consumers saying they trust online
reviews as much as WOM!
15. But with time spent within social media being so fragmented, how can
marketers make the greatest impact on these social platforms?
16. With
$9.6B being spent in the
U.S. alone.
A 31% increase
from 2014!
In 2015, Social network ad
spending is projected to
hit $23.68B worldwide
across all platforms.
17. Unsurprisingly, Facebook
dominates the paid social
space.
In 2015, the company is
expected to bring in $15.5B in
total ad revenue worldwide.
And with over 1.3B active
users, this platform provides
the most significant opportunity
of any social network to engage
with customers.
18. Twitter is also gaining traction in
the paid social sphere.
The “Holy Grail” of one-to-one
consumer interaction, the
company is expected to bring in
$2.09B in spend this year.
And locally, McDonald’s is playing
in the paid social space as well.
19. Nationally, McDonald’s has gotten into the Snapchat
space by pioneering the app’s new sponsored, location-
triggered filters into the app.
Among younger consumers, social media apps
like Instagram and Snapchat are gaining
momentum as the #2 and #3 most used platforms.
20. This direct link to consumers is part of the
evolution of marketing; allowing brands to work
closely with influencers who then can help them
reach other consumers indirectly.
21. As the social
sphere
continues to
push the
boundaries
Ultimately,
this means
that brands
will have to
“pay to play”!
marketers will
need to
reconsider how
to engage with
its consumers in
this space.
22. Paid social plays a
crucial role in
maintaining a
brand’s reputation
amongst their
followers.
It allows the
message to pop to
the top of the feed,
guaranteeing
eyeballs in this
engaging space.
23. Not only is the social space a
platform to build reputation, it is
also allows brands can maintain
their existing relationships.
24. And while mobile is the most relevant touch point for consumers, video
content still remains on top with digital vehicles accounting for 23% of
time spent with video content
25. Among those digital devices, mobile has grown exponentially and now
accounts for over half of time spent with all digital video consumption.
And it’s not just newer, small-format devices that are
contributing to the rise of digital video consumption.
26. It is projected that 35.5% of Americans will use a Connected TV this year.
27. Locally, the video strategy
has evolved to include the
mobile video tactic. Plus,
the opportunity to insert on
Connected TV is being
explored for 2016!
As video consumption
habits shift into the digital
space, so too should our
strategy follow suit.
28. Probably more pervasive than video content is audio.
Audio is found on just about every digital device a consumer owns; from their phones to
their cars and, now, even their household appliances!
29. But when it comes
to streaming
music, the top
device used by
consumers is
mobile.
30. 83% of online audio
listenership comes from a
mobile device
With the majority of listening
happening in the car while
commuting to/from work.
31. Consequently, Pandora remains the largest player in the
streaming audio space, accounting for 45% of market share.
And across all platforms, the usage skews young.
77% of A12-24 and 61% of A25-54 stream audio
on a weekly basis!
28% above the #2 and #3 players, iHeartRadio and iTunes
Radio.
32. This lends
itself well to
boosting
engagement
beyond a
typical ad.
By integrating social,
they are now able to
create a connection
with consumers
on-the-go.
Brands
continue to push the
envelope when it
comes to creative
uses of outdoor.
But digital
vehicles are not
the only way to
connect with
consumers on
the go.
33. Another OOH technological trend that is boosting engagement is
beacon technology and this is expected to
play a greater role in retail sales moving forward.
Beacon technology
allows mobile apps to
“understand” their
position on a micro-local
scale and deliver hyper-
contextual content to
users based on location.
35. A projected $4.4 billion will be
spent on TV during the 2016
election cycle, including
$3.3 billion on local
broadcast alone!
During a political window,
candidates can purchase
inventory at the lowest unit rate
and many DMA’s get political
spending from multiple states.
36. In the Tri-State area,
Primary political windows
are slated March, April
and July with the general
election opening
September 7th.
During these times in
particular, local inventory
will be tight and the
chances of being pre-
empted will increase.
Therefore, staying ahead
of the game and booking
schedule early will be of
the utmost importance in
order to secure inventory.
3,000. It’s a big number. What you do think this number represents? This is the number of messages
Overall, media usage continues to shift from more traditional vehicles into newer, more personalized digital vehicles. Therefore, it’s imperative that we keep up to date with usage trends so we can ensure that we are where our consumers are to remain relevant to them. (Click) Today, people spend more time per day with digital than any other medium. (Click) And mobile is taking the lion’s share of that usage, continuing to gain TSL share. (Click) Conversely, TV is declining YOY, having been surpassed by digital in 2013.
Because of this ever-changing landscape, being able to target our consumers directly will be an important piece of the 2016 media landscape. Because these digital vehicles that are gaining more and more share of time spent among consumers, we can glean insights into our consumer like never before. With this data we can optimize our digital campaigns and amplify our traditional buys to allow McDonald’s to relevantly target their consumers. At the end of the day, it’s about reformatting the experience that they have always had with the brand but playing in their space on new devices.
When it comes to consumer trends, again, nothing is more important than their mobile devices. (Click) So important that today, it now accounts for 51% of time spent with digital media types. This means that consumers are much more accessible than ever before, allowing brands to have intimate, one-on-one connections with their consumers.
Sources:
http://www.smartinsights.com/mobile-marketing/mobile-marketing-analytics/mobile-marketing-statistics/
Smartphone-dependent, meaning they have no other way of accessing online/digital content.
Source: http://www.pewinternet.org/2015/04/01/us-smartphone-use-in-2015/
As the local mobile plan evolves, location-based targeting is being incorporated to allow McDonald’s to communicate with consumers throughout their day on a locally relevant basis. A good example of this is the Waze app, which will ping a consumer with local deals within a specific area while also giving you driving directions! This is just one of many platforms currently being utilized/explored for local plans.
(Before reading first bubble) However, while consumers are more accessible via their phones, their time is actually extremely fragmented in this space.
(Read first bubble) A typical consumer has approximately 7 social apps on their phones at any one time. Among those apps (click) Facebook is the top social network with individuals spending 42 minutes per day on this app alone (click) followed by Tumblr at 43 minutes (click) and Instagram at 20 minutes per day.
http://dazeinfo.com/2015/01/12/social-media-addiction/
http://www.adweek.com/socialtimes/social-media-minutes-day/503160
And they are actually using those apps to influence the decisions of their peers. (Click) From Twitter (click) to Yelp, consumers are voicing their opinions on products, services and experiences that they have in the market. Therefore, it’s imperative that brands move into this space in order to help drive positive conversations to build relationships with customers.
(after slide build) By putting dollars towards social media, brands are able to amplify their organic social media content, allowing them to break through the clutter within feeds and improving their impact with consumers.
http://marketingland.com/social-media-advertising-set-explode-next-3-years-121691
http://www.emarketer.com/Article/Social-Network-Ad-Spending-Hit-2368-Billion-Worldwide-2015/1012357
http://www.growthmachines.co/742/
Take Facebook for instance. They’re not only the biggest social network and driver od social referral traffic, but were also one of the first to introduce paid social media ads in 2004.
Insert Local Twitter page!
Locally, McDonald’s engages with consumers through their local Twitter handles. In conjunction with organic growth, your media partners are implementing paid social into their plans to push foot traffic to these local handles. Moving forward, paid social will continue to grow, allowing follower bases to increase and, as a result, the opportunity for consumer relationships to strengthen.
Therefore, as the social sphere continues to push the boundaries, (click) marketers will need to reconsider how to engage with its consumers in this space. (Click) Ultimately, this means that brands will have to “Pay to Play”. So really, to be effective in this space brands need to go beyond just organic posts and put dollars behind their social media.
Paid social really plays a crucial role in maintaining a brand’s reputation amongst their follower. (Click) By putting dollars into this space, this allows the message to pop to the top of the feed, guaranteeing eyeballs in this engaging space. This means that you can push the conversations that you want consumers to know about to the front of their feeds, essentially influencing their opinions of the brand.
Q: If asked why we focus on Twitter vs FB…
A: We have more access and ownership with twitter locally than we currently do with Facebook.
But it’s not just about influencing the reputation of a brand. (click) The social space is also a great platform to build a brand’s reputation in that it allows brands to maintain their existing relationships by responding to the good/bad posts, retweeting positive posts, etc.
And while mobile is the most relevant touch point for consumers, video content still remains on top with digital vehicles accounting for 23% of time spent with video content. Again, it’s important to note that consumers now have greater access to video content considering the increase of technology in the digital space.
Among those digital devices, mobile has seen exponential growth (92% since 2011) and now accounts for over HALF of the time spent with all digital video consumption. (click) However, it’s not just the newer, small-format devices that are contributing to the rise of digital video consumption.
Sources:
http://www.emarketer.com/Article/Majority-of-US-Internet-Users-Use-Connected-TV-by-2015/1010908
http://www.emarketer.com/Article/Video-Quality-Problems-Say-Bye-Bye-Millennial-Binge-Viewers/1012735
So think about smartphones – you wouldn’t watch a movie on a smartphone normally. Handheld devices are good for short form video, whereas TV screens are the opposite.
TV’s are actually getting smarter! The new TVs with internet connectivity allow your larger format screens to enter the digital arena. In fact, it is projected that 35.5% of American will use a Connected TV this year. This brings the digital realm into the household, allowing families and other large groups to have the same experience they are used to, just customized to them.
Sources:
http://www.emarketer.com/Article/Majority-of-US-Internet-Users-Use-Connected-TV-by-2015/1010908
http://www.emarketer.com/Article/Video-Quality-Problems-Say-Bye-Bye-Millennial-Binge-Viewers/1012735
So think about smartphones – you wouldn’t watch a movie on a smartphone normally. Handheld devices are good for short form video, whereas TV screens are the opposite.
So, as consumers shift their video consumption habits into the digital space, so too should our strategy follow suit. (click) Locally, the video strategy has evolved to include the mobile video tactic (as we know this is where consumers are heading). Plus, the opportunity to insert on Connected TV is being explored for 2016. It’s all about staying relevant with our consumers!
Sources:
http://www.emarketer.com/Article/Majority-of-US-Internet-Users-Use-Connected-TV-by-2015/1010908
http://www.emarketer.com/Article/Video-Quality-Problems-Say-Bye-Bye-Millennial-Binge-Viewers/1012735
So think about smartphones – you wouldn’t watch a movie on a smartphone normally. Handheld devices are good for short form video, whereas TV screens are the opposite.
Probably more pervasive than video content is audio. (click) Audio is found on just about every digital device a consumer owns; from their phones to their cars and, now, even their household appliances.
Sources:
http://www.emarketer.com/Article/Majority-of-US-Internet-Users-Use-Connected-TV-by-2015/1010908
http://www.emarketer.com/Article/Video-Quality-Problems-Say-Bye-Bye-Millennial-Binge-Viewers/1012735
So think about smartphones – you wouldn’t watch a movie on a smartphone normally. Handheld devices are good for short form video, whereas TV screens are the opposite.
Furthermore, 83% of online audio listenership comes from a mobile device (click) with the majority of listening happening in the care while commuting to/from work. Because of how pervasive audio it, this is a crucial touch point for brands to tap into to establish relevance as your brand can help customize the user’s experience.
But Pandora isn’t the only player in this space. Other platforms like Spotify and apple Music are making huge dents in this space. Across all vendors and channels, 77% of A12-24 and 61% of A25-54 stream audio on a weekly basis.
For bigger format media such as OOH, consumer engagement is much more difficult to achieve. (Click) Therefore, brands are continuing to push the envelope with it comes to creative uses of outdoor. (click) By integrating social media into this vehicle, they are now able to create a connection with consumers-on-the-go. (Clikc) This lends itself well to boosting engagement beyond a typical ad as consumers can see their social media posts shared on such a large screen! This tells consumers that brands are listening to their input and embracing the conversation being had behind-the-scenes.
A major thing to note for the 2016 fiscal year is that Political spending will be on the rise! (Click) A projected $4.4 billion will be spent on TV alone during the 2016 election cycle, including $3.3 billion on local broadcast alone! What does this mean for you? (Click) During a political window, candidates can purchase inventory at the lowest unit rate and many DMAs get political spending from multiple states. If these political windows fall in our local marketing windows, stations will be seeing more spending/activity that normal, meaning that our rates will need to increase in order to compete.
In (your market name here), the Primary political windows are slated for (month), (month), and (month), with the general election opening September 7th. (Click) During these times in particular, local inventory will be tight and the chances of being pre-empted will increase as there will be more spending to battle against than normal. (Click) Therefore, we have to stay ahead of the game and book schedules early in order to secure inventory for our local buys. However, during these times, the need to rethink the marketing strategy will be crucial. By shifting more dollars into vehicles such as Digital and OOH we can counter the loss in the TV space as these vehicles tend to have less of an inventory issue during political windows.
Here is a screenshot of the local political calendar for your market. You can see that (window, window, window) fall within our local window time periods. Therefore, to reiterate the point made earlier, we will need to rethink the strategy for these windows in order to counterbalance the inventory issues in TV.