Download to read offline
![We Are Social wearesocial.sg • @wearesocialsg
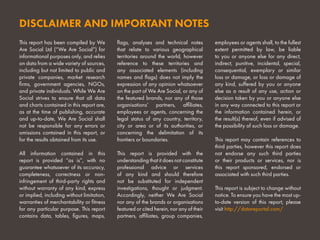
SOCIAL USE: PLATFORM CLAIMED
AUG
2015
• Sources: latest company statements, correct as at 12 August 2015
ACCOUNTS THAT LOGGED IN AT LEAST ONCE IN THE MOST RECENT 30-DAY REPORTING PERIOD, IN MILLIONS
843 !
659 !
600 !
300 !
176 !
105 !
627 !
574 !
600 !
N/A!
141 !
30 !
QQ
QZONE
WECHAT &
WEIXIN
BAIDU
TIEBA
SINA
WEIBO
YY
TOTAL USERS [ANY DEVICE]
USERS ACCESSING VIA MOBILE DEVICES](https://image.slidesharecdn.com/datareportal20150817gd100digital2015chinaaugust2015v02-181005084423/85/Digital-2015-China-August-2015-15-320.jpg)
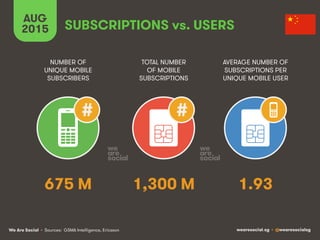
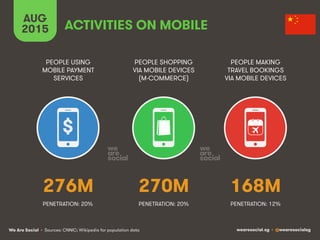
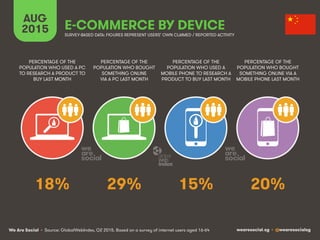
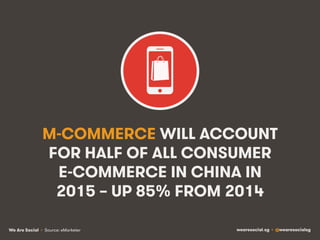

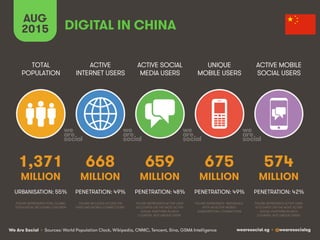
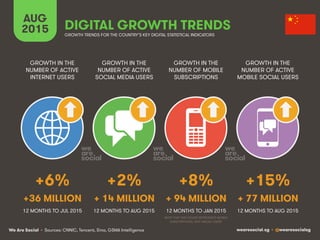
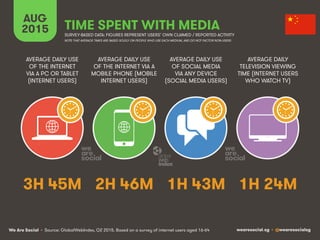
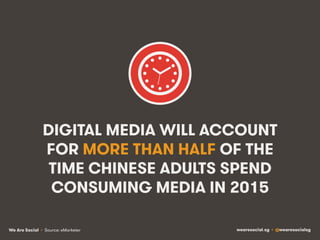
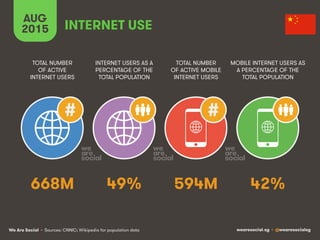
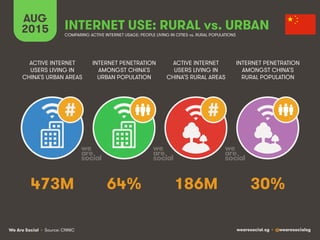
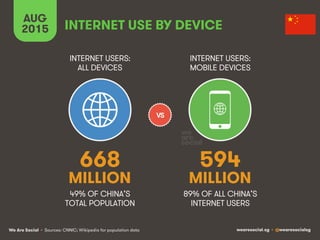
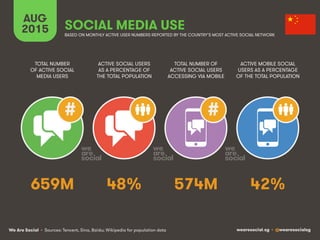
The document provides an overview of digital media usage statistics in China as of August 2015, highlighting key indicators such as the number of internet and social media users, mobile subscriptions, and growth trends. It notes that there are 668 million active internet users and 659 million social media users, with significant mobile penetration and increasing media consumption via mobile devices. The report emphasizes the rapid growth of e-commerce, projecting that mobile commerce will account for half of all consumer e-commerce in China.


![How Big Brands are Taking Your Traffic in Alberta [Data Inside].pptx](https://cdn.slidesharecdn.com/ss_thumbnails/howbigbrandsaretakingyourtrafficinalbertadatainside-260123180142-42d276f3-thumbnail.jpg?width=640&height=640&fit=bounds)