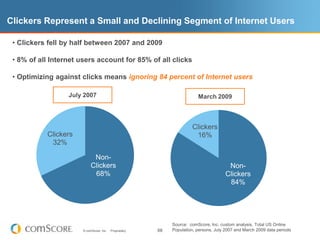
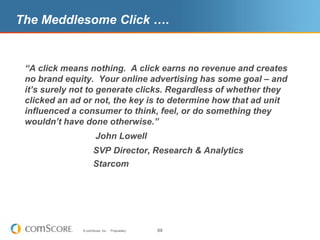
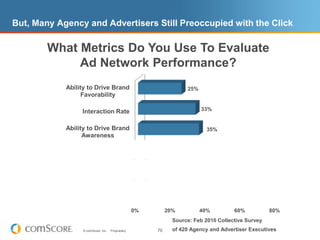
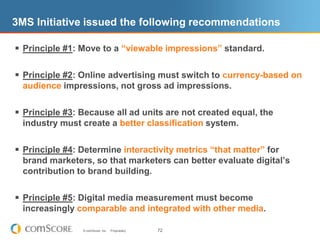
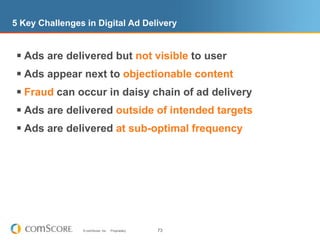
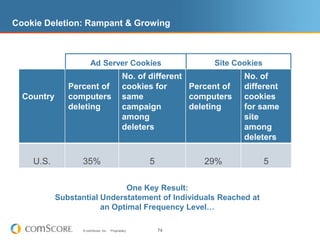
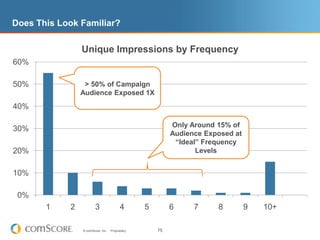
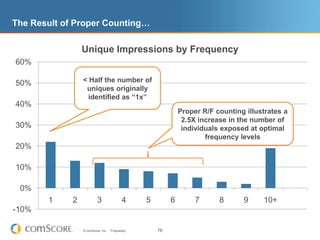
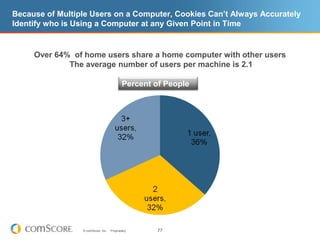
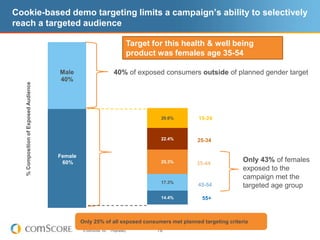
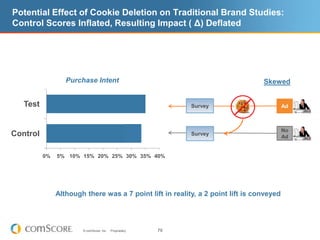
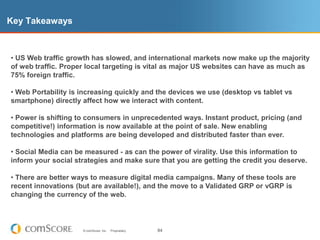
Bolo 2011Lessons Learned in Digital MediaHugh McGoran, SVP Agency Sales
The Digital LandscapeV1011
Let’s Talk About Me
Because this is a presentation on digital media and measurement…$7M$500K$250K$15K14RESPECTV1011
Day 1Day 2Day 3Busy Mom!
Historical Footnote:*Comscore6
Because this is a presentation on digital media and measurement…$7M$500K$250K$15K14V1011
Semantic TargetingTiger + Woods{}=
Semantic TargetingTiger + Woods{}+=
Because this is a presentation on digital media and measurement…$7M$500K$250K$15K14V1011
Changes in the Display Media EcosystemAdNetworksAgency Trading DesksExchanges, & SSPsData ProvidersPublishersBrandsDSPsAgencies
Because this is a presentation on digital media and measurement…$7M$500K$250K$15K14V1011
comScore is a Global Leader in Measuring the Rapidly Evolving Digital World, Blanketing the Globe with a Local PresenceV1011
comScore Leverages Rich Panel Data to Deliver Unique and Broad Digital Business AnalyticsWeb Visiting & Search BehaviorOnline AdvertisingExposureOnline& Offline BuyingAdvertisingEffectivenessTransactionsPANELMedia & VideoConsumptionDemographics,Lifestyles& AttitudesMobile InternetUsage & BehaviorV1011
Unified Digital Measurement™ (UDM) Establishes Platform For Panel + Census Data IntegrationGlobal DEVICE MeasurementGlobal PERSON MeasurementPANELCENSUSUnified Digital Measurement (UDM)Patent-Pending MethodologyAdopted by 90% of Top 100 U.S. Media PropertiesV1011
Percentage of Machines Included in UDM Measurement August 2011 Penetration DataAsia Pacific Australia	89%China	69%Hong Kong	91%India	90%Indonesia	90%Japan	73%Malaysia	91%New Zealand	91%Philippines	92%Singapore	90% South Korea	59%Russia	63%Taiwan	80%Vietnam	93%North AmericaCanada	93%United States	90%Europe Austria	81%Belgium	88%Denmark	89%Finland	83%                              France	92%Germany 	89% Ireland	89%Italy	85%Netherlands	88%Norway	89%Poland	81%Portugal	90%Spain	92%Sweden	90%Switzerland	85%Turkey	95%United Kingdom	91%Latin AmericaArgentina 	94%Brazil 	97%Chile	95%Colombia 	96%Mexico 	94%Peru	97%Puerto Rico 	89%Venezuela	93%Middle East & Africa Israel	92%South Africa	74%V1011
North AmericaDistribution of Worldwide Internet AudienceUS Internet Population vs. Rest of the WorldEuropeLatin AmericaRest of the WorldMiddle East - AfricaAsia PacificUSIn 1996, 2/3 of the world’s Internet population was in the US, yet today Asia Pacific is the largest region with over 40% of the population.
Many emerging regions are likely to bypass old modes, skipping dial-up to go straight to broadband, making multimedia, video, and collaborative content immediately accessible.
Early adoption of mobile web in addition to PC web will likely be popular in many of these high-growth areas.The US Is No Longer the Center of the Online UniverseSource:  comScore World Metrix, April 2011
11% Worldwide Growth Fueled by Country GrowthInternet Users Age 15+ (MM) Annual GrowthUS:			0.8%Mexico:		22%China			18%Brazil			18%Russian Federation	14%Source:  comScore World Metrix, July 2011
The Majority of Top Properties’ Audiences are Coming from Outside the USTotal Worldwide Unique Visitors (MM)Non-US AudienceUS Audience99184%89382%79%69867675%83%38126967%54%23722873%22060%65%218Source:  comScore World Metrix, April 2011
UDM provides insight across device types (what are customers using) and content consumption (what are customers doing).Device coverage across WiFi and non-WiFi connections.
Mobile Web Usage On Track to Eclipse the DesktopSource: Morgan Stanley ResearchNumber of Global Users (Millions)
Half of Pandora’s Total Audience Access from Mobile Only
Mobile Adds Incremental Reach for Key Publishers
Android share of non-fixed computer traffic now exceeds that of iPhone but iOS dominates when iPad and iPod included U.S. Non-Fixed Computer Traffic by DeviceSource: comScore Device Essentials, U.S. May 2011
Google’s Android Has Rapidly Grown its Smartphone Market Share and Has Taken the Lead in the Race with Apple and RIMProduct: MobiLensData: Three month average ending July 2011Country: US, N= 31,100
Google’s Android Has Rapidly Grown its Smartphone Market Share and Has Taken the Lead in the Race with Apple and RIMProduct: MobiLensData: Three month average ending July 2011Country: US, N= 31,100Smartphone ownership increase year over year:54%Android growth year over year:278%
Platform Explosion is Just Getting Started66% of Americans DO NOT yet have a SmartphoneUS Smartphone Penetration:95% of Americans DO NOT yet have an iPadUS iPad Penetration:
May 1995 Time Magazine Special Issue
Wifi accounts for majority of non-fixed computer trafficTotal U.S. Traffic from Non-Fixed ComputersSource: comScore Device Essentials, U.S. May 2011
Mobile networks far more important to Android devicesShare of Traffic by DeviceSource: comScore Device Essentials, U.S. May 2011Smartphone = MobileTablet = Portable
72 Million People (31% of 234 Million U.S. Mobile Subscribers, up 15% vs. Previous Qtr) Now Use a Smartphone to Access a Wide Variety of ContentWhen it Comes to Mobile Content Consumption, Retail Ranks as 3rd Fastest Growing Category
Smartphone usage and shoppingSmartphone Usage For ShoppingQ. For which of the following have you used your smartphone? Source: comScore Survey – April 201161%50%“Smartphone shoppers” are defined as those who stated they have used their phones to research or purchase products online
Smartphone usage and shoppingSmartphone Usage For ShoppingQ. For which of the following have you used your smartphone? Source: comScore Survey – April 201152%38%“Smartphone shoppers” are defined as those who stated they have used their phones to research or purchase products online
Smartphone usage and shoppingSmartphone Usage For ShoppingQ. For which of the following have you used your smartphone? Source: comScore Survey – April 201152%52%35%38%“Smartphone shoppers” are defined as those who stated they have used their phones to research or purchase products online
Smartphone usage and shoppingSmartphone Usage For Shopping681 Barcode Apps for the iPhone!Q. For which of the following have you used your smartphone? Source: comScore Survey – April 201129%20%“Smartphone shoppers” are defined as those who stated they have used their phones to research or purchase products online
Smartphone usage and shoppingSmartphone Usage For ShoppingQ. For which of the following have you used your smartphone? Source: comScore Survey – April 201148%33%“Smartphone shoppers” are defined as those who stated they have used their phones to research or purchase products online
In the Consumer Electronics category, e-commerce is having a profound negative impact on bricks & mortar retailers. Tuesday, March 8, 2011 Forecast for Best Buy: Worst Is Yet to Come Some key observations:E-commerce represents 25%+ of all sales of consumer electronics
Spending on the consumer electronics category at retail during the holiday season was down 5%* while online saw growth of 20%**.
Domestic same store sales of Best Buy declined by 5% and total sales declined by 3% in Q4 2010
Online sales of Best Buy increased by 13% in December
comScore data show Amazon consumer electronics sales up 37% Source:  *NPD & ** comScore
The Power of Like
It is difficult to overstate the importance of social mediaUsage among US and overseas internet users is nearly ubiquitousSocial media is transforming:Geopolitics:  Tunisia, Egypt, Libya, etcUS politics:  2008 election, and soon the 2012 electionRetail:  GroupOn visitation is up 250% versus last yearMarketing:  Facebook is the single largest server of display inventory on the webConsumer behavior:  Social media accounts for 18% of all time spent online
Total Minutes on Social Media sites has increased 38% year over yearQ: How many minutes do internet users spend on Social Media sites?comScore Media Metrix, June 2011 (Panel Only Data)A: 73 Billion
Social Media sites draw more visitors than retail, e-mail, and news sitesQ:  What percentage of internet users visit a Social Media site?A: 84.2%comScore Media Metrix, June 201 (Panel Only Data)
Just how important is social media?381minutes per user704pages per user33visits per user
Facebook can deliver massive audiences, but Tumblr, LinkedIn & Twitter are growing fastest
Google+ already at 25 million visitors worldwide
Brand pages on Google+ might become very important to retailersZeny Huang, Emerging Media Strategist at JWT New York4 Reasons Google+ Brand Pages will be Better than Facebook’sBetter Search OpportunitiesMore CustomizationBetter AnalyticsGoogle Can Learn from Facebook"Google+ tries to take the best from Facebook and the best from Twitter and brings it together.”Shiv SinghGlobal Head of Digital, PepsiCo
Who visits Social Media sites?  Pretty much everyone.
Between September 2010 and April 2011, the percentage of adults who have ‘liked’ a brand increased from 47% to 59%eMarketer Daily, June 16, 2011Nearly 6 out of 10 Facebook users over age 18 liked a brand in April 2011.
Strategic challenges addressed by Social Essentials insights:Social EssentialsDetermine whether a brand is reaching it’s target consumer.Benchmarka brand’s presence on Facebook to their competitors.Compare the reach and frequencyof a brand’s Facebook presence to other media channels.Tailor marketing campaigns and partnerships to Facebookaudience’s interests and passions.
Measuring engagement on FacebookSegments can be applied to any comScore analysis
Newsfeed & Ad Exposures
Sponsored Stories
Profile/Wall Exposures
What we know to be true…Facebook Fans do not translate into regular visitors to Facebook Fan Pages. Marketers need to reach out to them with relevant content!*Source: Facebook** Source: comScore
Brands should focus more on the news feed and less on the fan pageRatio of News Feed Exposures to Fan Page Views42 to 145 to 1156 to 1
Brands can relate social impressions to the rest of their campaign
Fans are heavy Facebookers
Fans spend 1/3 of their time on social networking sites
Facebook is reaching a younger audience than the brand’s typical site visitors
Fans and Friends over index on visitation to the brand site when compared to the average Internet userStarbucks, Southwest, Bing: Lift in Website Visitation Among Fans & Friends vs. Average Internet UserSource: comScore Social Essentials, U.S., May 2011Why do friends of fans have a higher orientation toward the brand?Birds of a feather flock togetherTrusted persuasionFansFriends
Across key data points, Bing Fans outperform the average Bing visitor
For Starbucks, Exposed Fans also tend to spend more than the average Internet user
Some advertisers heavily use social media to encourage brand interactionHeineken heavily used socially enabled ads in May to encourage users to interact with its brand through FacebookKraft delivered the most socially enabled ads in May (about 166M impressions)* Ad Metrix (May 2011) US data
comScoreSocial Essentials WhitepaperCase study on Starbucks, Southwest Airlines and BingPublished in collaboration with FacebookDemonstrates how holistic understanding of social impact can  change the way brands think about, leverage and build social audiencesTo download white paper please visitwww.comscore.com/like
The need to verify and measure media plan delivery and effectiveness is more important than ever
Cookies are not people. They may have some data tied to them but they are by nature not overly accurate regarding a user’s demographics or profile.
Clicks are at best an incompleteand at worst a misleading metric
Clickers Represent a Small and Declining Segment of Internet Users  Clickers fell by half between 2007 and 2009
 8% of all Internet users account for 85% of all clicks
 Optimizing against clicks means ignoring 84 percent of Internet usersJuly 2007March 2009Source:  comScore, Inc. custom analysis, Total US Online Population, persons, July 2007 and March 2009 data periods
The Meddlesome Click ….“A click means nothing.  A click earns no revenue and creates no brand equity.  Your online advertising has some goal – and it’s surely not to generate clicks. Regardless of whether they clicked an ad or not, the key is to determine how that ad unit influenced a consumer to think, feel, or do something they wouldn’t have done otherwise.”John Lowell                            SVP Director, Research & Analytics                            Starcom
But, Many Agency and Advertisers Still Preoccupied with the Click  Source: Feb 2010 Collective Survey of 420 Agency and Advertiser Executives What Metrics Do You Use To EvaluateAd Network Performance?
IAB Initiative:Making Measurement Make Sense
3MS Initiative issued the following recommendationsPrinciple #1: Move to a “viewable impressions” standard.Principle #2: Online advertising must switch to currency-based on audience impressions, not gross ad impressions.Principle #3: Because all ad units are not created equal, the industry must create a better classification system.Principle #4: Determine interactivity metrics “that matter” for brand marketers, so that marketers can better evaluate digital’s contribution to brand building.Principle #5: Digital media measurement must become increasingly comparable and integrated with other media.
5 Key Challenges in Digital Ad DeliveryAds are delivered but not visible to userAds appear next to objectionable contentFraud can occur in daisy chain of ad deliveryAds are delivered outside of intended targetsAds are delivered at sub-optimal frequency
Cookie Deletion: Rampant & GrowingSite CookiesAd Server CookiesOne Key Result: Substantial Understatement of Individuals Reached at an Optimal Frequency Level…
Does This Look Familiar?> 50% of Campaign Audience Exposed 1XOnly Around 15% of Audience Exposed at “Ideal” Frequency Levels
The Result of Proper Counting…< Half the number of uniques originally identified as “1x”Proper R/F counting illustrates a 2.5X increase in the number of individuals exposed at optimal frequency levels
Because of Multiple Users on a Computer, Cookies Can’t Always Accurately Identify who is Using a Computer at any Given Point in TimeOver 64%  of home users share a home computer with other users The average number of users per machine is 2.1  Percent of People
Cookie-based demo targeting limits a campaign’s ability to selectively reach a targeted audience Target for this health & well being product was females age 35-5440% of exposed consumers outside of planned gender target15-2425-34Only 43% of females exposed to the campaign met the targeted age group35-4445-54Only 25% of all exposed consumers met planned targeting criteria

McGoran -- Keynote

  • 1.
    Bolo 2011Lessons Learnedin Digital MediaHugh McGoran, SVP Agency Sales
  • 2.
  • 3.
  • 4.
    Because this isa presentation on digital media and measurement…$7M$500K$250K$15K14RESPECTV1011
  • 5.
    Day 1Day 2Day3Busy Mom!
  • 6.
  • 7.
    Because this isa presentation on digital media and measurement…$7M$500K$250K$15K14V1011
  • 8.
  • 9.
  • 10.
    Because this isa presentation on digital media and measurement…$7M$500K$250K$15K14V1011
  • 11.
    Changes in theDisplay Media EcosystemAdNetworksAgency Trading DesksExchanges, & SSPsData ProvidersPublishersBrandsDSPsAgencies
  • 12.
    Because this isa presentation on digital media and measurement…$7M$500K$250K$15K14V1011
  • 13.
    comScore is aGlobal Leader in Measuring the Rapidly Evolving Digital World, Blanketing the Globe with a Local PresenceV1011
  • 14.
    comScore Leverages RichPanel Data to Deliver Unique and Broad Digital Business AnalyticsWeb Visiting & Search BehaviorOnline AdvertisingExposureOnline& Offline BuyingAdvertisingEffectivenessTransactionsPANELMedia & VideoConsumptionDemographics,Lifestyles& AttitudesMobile InternetUsage & BehaviorV1011
  • 15.
    Unified Digital Measurement™(UDM) Establishes Platform For Panel + Census Data IntegrationGlobal DEVICE MeasurementGlobal PERSON MeasurementPANELCENSUSUnified Digital Measurement (UDM)Patent-Pending MethodologyAdopted by 90% of Top 100 U.S. Media PropertiesV1011
  • 16.
    Percentage of MachinesIncluded in UDM Measurement August 2011 Penetration DataAsia Pacific Australia 89%China 69%Hong Kong 91%India 90%Indonesia 90%Japan 73%Malaysia 91%New Zealand 91%Philippines 92%Singapore 90% South Korea 59%Russia 63%Taiwan 80%Vietnam 93%North AmericaCanada 93%United States 90%Europe Austria 81%Belgium 88%Denmark 89%Finland 83% France 92%Germany 89% Ireland 89%Italy 85%Netherlands 88%Norway 89%Poland 81%Portugal 90%Spain 92%Sweden 90%Switzerland 85%Turkey 95%United Kingdom 91%Latin AmericaArgentina 94%Brazil 97%Chile 95%Colombia 96%Mexico 94%Peru 97%Puerto Rico 89%Venezuela 93%Middle East & Africa Israel 92%South Africa 74%V1011
  • 17.
    North AmericaDistribution ofWorldwide Internet AudienceUS Internet Population vs. Rest of the WorldEuropeLatin AmericaRest of the WorldMiddle East - AfricaAsia PacificUSIn 1996, 2/3 of the world’s Internet population was in the US, yet today Asia Pacific is the largest region with over 40% of the population.
  • 18.
    Many emerging regionsare likely to bypass old modes, skipping dial-up to go straight to broadband, making multimedia, video, and collaborative content immediately accessible.
  • 19.
    Early adoption ofmobile web in addition to PC web will likely be popular in many of these high-growth areas.The US Is No Longer the Center of the Online UniverseSource: comScore World Metrix, April 2011
  • 20.
    11% Worldwide GrowthFueled by Country GrowthInternet Users Age 15+ (MM) Annual GrowthUS: 0.8%Mexico: 22%China 18%Brazil 18%Russian Federation 14%Source: comScore World Metrix, July 2011
  • 21.
    The Majority ofTop Properties’ Audiences are Coming from Outside the USTotal Worldwide Unique Visitors (MM)Non-US AudienceUS Audience99184%89382%79%69867675%83%38126967%54%23722873%22060%65%218Source: comScore World Metrix, April 2011
  • 22.
    UDM provides insightacross device types (what are customers using) and content consumption (what are customers doing).Device coverage across WiFi and non-WiFi connections.
  • 23.
    Mobile Web UsageOn Track to Eclipse the DesktopSource: Morgan Stanley ResearchNumber of Global Users (Millions)
  • 24.
    Half of Pandora’sTotal Audience Access from Mobile Only
  • 25.
    Mobile Adds IncrementalReach for Key Publishers
  • 26.
    Android share ofnon-fixed computer traffic now exceeds that of iPhone but iOS dominates when iPad and iPod included U.S. Non-Fixed Computer Traffic by DeviceSource: comScore Device Essentials, U.S. May 2011
  • 27.
    Google’s Android HasRapidly Grown its Smartphone Market Share and Has Taken the Lead in the Race with Apple and RIMProduct: MobiLensData: Three month average ending July 2011Country: US, N= 31,100
  • 28.
    Google’s Android HasRapidly Grown its Smartphone Market Share and Has Taken the Lead in the Race with Apple and RIMProduct: MobiLensData: Three month average ending July 2011Country: US, N= 31,100Smartphone ownership increase year over year:54%Android growth year over year:278%
  • 30.
    Platform Explosion isJust Getting Started66% of Americans DO NOT yet have a SmartphoneUS Smartphone Penetration:95% of Americans DO NOT yet have an iPadUS iPad Penetration:
  • 31.
    May 1995 TimeMagazine Special Issue
  • 32.
    Wifi accounts formajority of non-fixed computer trafficTotal U.S. Traffic from Non-Fixed ComputersSource: comScore Device Essentials, U.S. May 2011
  • 33.
    Mobile networks farmore important to Android devicesShare of Traffic by DeviceSource: comScore Device Essentials, U.S. May 2011Smartphone = MobileTablet = Portable
  • 34.
    72 Million People(31% of 234 Million U.S. Mobile Subscribers, up 15% vs. Previous Qtr) Now Use a Smartphone to Access a Wide Variety of ContentWhen it Comes to Mobile Content Consumption, Retail Ranks as 3rd Fastest Growing Category
  • 35.
    Smartphone usage andshoppingSmartphone Usage For ShoppingQ. For which of the following have you used your smartphone? Source: comScore Survey – April 201161%50%“Smartphone shoppers” are defined as those who stated they have used their phones to research or purchase products online
  • 36.
    Smartphone usage andshoppingSmartphone Usage For ShoppingQ. For which of the following have you used your smartphone? Source: comScore Survey – April 201152%38%“Smartphone shoppers” are defined as those who stated they have used their phones to research or purchase products online
  • 37.
    Smartphone usage andshoppingSmartphone Usage For ShoppingQ. For which of the following have you used your smartphone? Source: comScore Survey – April 201152%52%35%38%“Smartphone shoppers” are defined as those who stated they have used their phones to research or purchase products online
  • 38.
    Smartphone usage andshoppingSmartphone Usage For Shopping681 Barcode Apps for the iPhone!Q. For which of the following have you used your smartphone? Source: comScore Survey – April 201129%20%“Smartphone shoppers” are defined as those who stated they have used their phones to research or purchase products online
  • 39.
    Smartphone usage andshoppingSmartphone Usage For ShoppingQ. For which of the following have you used your smartphone? Source: comScore Survey – April 201148%33%“Smartphone shoppers” are defined as those who stated they have used their phones to research or purchase products online
  • 40.
    In the ConsumerElectronics category, e-commerce is having a profound negative impact on bricks & mortar retailers. Tuesday, March 8, 2011 Forecast for Best Buy: Worst Is Yet to Come Some key observations:E-commerce represents 25%+ of all sales of consumer electronics
  • 41.
    Spending on theconsumer electronics category at retail during the holiday season was down 5%* while online saw growth of 20%**.
  • 42.
    Domestic same storesales of Best Buy declined by 5% and total sales declined by 3% in Q4 2010
  • 43.
    Online sales ofBest Buy increased by 13% in December
  • 44.
    comScore data showAmazon consumer electronics sales up 37% Source: *NPD & ** comScore
  • 45.
  • 46.
    It is difficultto overstate the importance of social mediaUsage among US and overseas internet users is nearly ubiquitousSocial media is transforming:Geopolitics: Tunisia, Egypt, Libya, etcUS politics: 2008 election, and soon the 2012 electionRetail: GroupOn visitation is up 250% versus last yearMarketing: Facebook is the single largest server of display inventory on the webConsumer behavior: Social media accounts for 18% of all time spent online
  • 47.
    Total Minutes onSocial Media sites has increased 38% year over yearQ: How many minutes do internet users spend on Social Media sites?comScore Media Metrix, June 2011 (Panel Only Data)A: 73 Billion
  • 48.
    Social Media sitesdraw more visitors than retail, e-mail, and news sitesQ: What percentage of internet users visit a Social Media site?A: 84.2%comScore Media Metrix, June 201 (Panel Only Data)
  • 49.
    Just how importantis social media?381minutes per user704pages per user33visits per user
  • 50.
    Facebook can delivermassive audiences, but Tumblr, LinkedIn & Twitter are growing fastest
  • 51.
    Google+ already at25 million visitors worldwide
  • 52.
    Brand pages onGoogle+ might become very important to retailersZeny Huang, Emerging Media Strategist at JWT New York4 Reasons Google+ Brand Pages will be Better than Facebook’sBetter Search OpportunitiesMore CustomizationBetter AnalyticsGoogle Can Learn from Facebook"Google+ tries to take the best from Facebook and the best from Twitter and brings it together.”Shiv SinghGlobal Head of Digital, PepsiCo
  • 53.
    Who visits SocialMedia sites? Pretty much everyone.
  • 54.
    Between September 2010and April 2011, the percentage of adults who have ‘liked’ a brand increased from 47% to 59%eMarketer Daily, June 16, 2011Nearly 6 out of 10 Facebook users over age 18 liked a brand in April 2011.
  • 55.
    Strategic challenges addressedby Social Essentials insights:Social EssentialsDetermine whether a brand is reaching it’s target consumer.Benchmarka brand’s presence on Facebook to their competitors.Compare the reach and frequencyof a brand’s Facebook presence to other media channels.Tailor marketing campaigns and partnerships to Facebookaudience’s interests and passions.
  • 56.
    Measuring engagement onFacebookSegments can be applied to any comScore analysis
  • 57.
    Newsfeed & AdExposures
  • 58.
  • 59.
  • 60.
    What we knowto be true…Facebook Fans do not translate into regular visitors to Facebook Fan Pages. Marketers need to reach out to them with relevant content!*Source: Facebook** Source: comScore
  • 61.
    Brands should focusmore on the news feed and less on the fan pageRatio of News Feed Exposures to Fan Page Views42 to 145 to 1156 to 1
  • 62.
    Brands can relatesocial impressions to the rest of their campaign
  • 63.
    Fans are heavyFacebookers
  • 64.
    Fans spend 1/3of their time on social networking sites
  • 65.
    Facebook is reachinga younger audience than the brand’s typical site visitors
  • 66.
    Fans and Friendsover index on visitation to the brand site when compared to the average Internet userStarbucks, Southwest, Bing: Lift in Website Visitation Among Fans & Friends vs. Average Internet UserSource: comScore Social Essentials, U.S., May 2011Why do friends of fans have a higher orientation toward the brand?Birds of a feather flock togetherTrusted persuasionFansFriends
  • 67.
    Across key datapoints, Bing Fans outperform the average Bing visitor
  • 68.
    For Starbucks, ExposedFans also tend to spend more than the average Internet user
  • 69.
    Some advertisers heavilyuse social media to encourage brand interactionHeineken heavily used socially enabled ads in May to encourage users to interact with its brand through FacebookKraft delivered the most socially enabled ads in May (about 166M impressions)* Ad Metrix (May 2011) US data
  • 70.
    comScoreSocial Essentials WhitepaperCasestudy on Starbucks, Southwest Airlines and BingPublished in collaboration with FacebookDemonstrates how holistic understanding of social impact can change the way brands think about, leverage and build social audiencesTo download white paper please visitwww.comscore.com/like
  • 71.
    The need toverify and measure media plan delivery and effectiveness is more important than ever
  • 72.
    Cookies are notpeople. They may have some data tied to them but they are by nature not overly accurate regarding a user’s demographics or profile.
  • 73.
    Clicks are atbest an incompleteand at worst a misleading metric
  • 74.
    Clickers Represent aSmall and Declining Segment of Internet Users Clickers fell by half between 2007 and 2009
  • 75.
    8% ofall Internet users account for 85% of all clicks
  • 76.
    Optimizing againstclicks means ignoring 84 percent of Internet usersJuly 2007March 2009Source: comScore, Inc. custom analysis, Total US Online Population, persons, July 2007 and March 2009 data periods
  • 77.
    The Meddlesome Click….“A click means nothing. A click earns no revenue and creates no brand equity. Your online advertising has some goal – and it’s surely not to generate clicks. Regardless of whether they clicked an ad or not, the key is to determine how that ad unit influenced a consumer to think, feel, or do something they wouldn’t have done otherwise.”John Lowell SVP Director, Research & Analytics Starcom
  • 78.
    But, Many Agencyand Advertisers Still Preoccupied with the Click Source: Feb 2010 Collective Survey of 420 Agency and Advertiser Executives What Metrics Do You Use To EvaluateAd Network Performance?
  • 79.
  • 80.
    3MS Initiative issuedthe following recommendationsPrinciple #1: Move to a “viewable impressions” standard.Principle #2: Online advertising must switch to currency-based on audience impressions, not gross ad impressions.Principle #3: Because all ad units are not created equal, the industry must create a better classification system.Principle #4: Determine interactivity metrics “that matter” for brand marketers, so that marketers can better evaluate digital’s contribution to brand building.Principle #5: Digital media measurement must become increasingly comparable and integrated with other media.
  • 81.
    5 Key Challengesin Digital Ad DeliveryAds are delivered but not visible to userAds appear next to objectionable contentFraud can occur in daisy chain of ad deliveryAds are delivered outside of intended targetsAds are delivered at sub-optimal frequency
  • 82.
    Cookie Deletion: Rampant& GrowingSite CookiesAd Server CookiesOne Key Result: Substantial Understatement of Individuals Reached at an Optimal Frequency Level…
  • 83.
    Does This LookFamiliar?> 50% of Campaign Audience Exposed 1XOnly Around 15% of Audience Exposed at “Ideal” Frequency Levels
  • 84.
    The Result ofProper Counting…< Half the number of uniques originally identified as “1x”Proper R/F counting illustrates a 2.5X increase in the number of individuals exposed at optimal frequency levels
  • 85.
    Because of MultipleUsers on a Computer, Cookies Can’t Always Accurately Identify who is Using a Computer at any Given Point in TimeOver 64% of home users share a home computer with other users The average number of users per machine is 2.1 Percent of People
  • 86.
    Cookie-based demo targetinglimits a campaign’s ability to selectively reach a targeted audience Target for this health & well being product was females age 35-5440% of exposed consumers outside of planned gender target15-2425-34Only 43% of females exposed to the campaign met the targeted age group35-4445-54Only 25% of all exposed consumers met planned targeting criteria

Editor's Notes

  • #12 In order to understand how the display advertising ecosystem is changing, it’s helpful to consider how it has worked in the pastTraditional display advertising has always focused on defining a target audience, but then using content as a proxy for that audience- This has been true for traditional media like TV and print and this strategy has been passed down to interactive display.-- So on one end you have brands who want to reach consumers for their goods and services and on the other end you have publishers who have audience (read: consumers). A perfect marriage.- It stands to reason that you will reach men on sites like ESPN, women on sites like iVillage, etc. This is supported by various audience measurement and planning services.(CLICK)- Many brands employ their agencies to do their online media buying and strategy for them, just as they do offline(CLICK)With the growth and fragmentation of the web came an influx of advertising networks. Their job was to herd the cats, to organize websites – or audience – into easier to buy and implement verticals. Some were broad reach like Advertising.com and ValueClick and offered proprietary optimization platforms for performance campaigns. Others were vertical-specific like Glam for women or TAN for travel ,etc.But as the number of networks grew and grew (over 300 by some estimations) it became more difficult for agencies and brands to tell them apart. Who had the best technology? How could I be sure I was getting the best CPM? Where were my ads going to show up exactly?- The same was true for publishers. And in fact the network model posed a bit of a conflict: If the network was trying to achieve the highest CPM for the publisher (in order to secure better inventory), wasn’t this at odds with the efficiencies that they were trying to achieve for the advertisers?(CLICK)Then came the birth of the exchange like Yahoo’s RightMedia and Google’s DoubleClick Ad Exchange. Since many publisher sell only 10 - 20 percent of their premium inventory, and the ability to navigate the various networks to sell their non-guaranteed inventory became more and more confusing, exchanges gave publishers the opportunity to put as much (or as little) of their unsold inventory into an auction based environment that would hopefully drive up their CPMs (much in the way it had worked for search).- Another development was the creation of Supply-Side Platforms like AdMeld, Rubicon Project and Pubmatic. These companies work solely for the publisher and provide tools to manage yield and a single interface to manage how their surplus inventory is sold.- And so the dynamic changed from many networks having direct relationships with many publishers (and creating a good deal of overlap) to those same networks now bidding on inventory across a consolidation of inventory aggregators: exchanges and SSPs.(CLICK))Publishers also came to realize (though perhaps slowly and many still do not understand the fast-changing dynamic of this part of the ecosystem!) that there was value in their user data. But most did not have the scale necessary to make buying it attractive to brands and agencies, nor did they have the technology to make it deliverable. So companies like Blue Kai and IXI developed ways to aggregate user data from various sources and make it available to advertisers to target specific audience groups across non-targeted inventory at scale.(CLICK)This then spawned another technology offering and a spate of new companies were born: The DSP or Demand Side Platform. Companies like MediaMath, Turn and Google’s Invite Media, developed sophisticated algorithms that could look at various data aggregators, could look at cookies across all exchanges and SSPs and place bids for advertisers while considering the variables of user data, inventory and pricing. In addition, they were not beholden to specific data providers or inventory aggregators.- The creation of Real Time Bidding (RTB) meant that the exchanges could push out every ad impression event as it happened to all of the DSP. The DSP then – in real time – would match the user to their database and make the appropriate bid on that auction for their advertisers. The DSPs are processing tens of thousands of Queries Per Second (QPS) and bidding with all the information available about a specific ad-serving event.(Click)The agencies and agency holding companies saw this as a natural extension to their business – particularly as they could now look holistically across all sources of user data and all sources of inventory. The ability to manage bidding at this scale created natural efficiencies (both in pricing and performance) for their brands. So the Agencies formed their own Trading Desks – some by developing proprietary technology – many more by partnering with the DSP vendors. Companies like Publicis’ Vivaki, IPG’s Cadreon, Omnicom’s Accuen, etc. provided a new business model for agencies essentially making them “In House Ad Networks”(CLICK)Not good news for the undifferentiated broad-reach ad network.Other things to mention? Private Exchanges: The formation of “Private Exchanges” where premium publishers create their own biddable collection of inventory and cut out the middle man. Many are working with Right Media for example to create specific “Linking Agreements” with specific advertisers. No need to SSP, no need for network. Publishers like it because it increases their margin. Advertisers like it because they know exactly where their ads show up. Transparency: DSPs also offer something that the networks did not: Transparency. Many “Opague” or “Blind” networks gave premium brand advertisers pause. Where would my ads show up? Where had my ads shown up?Birth of the verification companies like Double Verify, AdSafe, etc.
  • #16 Remove “Adopted by…” line if not applicable to your audience.***0911 Update: Adopted by 90% of Top U.S. Media Properties
  • #34 q17
  • #35 q17
  • #36 q17
  • #37 q17
  • #38 q17
  • #42 Launch of google plus in june
  • #48 Facebook allows 13+ but 50% of 2-11 year olds are using social networking sites
  • #83 What about where your ad was displayed?Most of the time your ad service is delivered to the web properties you’d expect…Google sites, Yahoo sites, Microsoft sites, But then there’s always the exceptions. How’d you’d like to be the brand manager on a large cereal brand and find out you ad was on: those are real websites where our ads have been, albeit in relatively small impressions. You’d better be sure it’s not your brand.