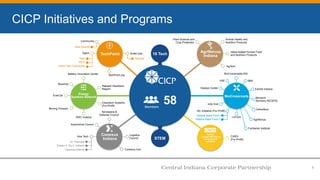
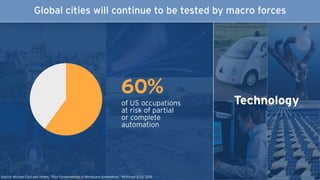
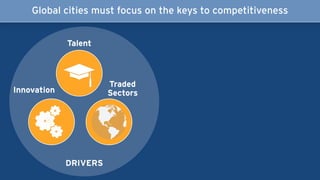
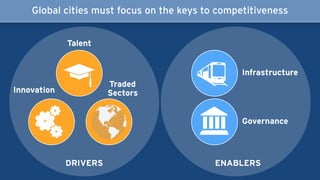
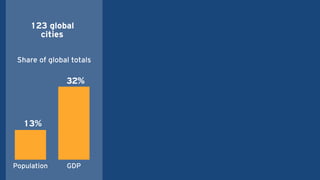
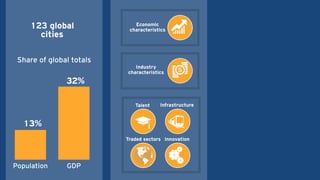
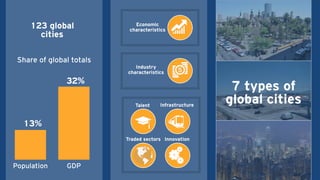
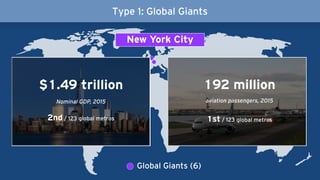
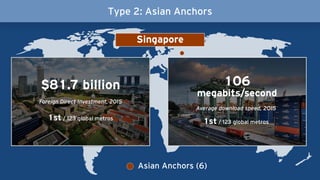
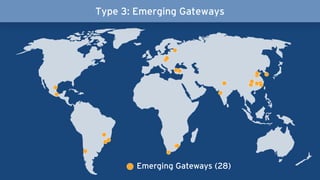
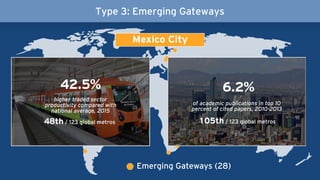
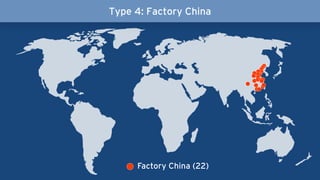
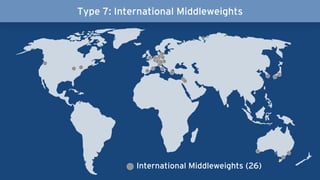
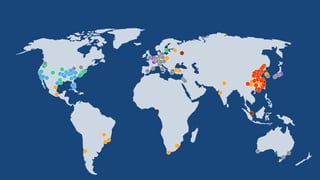
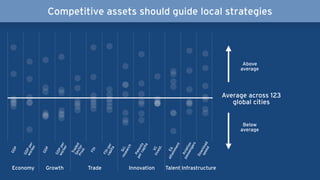
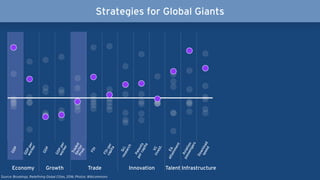
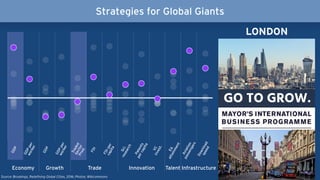
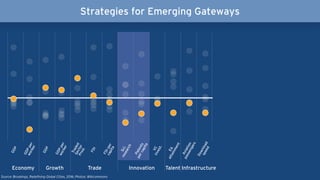
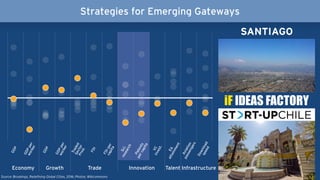
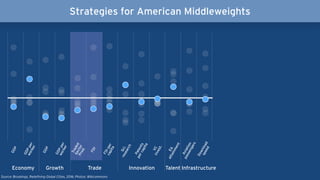
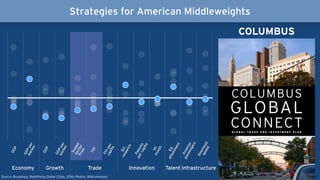
The document discusses global cities and their competitiveness. It identifies seven types of global cities based on their population, GDP, talent, traded sectors, innovation, infrastructure, industry characteristics, and economic characteristics. The first type discussed are "Global Giants," which are the largest global cities by population and GDP that play a dominant role in the global economy.
1. GLOBAL CITIES INITIATIVE
A J O I N T P R OJ ECT O F B R O O K I N GS A N D J P M O R GA N C H AS E
AMY LIU
Brookings Metropolitan Policy Program
@amy_liuw
Global Cities Summit
September 29, 2016
2. GLOBAL CITIES INITIATIVE
A J O I N T P R OJ ECT O F B R O O K I N GS A N D J P M O R GA N C H AS E
AMY LIU
Brookings Metropolitan Policy Program
Redefining Global Cities
@amy_liuw
Global Cities Summit
September 29, 2016
3. How global cities can become more competitive
3
The seven types of global cities
2
What makes a global city?
1
7. 2008
7.4
million
jobs lost
20122010
BROOKINGS | July 2010 1
Export Nation:
How U.S. Metros Lead National Export
Growth and Boost Competitiveness
Emilia Istrate, Jonathan Rothwell, and Bruce Katz
“To reset its eco-
nomic trajectory,
the United States
needs to connect
the macroeco-
nomic goal of
increasing ex-
ports with the
metropolitan
reality of export
production.”
Findings
An analysis of the location of production of U.S. exports, particularly in the nation’s 100 largest
metro areas in 2008, and between 2003 and 2008 reveals that:
n Increasing the nation’s exports holds out the potential of generating a significant number
of good-paying jobs in the United States. All told, U.S. exports supported 11.8 million jobs
nationally and 7.7 million jobs in the top 100 metro areas in 2008. These jobs amounted to
8.3 percent of the nation’s employment and 8.1 percent of all employment in the largest 100
metros in 2008. These are direct jobs in companies that sell abroad and, to some extent,
indirect jobs in firms that are part of the supply chain of exporting companies.
n The largest 100 metropolitan areas produce most of the nation’s exports. Home to
65 percent of the nation’s population, the 100 largest metropolitan areas produced an esti-
mated 64 percent of U.S. exports in 2008, including 62 percent of U.S. manufactured goods
and 75 percent of services. Export activity is highly concentrated. The 10 metropolitan areas
with the highest value of exports produced about 43 percent of all the top 100 metro areas’
exports in 2008, even though they contain just 38 percent of the population.
n Strong manufacturing and patent producing metropolitan areas generate the highest
shares of exports from their output. Manufacturing industries are the most export oriented,
so metropolitan areas that specialize in manufacturing tend to export the largest shares
of their GMP. Export-oriented metropolitan areas are also significantly more innovative, as
defined by their rate of patent production. This may be explained by existing evidence that
more innovative firms are more likely to export internationally and that activity reinforces
innovation through competition.
n Four metropolitan areas doubled the real value of their exports between 2003 and 2008.
Houston doubled exports largely through sales of chemicals, while Wichita, KS doubled exports
based on its powerful aviation cluster. Computer and electronics led the doubling of Portland’s
exports. New Orleans also doubled the value of its exports over the period, driven largely by
oil refining.
n Export intensive industries pay higher wages than domestic oriented industries in large
metropolitan areas. In an analysis of the 94 of the largest 100 metropolitan areas, for every
$1 billion in exports of a metro area industry, workers in that industry earn roughly 1 to 2 per-
cent higher wages. Even those exporting industry workers without high school diplomas earn
a higher wage. This wage effect can be seen even adjusting for worker characteristics, occupa-
tion, or the characteristics of the metropolitan area.
n Future export growth will come increasingly from large emerging markets. Though
Canada and Mexico are the nation’s two largest trading partners, U.S. exports to Brazil, India,
and China (the so-called BIC countries) have been increasing rapidly during the last decade,
doubling in size between 2003 and 2008. The BIC countries are expected to account for
about a fifth of the global gross domestic product in 2010, surpassing the United States for
the first time. The metropolitan areas that produce the largest U.S. exports to the BICs are
well-positioned to take advantage of the growth of these countries.
To reset its economic trajectory, the United States needs to connect the macroeconomic goal of
increasing exports with the metropolitan reality of export production. Public and private sector
leaders at the metro level need to collaborate and engage actively to leverage already extant
export concentrations to create good paying jobs at home.
Export Nation:
How U.S. cities can lead
national export growth
8. 2008
7.4
million
jobs lost
20122010
T E N S T E P S
T O D E L I V E R I N G
A S U C C E S S F U L
M E T R OE X P O R T P L A N
BROOKINGS | July 2010 1
Export Nation:
How U.S. Metros Lead National Export
Growth and Boost Competitiveness
Emilia Istrate, Jonathan Rothwell, and Bruce Katz
“To reset its eco-
nomic trajectory,
the United States
needs to connect
the macroeco-
nomic goal of
increasing ex-
ports with the
metropolitan
reality of export
production.”
Findings
An analysis of the location of production of U.S. exports, particularly in the nation’s 100 largest
metro areas in 2008, and between 2003 and 2008 reveals that:
n Increasing the nation’s exports holds out the potential of generating a significant number
of good-paying jobs in the United States. All told, U.S. exports supported 11.8 million jobs
nationally and 7.7 million jobs in the top 100 metro areas in 2008. These jobs amounted to
8.3 percent of the nation’s employment and 8.1 percent of all employment in the largest 100
metros in 2008. These are direct jobs in companies that sell abroad and, to some extent,
indirect jobs in firms that are part of the supply chain of exporting companies.
n The largest 100 metropolitan areas produce most of the nation’s exports. Home to
65 percent of the nation’s population, the 100 largest metropolitan areas produced an esti-
mated 64 percent of U.S. exports in 2008, including 62 percent of U.S. manufactured goods
and 75 percent of services. Export activity is highly concentrated. The 10 metropolitan areas
with the highest value of exports produced about 43 percent of all the top 100 metro areas’
exports in 2008, even though they contain just 38 percent of the population.
n Strong manufacturing and patent producing metropolitan areas generate the highest
shares of exports from their output. Manufacturing industries are the most export oriented,
so metropolitan areas that specialize in manufacturing tend to export the largest shares
of their GMP. Export-oriented metropolitan areas are also significantly more innovative, as
defined by their rate of patent production. This may be explained by existing evidence that
more innovative firms are more likely to export internationally and that activity reinforces
innovation through competition.
n Four metropolitan areas doubled the real value of their exports between 2003 and 2008.
Houston doubled exports largely through sales of chemicals, while Wichita, KS doubled exports
based on its powerful aviation cluster. Computer and electronics led the doubling of Portland’s
exports. New Orleans also doubled the value of its exports over the period, driven largely by
oil refining.
n Export intensive industries pay higher wages than domestic oriented industries in large
metropolitan areas. In an analysis of the 94 of the largest 100 metropolitan areas, for every
$1 billion in exports of a metro area industry, workers in that industry earn roughly 1 to 2 per-
cent higher wages. Even those exporting industry workers without high school diplomas earn
a higher wage. This wage effect can be seen even adjusting for worker characteristics, occupa-
tion, or the characteristics of the metropolitan area.
n Future export growth will come increasingly from large emerging markets. Though
Canada and Mexico are the nation’s two largest trading partners, U.S. exports to Brazil, India,
and China (the so-called BIC countries) have been increasing rapidly during the last decade,
doubling in size between 2003 and 2008. The BIC countries are expected to account for
about a fifth of the global gross domestic product in 2010, surpassing the United States for
the first time. The metropolitan areas that produce the largest U.S. exports to the BICs are
well-positioned to take advantage of the growth of these countries.
To reset its economic trajectory, the United States needs to connect the macroeconomic goal of
increasing exports with the metropolitan reality of export production. Public and private sector
leaders at the metro level need to collaborate and engage actively to leverage already extant
export concentrations to create good paying jobs at home.
Export Nation:
How U.S. cities can lead
national export growth
9. 2008
7.4
million
jobs lost
20122010
GLOBAL CITIES INITIATIVE
AJoint Project of Brookings and JPMorgan Chase
T E N S T E P S
T O D E L I V E R I N G
A S U C C E S S F U L
M E T R OE X P O R T P L A N
BROOKINGS | July 2010 1
Export Nation:
How U.S. Metros Lead National Export
Growth and Boost Competitiveness
Emilia Istrate, Jonathan Rothwell, and Bruce Katz
“To reset its eco-
nomic trajectory,
the United States
needs to connect
the macroeco-
nomic goal of
increasing ex-
ports with the
metropolitan
reality of export
production.”
Findings
An analysis of the location of production of U.S. exports, particularly in the nation’s 100 largest
metro areas in 2008, and between 2003 and 2008 reveals that:
n Increasing the nation’s exports holds out the potential of generating a significant number
of good-paying jobs in the United States. All told, U.S. exports supported 11.8 million jobs
nationally and 7.7 million jobs in the top 100 metro areas in 2008. These jobs amounted to
8.3 percent of the nation’s employment and 8.1 percent of all employment in the largest 100
metros in 2008. These are direct jobs in companies that sell abroad and, to some extent,
indirect jobs in firms that are part of the supply chain of exporting companies.
n The largest 100 metropolitan areas produce most of the nation’s exports. Home to
65 percent of the nation’s population, the 100 largest metropolitan areas produced an esti-
mated 64 percent of U.S. exports in 2008, including 62 percent of U.S. manufactured goods
and 75 percent of services. Export activity is highly concentrated. The 10 metropolitan areas
with the highest value of exports produced about 43 percent of all the top 100 metro areas’
exports in 2008, even though they contain just 38 percent of the population.
n Strong manufacturing and patent producing metropolitan areas generate the highest
shares of exports from their output. Manufacturing industries are the most export oriented,
so metropolitan areas that specialize in manufacturing tend to export the largest shares
of their GMP. Export-oriented metropolitan areas are also significantly more innovative, as
defined by their rate of patent production. This may be explained by existing evidence that
more innovative firms are more likely to export internationally and that activity reinforces
innovation through competition.
n Four metropolitan areas doubled the real value of their exports between 2003 and 2008.
Houston doubled exports largely through sales of chemicals, while Wichita, KS doubled exports
based on its powerful aviation cluster. Computer and electronics led the doubling of Portland’s
exports. New Orleans also doubled the value of its exports over the period, driven largely by
oil refining.
n Export intensive industries pay higher wages than domestic oriented industries in large
metropolitan areas. In an analysis of the 94 of the largest 100 metropolitan areas, for every
$1 billion in exports of a metro area industry, workers in that industry earn roughly 1 to 2 per-
cent higher wages. Even those exporting industry workers without high school diplomas earn
a higher wage. This wage effect can be seen even adjusting for worker characteristics, occupa-
tion, or the characteristics of the metropolitan area.
n Future export growth will come increasingly from large emerging markets. Though
Canada and Mexico are the nation’s two largest trading partners, U.S. exports to Brazil, India,
and China (the so-called BIC countries) have been increasing rapidly during the last decade,
doubling in size between 2003 and 2008. The BIC countries are expected to account for
about a fifth of the global gross domestic product in 2010, surpassing the United States for
the first time. The metropolitan areas that produce the largest U.S. exports to the BICs are
well-positioned to take advantage of the growth of these countries.
To reset its economic trajectory, the United States needs to connect the macroeconomic goal of
increasing exports with the metropolitan reality of export production. Public and private sector
leaders at the metro level need to collaborate and engage actively to leverage already extant
export concentrations to create good paying jobs at home.
Export Nation:
How U.S. cities can lead
national export growth
10. Over the past five years, the Global Cities network has grown
GLOBAL CITIES INITIATIVE
AJoint Project of Brookings and JPMorgan Chase
11. During this time, economic growth has been uneven
+6.3%
Jobs,
2009-2014
+3.6%
Productivity
2009-2014
-5.0%
Median wage,
2009-2014
Source: Brookings, Metro Monitor, January 2016
JOBS WAGESPRODUCTIVITY
15. Urbanization
30%
of the developing world’s urban residents
880 million
people in the developing world live in slums
Source: 2015 Habitat GUO estimates
Global cities will continue to be tested by macro forces
16. Globalization
Source: James Manyika and others, “Digital globalization,” McKinsey, 2016
Global cities will continue to be tested by macro forces
1980
$3 trillion
$30 trillion
20142000
$12 trillion
39%
of global
GDP
17. Globalization
Source: James Manyika and others, “Digital globalization,” McKinsey, 2016 Source: David Autor et al., “The China Shock,” 2016
jobs lost in the U.S. due to
import competition from
China, 1999-2011
2.4
million
Global cities will continue to be tested by macro forces
1980
$3 trillion
$30 trillion
20142000
$12 trillion
39%
of global
GDP
18. Technology
Source: James Manyika and others, “Disruptive technologies,” McKinsey & Co., 2013
$33trillion
/YEAR
Estimated impact of 12
technology platforms on the
global economy
Global cities will continue to be tested by macro forces
19. Technology
Source: Michael Chui and others, “Four Fundamentals of Workplace Automation,” McKinsey & Co. 2015.
of US occupations
at risk of partial
or complete
automation
60%
Global cities will continue to be tested by macro forces
27. 7 types of
global citiesTalent
Traded sectors Innovation
Infrastructure
Industry
characteristics
Economic
characteristics
Population GDP
13%
32%
123 global
cities
Share of global totals
29. Type 1: Global Giants
Global Giants (6)
New York City
$1.49 trillion
2nd / 123 global metros
Nominal GDP, 2015
192 million
aviation passengers, 2015
1st / 123 global metros
31. Asian Anchors (6)
Type 2: Asian Anchors
$81.7 billion
1st / 123 global metros
Foreign Direct Investment, 2015
106
megabits/second
Average download speed, 2015
1st / 123 global metros
Singapore
33. Emerging Gateways (28)
Type 3: Emerging Gateways
42.5%
48th / 123 global metros
higher traded sector
productivity compared with
national average, 2015
6.2%
105th / 123 global metros
of academic publications in top 10
percent of cited papers, 2010-2013
Mexico City
35. Type 4: Factory China
Factory China (22)
+14.7%
1st / 123 global cities
Annual GDP growth, 2000-2015
12.2%
of adult population holds a
college degree
100th / 123 global cities
Hefei
37. Type 5: Knowledge Capitals
Knowledge Capitals (19)
$131,073
11th / 123 global cities
GDP per worker, 2015
5.19 patents
per thousand persons, 2012
2nd / 123 global cities
San Diego
39. Type 6: American Middleweights
American Middleweights (16)
5.4%
109th / 123 global cities
lower traded sector
productivity compared with
national average, 2015
14.1%
of academic publications in top 10
percent of cited papers, 2010-2013
42nd / 123 global cities
Indianapolis
41. Type 7: International Middleweights
International Middleweights (26)
$3,403
8th / 123 global cities
FDI investment per capita,
2015
1.2%
GDP growth, 2000-2015
106th / 123 global cities
Barcelona
42.
43. All cities are global
Cities play distinct roles in the global economy
The work to engage globally is ongoing
Takeaways from Redefining Global Cities
44. How global cities can become more competitive
3
The seven types of global cities
2
What makes a global city?
1
46. Competitive assets should guide local strategies
Economy Growth Trade Innovation Talent Infrastructure
TradedSectorProd.
FDI
FDIper
capita
Ed.
attainment
Download
speed
Aviation
passengers
GDP
GDPper
worker
GDP
GDPper
worker
Sci.research
VCinvest.
Patents
percapita
Average across 123
global cities
Above
average
Below
average
47. Economy Growth Trade Innovation Talent Infrastructure
Download
speed
FDI
FDIper
capita
Sci.research
VCinvest.
Ed.
attainment
Aviation
passengers
GDP
GDPper
worker
GDP
GDPper
worker
Patents
percapita
Source: Brookings, Redefining Global Cities, 2016; Photos: Wikicommons
Strategies for Global Giants
TradedSectorProd.
48. Economy Growth Trade Innovation Talent Infrastructure
Download
speed
FDI
FDIper
capita
Sci.research
VCinvest.
Ed.
attainment
Aviation
passengers
GDP
GDPper
worker
GDP
GDPper
worker
Patents
percapita
Source: Brookings, Redefining Global Cities, 2016; Photos: Wikicommons
Strategies for Global Giants
TradedSectorProd.
LONDON
49. Strategies for Emerging Gateways
Economy Growth Trade Innovation Talent Infrastructure
Download
speed
FDI
FDIper
capita
Sci.research
VCinvest.
Ed.
attainment
Aviation
passengers
GDP
GDPper
worker
GDP
GDPper
worker
Patents
percapita
TradedSectorProd.
Source: Brookings, Redefining Global Cities, 2016; Photos: Wikicommons
50. Strategies for Emerging Gateways
Economy Growth Trade Innovation Talent Infrastructure
Download
speed
FDI
FDIper
capita
Sci.research
VCinvest.
Ed.
attainment
Aviation
passengers
GDP
GDPper
worker
GDP
GDPper
worker
Patents
percapita
TradedSectorProd.
Source: Brookings, Redefining Global Cities, 2016; Photos: Wikicommons
iF IDEAS FACTORY
SANTIAGO
51. Strategies for American Middleweights
Economy Growth Trade Innovation Talent Infrastructure
Download
speed
FDI
FDIper
capita
Sci.research
VCinvest.
Ed.
attainment
Aviation
passengers
GDP
GDPper
worker
GDP
GDPper
worker
Patents
percapita
TradedSectorProd.
Source: Brookings, Redefining Global Cities, 2016; Photos: Wikicommons
52. Strategies for American Middleweights
Economy Growth Trade Innovation Talent Infrastructure
Download
speed
FDI
FDIper
capita
Sci.research
VCinvest.
Ed.
attainment
Aviation
passengers
GDP
GDPper
worker
GDP
GDPper
worker
Patents
percapita
TradedSectorProd.
Source: Brookings, Redefining Global Cities, 2016; Photos: Wikicommons
COLUMBUS
53. “The problem [is] not globalization, but how
the process [is] being managed.”
- Joseph Stiglitz
Source: “Globalization and its New Discontents,” Project Syndicate, August 2016
54. GLOBAL CITIES INITIATIVE
A J O I N T P R OJ ECT O F B R O O K I N GS A N D J P M O R GA N C H AS E
AMY LIU
Brookings Metropolitan Policy Program
@amy_liuw
Global Cities Summit
September 29, 2016
55. OrthoWorx
AgriNovus
Fairbanks Institute
Indiana Seed Fund I
Indiana Seed Fund II
CICP Initiatives and Programs
1
AgriNovus
Indiana
BioCrossroads
Central
Indiana Workforce
Development
Initiative
Energy
Systems Network
Conexus
Indiana
TechPoint
Animal Health and
Nutrition Products
Value-Added Human Food
and Nutrition Products
Plant Science and
Crop Protection
BioCrossroadsLINX
IHIE
Datalys Center
I-STEM
Indy Hub
IBRI
Exhibit Indiana
Monarch
(formerly INCAPS)
AgTech
Aerospace &
Defense Council
Automotive Council
Logistics
Council
Conexus Icon
Hire Tech
A+ Partners
Dream it. Do it. Indiana
Conexus Interns
Battery Innovation Center
BlueIndy
EverCar
Moving Forward
Mira Awards
16 Tech
STEM
Talent
Xpat
Xtern
IndyX Tech Fellowship
TechPoint.org
Scale-Ups
Tailwind
Community
58Members
Wabash Heartland
Region
Cleantech Systems
(For-Profit)
SWC Indiana
BC Initiative (For-Profit)
CIWDI
(For-Profit)