Download to read offline


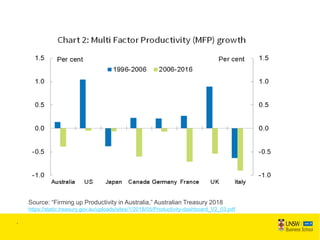
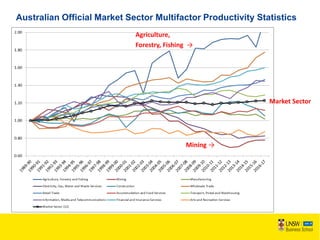
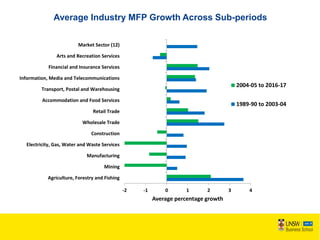
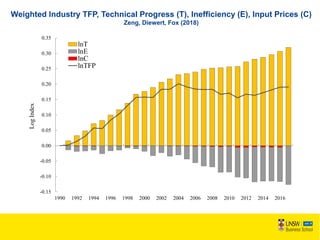

This document discusses the productivity slowdown in Australia and potential explanations. It provides data showing that average productivity growth has declined across most industries from 2004-2016 compared to 1989-2003. While mismeasurement may contribute, the evidence suggests it does not fully explain the slowdown. The document identifies several areas for further understanding the slowdown, including better measuring new goods, valuing free digital services, improved time-use data, and leveraging firm-level data through linking techniques.


