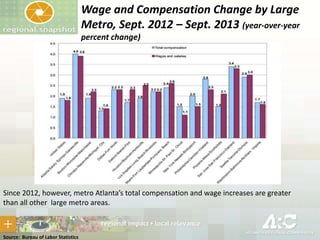
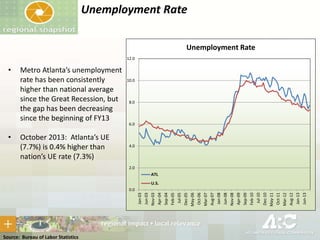
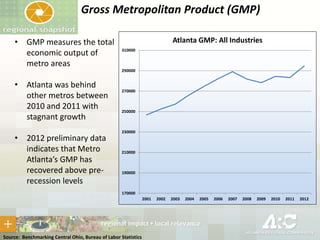
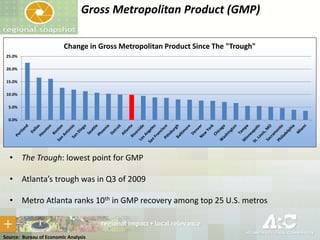
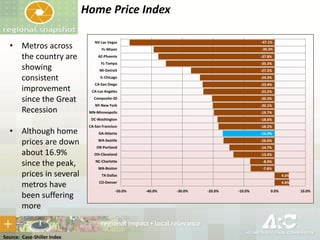
Plan 2040 Goal:
Economic Recovery and
Prosperity
Atlanta Regional Commission
For more information contact:
mcarnathan@atlantaregional.com
Plan 2040 Indicators:
www.atlantaregional.com/scorecard
Plan 2040 Indicators:
www.atlantaregional.com/scorecard
Is Our Economy Diverse Enough To Compete
Globally?
• Atlanta is no longer simply competing with other cities
in the Southeast or the nation

• Global business leaders see Atlanta with international
competitiveness
• Metro Atlanta’s economy must continue to leverage its
assets to stay relevant and thrive in this global context
• Key determinants explored here include exports,
innovation, competitiveness, employment, Gross
Metropolitan Product (GMP), and home price
Source: OnTheMap Program, U.S. Census Bureau
Exports
• Metro areas that seize
opportunities in new
markets will help boost the
country’s economic
competitiveness and create
jobs locally
• The value of metro Atlanta’s
exports has risen by 45%
since 2005
• While this is undeniably good, other research suggests that metro Atlanta
lags behind other large metro areas in overall export activity

• As a share of the Atlanta region’s total metro GDP, only 8% is attributable to
exports as of 2010, which ranks metro Atlanta 77th out of the 100 largest
metros in the country.
Source: International Trade Administration , Brookings Institution “Export Nation 2012”
Patents
Metro Atlanta: Percent of All Patents
in 99 Large Metro Areas
2.00%
1.90%
1.80%

• Patents are a good way to
measure economic progress
by indicating new knowledge
and new innovations
• Metro Atlanta has increased
its share of all patents
developed in the 99 largest
metro areas, from about 1.5
percent of all patents in 2000
to 1.9 percent by 2011

1.70%
1.60%
1.50%
1.40%
1.30%
2000 2001 2002 2003 2004 2005 2006 2007 2008 2009 2010 2011

Source: U.S. Patent and Trademark Office
Patents
Patents per 10,000 population, 2010: Top
25 Metros
16.00

14.00

12.00

• Metro Atlanta has taken on
an increased role in
innovation since 2000, but
still ranks fairly low overall
• Atlanta ranks 16th out of the
top 25 largest U.S. metros on
patents per 10,000 people

10.00

8.00

6.00

4.00

2.00

San Francisco
Seattle
San Diego
Boston
Minneapolis
Portland
Detroit
Los Angeles
Houston
Philadelphia
Dallas
New York
Phoenix
Pittsburgh
Washington
Atlanta
Chicago
Denver
Baltimore
St. Louis, MO
Sacramento
Miami
Tampa
San Antonio
Riverside

0.00

Source: U.S. Patent and Trademark Office
Concentration of jobs in key sectors
•

Metro Atlanta a leader nationally in
“knowledge” and logistics jobs

Location Quotient by Year:
Logistics Hub
1.6

• “Knowledge” jobs include IT,
telecom, corporate and regional HQ,
professional services and corporate
and customer support operations.
They are among the highest paying
jobs in the region.
• Logistics jobs include supply chain
management, transportation
services, warehousing and storage
and wholesale trade.

1.55
1.5
1.45
1.4
1.35
1.3
2002 2003 2004 2005 2006 2007 2008 2009 2010 2011 2012

Location Quotient by Year: Knowledge Hub
1.6
1.55
1.5
1.45

Values larger than 1 mean metro Atlanta has
higher concentration than nation as a whole

1.4
1.35
1.3
2002 2003 2004 2005 2006 2007 2008 2009 2010 2011 2012

Source: Bureau of Labor Statistics
Employment Change, August 2008 – August
2013 (year-over-year percent change)

•

During the Great Recession, metro Atlanta’s employment gains lagged those of the
nation’s gains.

• For the past year, however, metro Atlanta’s job market has been outperforming that of
the nation’s on a year-over-year percent change basis.

Source: Bureau of Labor Statistics
Employment Change by Industry, August
2012 – August 2013 (year-over-year percent change)

In looking at job gains by sector, metro Atlanta is outpacing the nation in jobs added in
Construction and Information, which are critical sectors for metro Atlanta.

Source: Bureau of Labor Statistics
Employment Change by Large Metro, August
2012 – August 2013 (year-over-year percent change)

Nationally, metro Atlanta ranks fourth in the percent change in the number of jobs added
over the past year (August 2012 – August 2013).

Source: Bureau of Labor Statistics
Employment Change Since Recession,
December 2007 – July 2013 (year-over-year percent
change)

Despite impressive gains recently, there is still a little more work to do to get back to
pre-recession levels

Source: Bureau of Labor Statistics
Average Annual Wage Increases, 2000 - 2011
(in 2011 dollars)

In many ways, metro Atlanta’s economic struggles began before the official beginning of
the Great Recession. Wage increases lagged behind the national average for much of the
2000 decade.

Source: Bureau of Economic Analysis, CA34
Wage and Compensation Change by Large
Metro, Sept. 2012 – Sept. 2013 (year-over-year
percent change)

Since 2012, however, metro Atlanta’s total compensation and wage increases are greater
than all other large metro areas.

Source: Bureau of Labor Statistics
Unemployment Rate
Unemployment Rate
12.0

•

•

Metro Atlanta’s unemployment
rate has been consistently
higher than national average
since the Great Recession, but
the gap has been decreasing
since the beginning of FY13
October 2013: Atlanta’s UE
(7.7%) is 0.4% higher than
nation’s UE rate (7.3%)

10.0

8.0

6.0

4.0

2.0

ATL
U.S.
Jan-03
Jun-03
Nov-03
Apr-04
Sep-04
Feb-05
Jul-05
Dec-05
May-06
Oct-06
Mar-07
Aug-07
Jan-08
Jun-08
Nov-08
Apr-09
Sep-09
Feb-10
Jul-10
Dec-10
May-11
Oct-11
Mar-12
Aug-12
Jan-13
Jun-13

0.0

Source: Bureau of Labor Statistics
Gross Metropolitan Product (GMP)
• GMP measures the total
economic output of
metro areas

Atlanta GMP: All Industries
310000

290000

• Atlanta was behind
other metros between
2010 and 2011 with
stagnant growth
• 2012 preliminary data
indicates that Metro
Atlanta’s GMP has
recovered above prerecession levels

270000

250000

230000

210000

190000

170000
2001

Source: Benchmarking Central Ohio, Bureau of Labor Statistics

2002

2003

2004

2005

2006

2007

2008

2009

2010

2011

2012
Gross Metropolitan Product (GMP)
Change in Gross Metropolitan Product Since The "Trough"
25.0%
20.0%
15.0%
10.0%
5.0%
0.0%

• The Trough: lowest point for GMP
• Atlanta’s trough was in Q3 of 2009
• Metro Atlanta ranks 10th in GMP recovery among top 25 U.S. metros

Source: Bureau of Economic Analysis
Home Price Index
Case Shiller's Home Price Index (January 2000=100)

140
130
120
110
100
90

Jul-13

Jan-13

Jul-12

Jan-12

Jul-11

Jan-11

Jul-10

Jan-10

Jul-09

Jan-09

Jul-08

Jan-08

Jul-07

Jan-07

Jul-06

Jan-06

Jul-05

Jan-05

Jul-04

Jan-04

Jul-03

Jan-03

Jul-02

Jan-02

Jul-01

Jan-01

Jul-00

Jan-00

80

• Metro Atlanta is one of the national leaders in home price gains on a year-overyear basis
• Prices are down 16.9 percent when compared to peak prices (July 2007), but are
up over 13 percent when compared to 2000

Source: Case-Shiller Index
Home Price Index
• Metros across
the country are
showing
consistent
improvement
since the Great
Recession

Source: Case-Shiller Index

-47.1%

FL-Miami

-39.3%

AZ-Phoenix

-37.8%

FL-Tampa

-35.3%

MI-Detroit

-27.2%

IL-Chicago

-24.3%

CA-San Diego

-23.4%

CA-Los Angeles

-23.2%

Composite-20

-20.3%

NY-New York

-20.1%

MN-Minneapolis

-19.7%

DC-Washington

• Although home
prices are down
about 16.9%
since the peak,
prices in several
metros have
been suffering
more

NV-Las Vegas

-18.6%

CA-San Francisco

-18.2%

GA-Atlanta

-16.9%

WA-Seattle

-16.6%

OR-Portland

-14.7%

OH-Cleveland

-13.4%

NC-Charlotte

-8.0%

MA-Boston

-7.8%

TX-Dallas

4.6%

CO-Denver

4.8%

-50.0%

-40.0%

-30.0%

-20.0%

-10.0%

0.0%

10.0%
Summary
• Atlanta is improving in exports, but is slightly lagging in terms of national
average
• Atlanta’s share of patents is increasing, but far from the nation’s patent
leaders
• Knowledge and Logistics job sectors are above the national average
• The unemployment rate has not yet moderated to pre-recession levels, and
metro Atlanta's rate remains above the national unemployment rate
• Metro Atlanta's recovery from the lowest point (in Q3, 2009) in Gross
Metropolitan Product (GMP) ranks 10th among the top 25 U.S. metros
• Metro Atlanta is among the nation's leaders in recent home price gains as
noted in the Case-Shiller Index
Plan 2040 Goal:
Economic Recovery and
Prosperity
Atlanta Regional Commission
For more information contact:
mcarnathan@atlantaregional.com

Plan 2040 Goals: Growing a Vibrant Economy in Metro Atlanta

  • 1.
    Plan 2040 Goal: EconomicRecovery and Prosperity Atlanta Regional Commission For more information contact: mcarnathan@atlantaregional.com
  • 2.
  • 3.
  • 4.
    Is Our EconomyDiverse Enough To Compete Globally? • Atlanta is no longer simply competing with other cities in the Southeast or the nation • Global business leaders see Atlanta with international competitiveness • Metro Atlanta’s economy must continue to leverage its assets to stay relevant and thrive in this global context • Key determinants explored here include exports, innovation, competitiveness, employment, Gross Metropolitan Product (GMP), and home price Source: OnTheMap Program, U.S. Census Bureau
  • 5.
    Exports • Metro areasthat seize opportunities in new markets will help boost the country’s economic competitiveness and create jobs locally • The value of metro Atlanta’s exports has risen by 45% since 2005 • While this is undeniably good, other research suggests that metro Atlanta lags behind other large metro areas in overall export activity • As a share of the Atlanta region’s total metro GDP, only 8% is attributable to exports as of 2010, which ranks metro Atlanta 77th out of the 100 largest metros in the country. Source: International Trade Administration , Brookings Institution “Export Nation 2012”
  • 7.
    Patents Metro Atlanta: Percentof All Patents in 99 Large Metro Areas 2.00% 1.90% 1.80% • Patents are a good way to measure economic progress by indicating new knowledge and new innovations • Metro Atlanta has increased its share of all patents developed in the 99 largest metro areas, from about 1.5 percent of all patents in 2000 to 1.9 percent by 2011 1.70% 1.60% 1.50% 1.40% 1.30% 2000 2001 2002 2003 2004 2005 2006 2007 2008 2009 2010 2011 Source: U.S. Patent and Trademark Office
  • 8.
    Patents Patents per 10,000population, 2010: Top 25 Metros 16.00 14.00 12.00 • Metro Atlanta has taken on an increased role in innovation since 2000, but still ranks fairly low overall • Atlanta ranks 16th out of the top 25 largest U.S. metros on patents per 10,000 people 10.00 8.00 6.00 4.00 2.00 San Francisco Seattle San Diego Boston Minneapolis Portland Detroit Los Angeles Houston Philadelphia Dallas New York Phoenix Pittsburgh Washington Atlanta Chicago Denver Baltimore St. Louis, MO Sacramento Miami Tampa San Antonio Riverside 0.00 Source: U.S. Patent and Trademark Office
  • 9.
    Concentration of jobsin key sectors • Metro Atlanta a leader nationally in “knowledge” and logistics jobs Location Quotient by Year: Logistics Hub 1.6 • “Knowledge” jobs include IT, telecom, corporate and regional HQ, professional services and corporate and customer support operations. They are among the highest paying jobs in the region. • Logistics jobs include supply chain management, transportation services, warehousing and storage and wholesale trade. 1.55 1.5 1.45 1.4 1.35 1.3 2002 2003 2004 2005 2006 2007 2008 2009 2010 2011 2012 Location Quotient by Year: Knowledge Hub 1.6 1.55 1.5 1.45 Values larger than 1 mean metro Atlanta has higher concentration than nation as a whole 1.4 1.35 1.3 2002 2003 2004 2005 2006 2007 2008 2009 2010 2011 2012 Source: Bureau of Labor Statistics
  • 10.
    Employment Change, August2008 – August 2013 (year-over-year percent change) • During the Great Recession, metro Atlanta’s employment gains lagged those of the nation’s gains. • For the past year, however, metro Atlanta’s job market has been outperforming that of the nation’s on a year-over-year percent change basis. Source: Bureau of Labor Statistics
  • 11.
    Employment Change byIndustry, August 2012 – August 2013 (year-over-year percent change) In looking at job gains by sector, metro Atlanta is outpacing the nation in jobs added in Construction and Information, which are critical sectors for metro Atlanta. Source: Bureau of Labor Statistics
  • 12.
    Employment Change byLarge Metro, August 2012 – August 2013 (year-over-year percent change) Nationally, metro Atlanta ranks fourth in the percent change in the number of jobs added over the past year (August 2012 – August 2013). Source: Bureau of Labor Statistics
  • 13.
    Employment Change SinceRecession, December 2007 – July 2013 (year-over-year percent change) Despite impressive gains recently, there is still a little more work to do to get back to pre-recession levels Source: Bureau of Labor Statistics
  • 14.
    Average Annual WageIncreases, 2000 - 2011 (in 2011 dollars) In many ways, metro Atlanta’s economic struggles began before the official beginning of the Great Recession. Wage increases lagged behind the national average for much of the 2000 decade. Source: Bureau of Economic Analysis, CA34
  • 15.
    Wage and CompensationChange by Large Metro, Sept. 2012 – Sept. 2013 (year-over-year percent change) Since 2012, however, metro Atlanta’s total compensation and wage increases are greater than all other large metro areas. Source: Bureau of Labor Statistics
  • 16.
    Unemployment Rate Unemployment Rate 12.0 • • MetroAtlanta’s unemployment rate has been consistently higher than national average since the Great Recession, but the gap has been decreasing since the beginning of FY13 October 2013: Atlanta’s UE (7.7%) is 0.4% higher than nation’s UE rate (7.3%) 10.0 8.0 6.0 4.0 2.0 ATL U.S. Jan-03 Jun-03 Nov-03 Apr-04 Sep-04 Feb-05 Jul-05 Dec-05 May-06 Oct-06 Mar-07 Aug-07 Jan-08 Jun-08 Nov-08 Apr-09 Sep-09 Feb-10 Jul-10 Dec-10 May-11 Oct-11 Mar-12 Aug-12 Jan-13 Jun-13 0.0 Source: Bureau of Labor Statistics
  • 17.
    Gross Metropolitan Product(GMP) • GMP measures the total economic output of metro areas Atlanta GMP: All Industries 310000 290000 • Atlanta was behind other metros between 2010 and 2011 with stagnant growth • 2012 preliminary data indicates that Metro Atlanta’s GMP has recovered above prerecession levels 270000 250000 230000 210000 190000 170000 2001 Source: Benchmarking Central Ohio, Bureau of Labor Statistics 2002 2003 2004 2005 2006 2007 2008 2009 2010 2011 2012
  • 18.
    Gross Metropolitan Product(GMP) Change in Gross Metropolitan Product Since The "Trough" 25.0% 20.0% 15.0% 10.0% 5.0% 0.0% • The Trough: lowest point for GMP • Atlanta’s trough was in Q3 of 2009 • Metro Atlanta ranks 10th in GMP recovery among top 25 U.S. metros Source: Bureau of Economic Analysis
  • 19.
    Home Price Index CaseShiller's Home Price Index (January 2000=100) 140 130 120 110 100 90 Jul-13 Jan-13 Jul-12 Jan-12 Jul-11 Jan-11 Jul-10 Jan-10 Jul-09 Jan-09 Jul-08 Jan-08 Jul-07 Jan-07 Jul-06 Jan-06 Jul-05 Jan-05 Jul-04 Jan-04 Jul-03 Jan-03 Jul-02 Jan-02 Jul-01 Jan-01 Jul-00 Jan-00 80 • Metro Atlanta is one of the national leaders in home price gains on a year-overyear basis • Prices are down 16.9 percent when compared to peak prices (July 2007), but are up over 13 percent when compared to 2000 Source: Case-Shiller Index
  • 20.
    Home Price Index •Metros across the country are showing consistent improvement since the Great Recession Source: Case-Shiller Index -47.1% FL-Miami -39.3% AZ-Phoenix -37.8% FL-Tampa -35.3% MI-Detroit -27.2% IL-Chicago -24.3% CA-San Diego -23.4% CA-Los Angeles -23.2% Composite-20 -20.3% NY-New York -20.1% MN-Minneapolis -19.7% DC-Washington • Although home prices are down about 16.9% since the peak, prices in several metros have been suffering more NV-Las Vegas -18.6% CA-San Francisco -18.2% GA-Atlanta -16.9% WA-Seattle -16.6% OR-Portland -14.7% OH-Cleveland -13.4% NC-Charlotte -8.0% MA-Boston -7.8% TX-Dallas 4.6% CO-Denver 4.8% -50.0% -40.0% -30.0% -20.0% -10.0% 0.0% 10.0%
  • 21.
    Summary • Atlanta isimproving in exports, but is slightly lagging in terms of national average • Atlanta’s share of patents is increasing, but far from the nation’s patent leaders • Knowledge and Logistics job sectors are above the national average • The unemployment rate has not yet moderated to pre-recession levels, and metro Atlanta's rate remains above the national unemployment rate • Metro Atlanta's recovery from the lowest point (in Q3, 2009) in Gross Metropolitan Product (GMP) ranks 10th among the top 25 U.S. metros • Metro Atlanta is among the nation's leaders in recent home price gains as noted in the Case-Shiller Index
  • 22.
    Plan 2040 Goal: EconomicRecovery and Prosperity Atlanta Regional Commission For more information contact: mcarnathan@atlantaregional.com