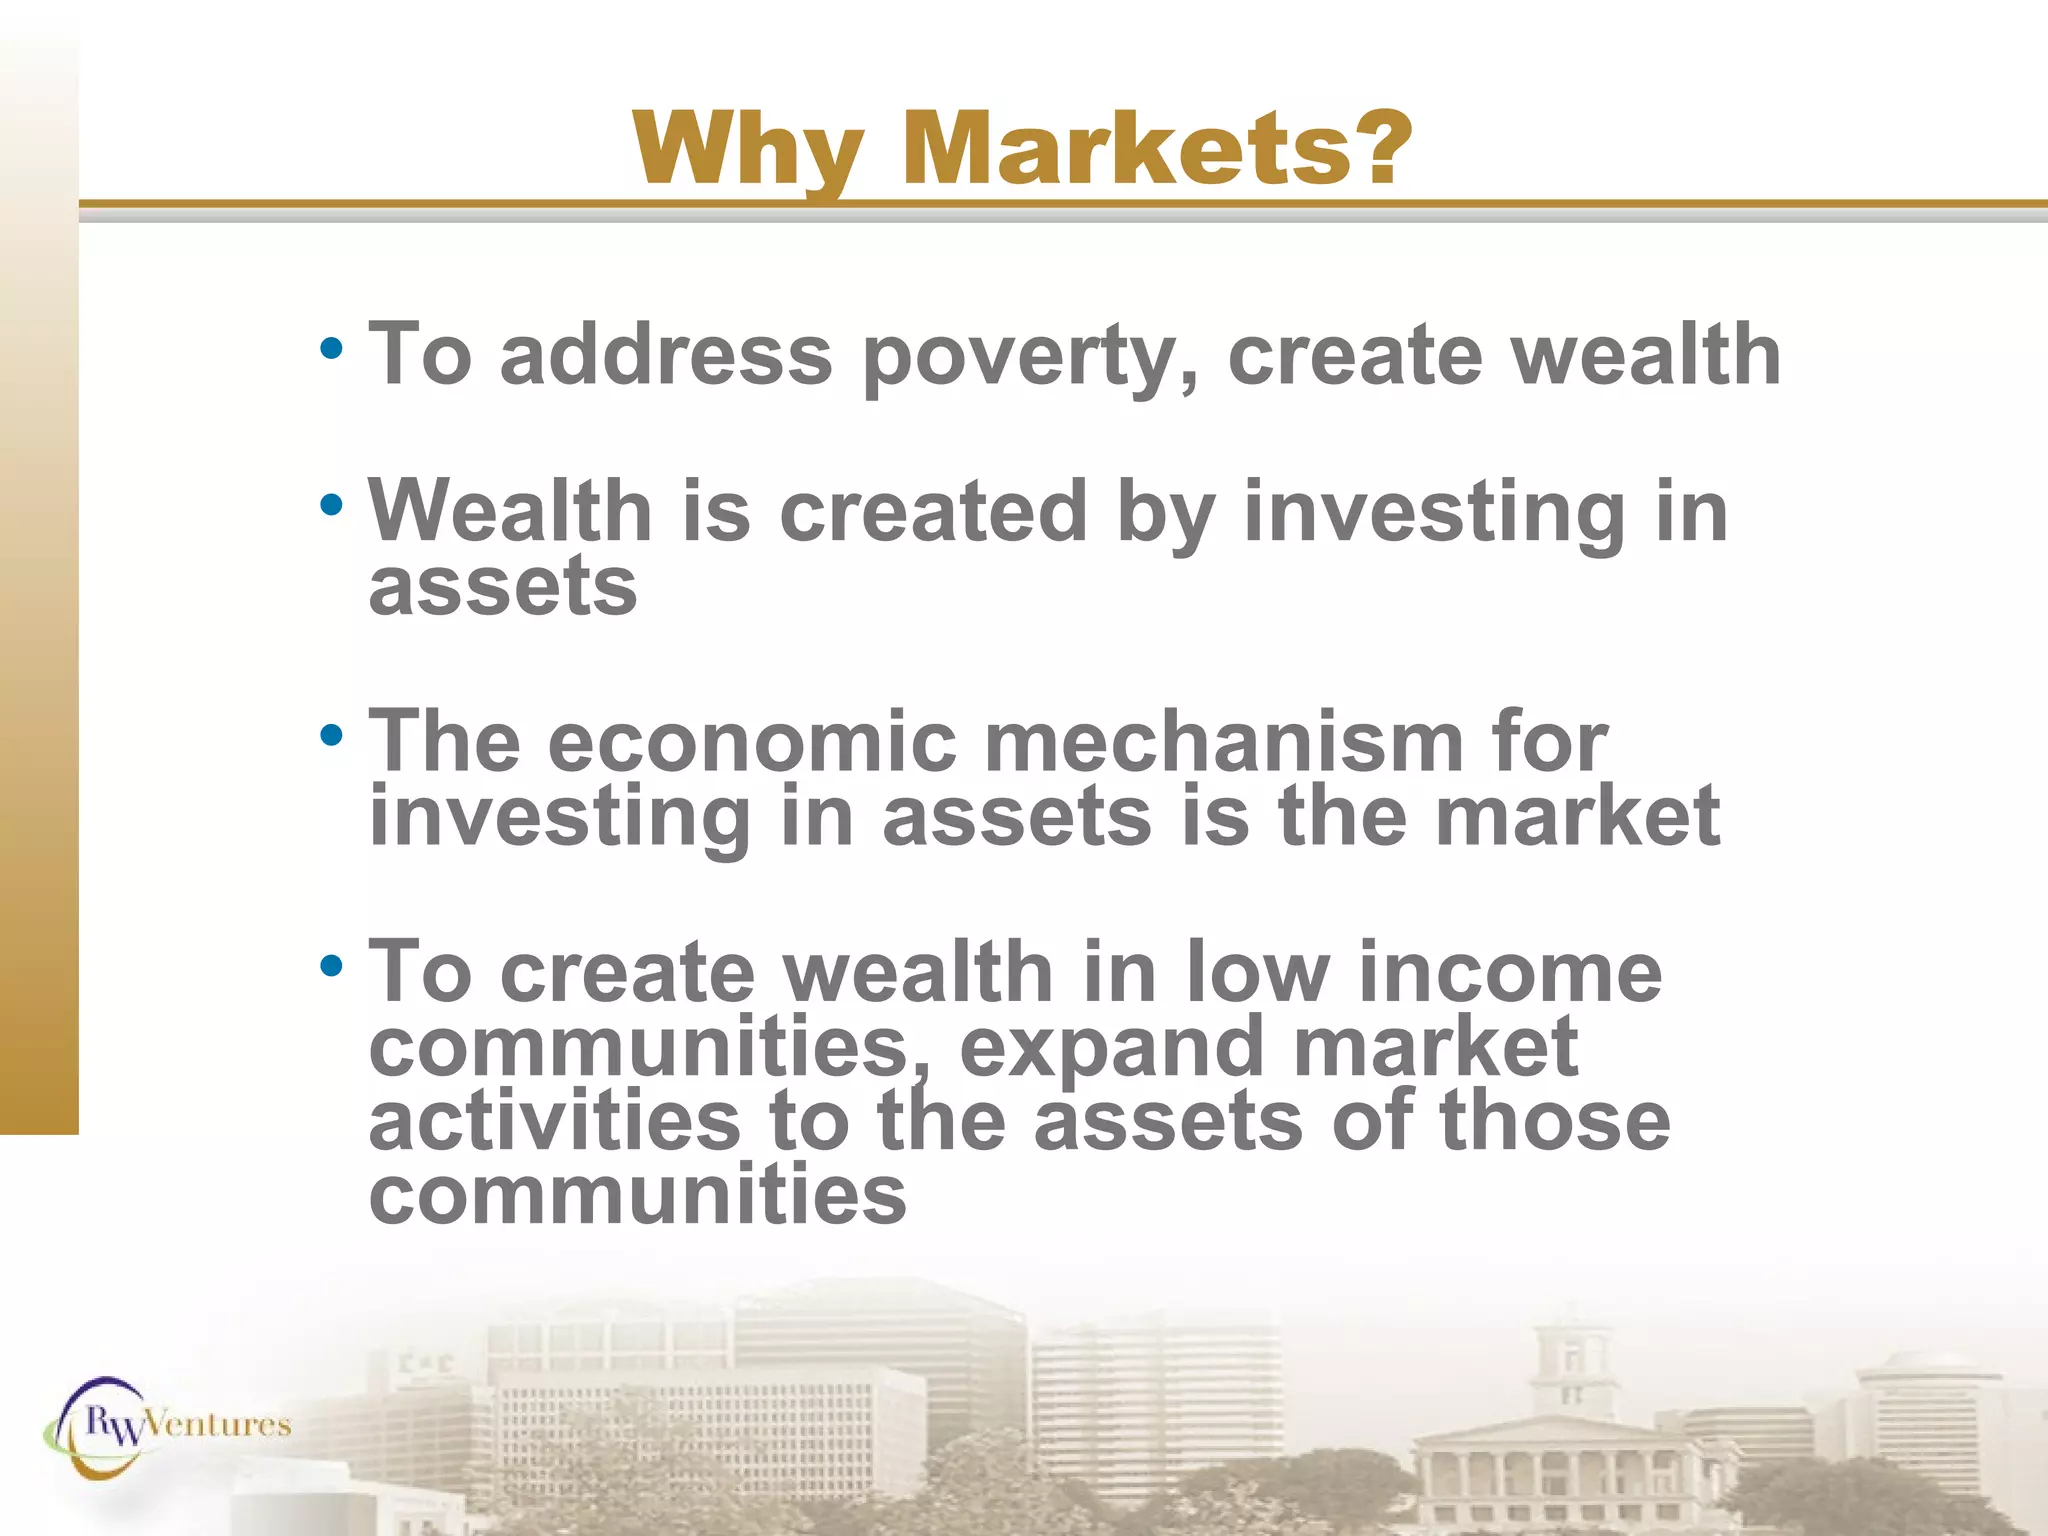
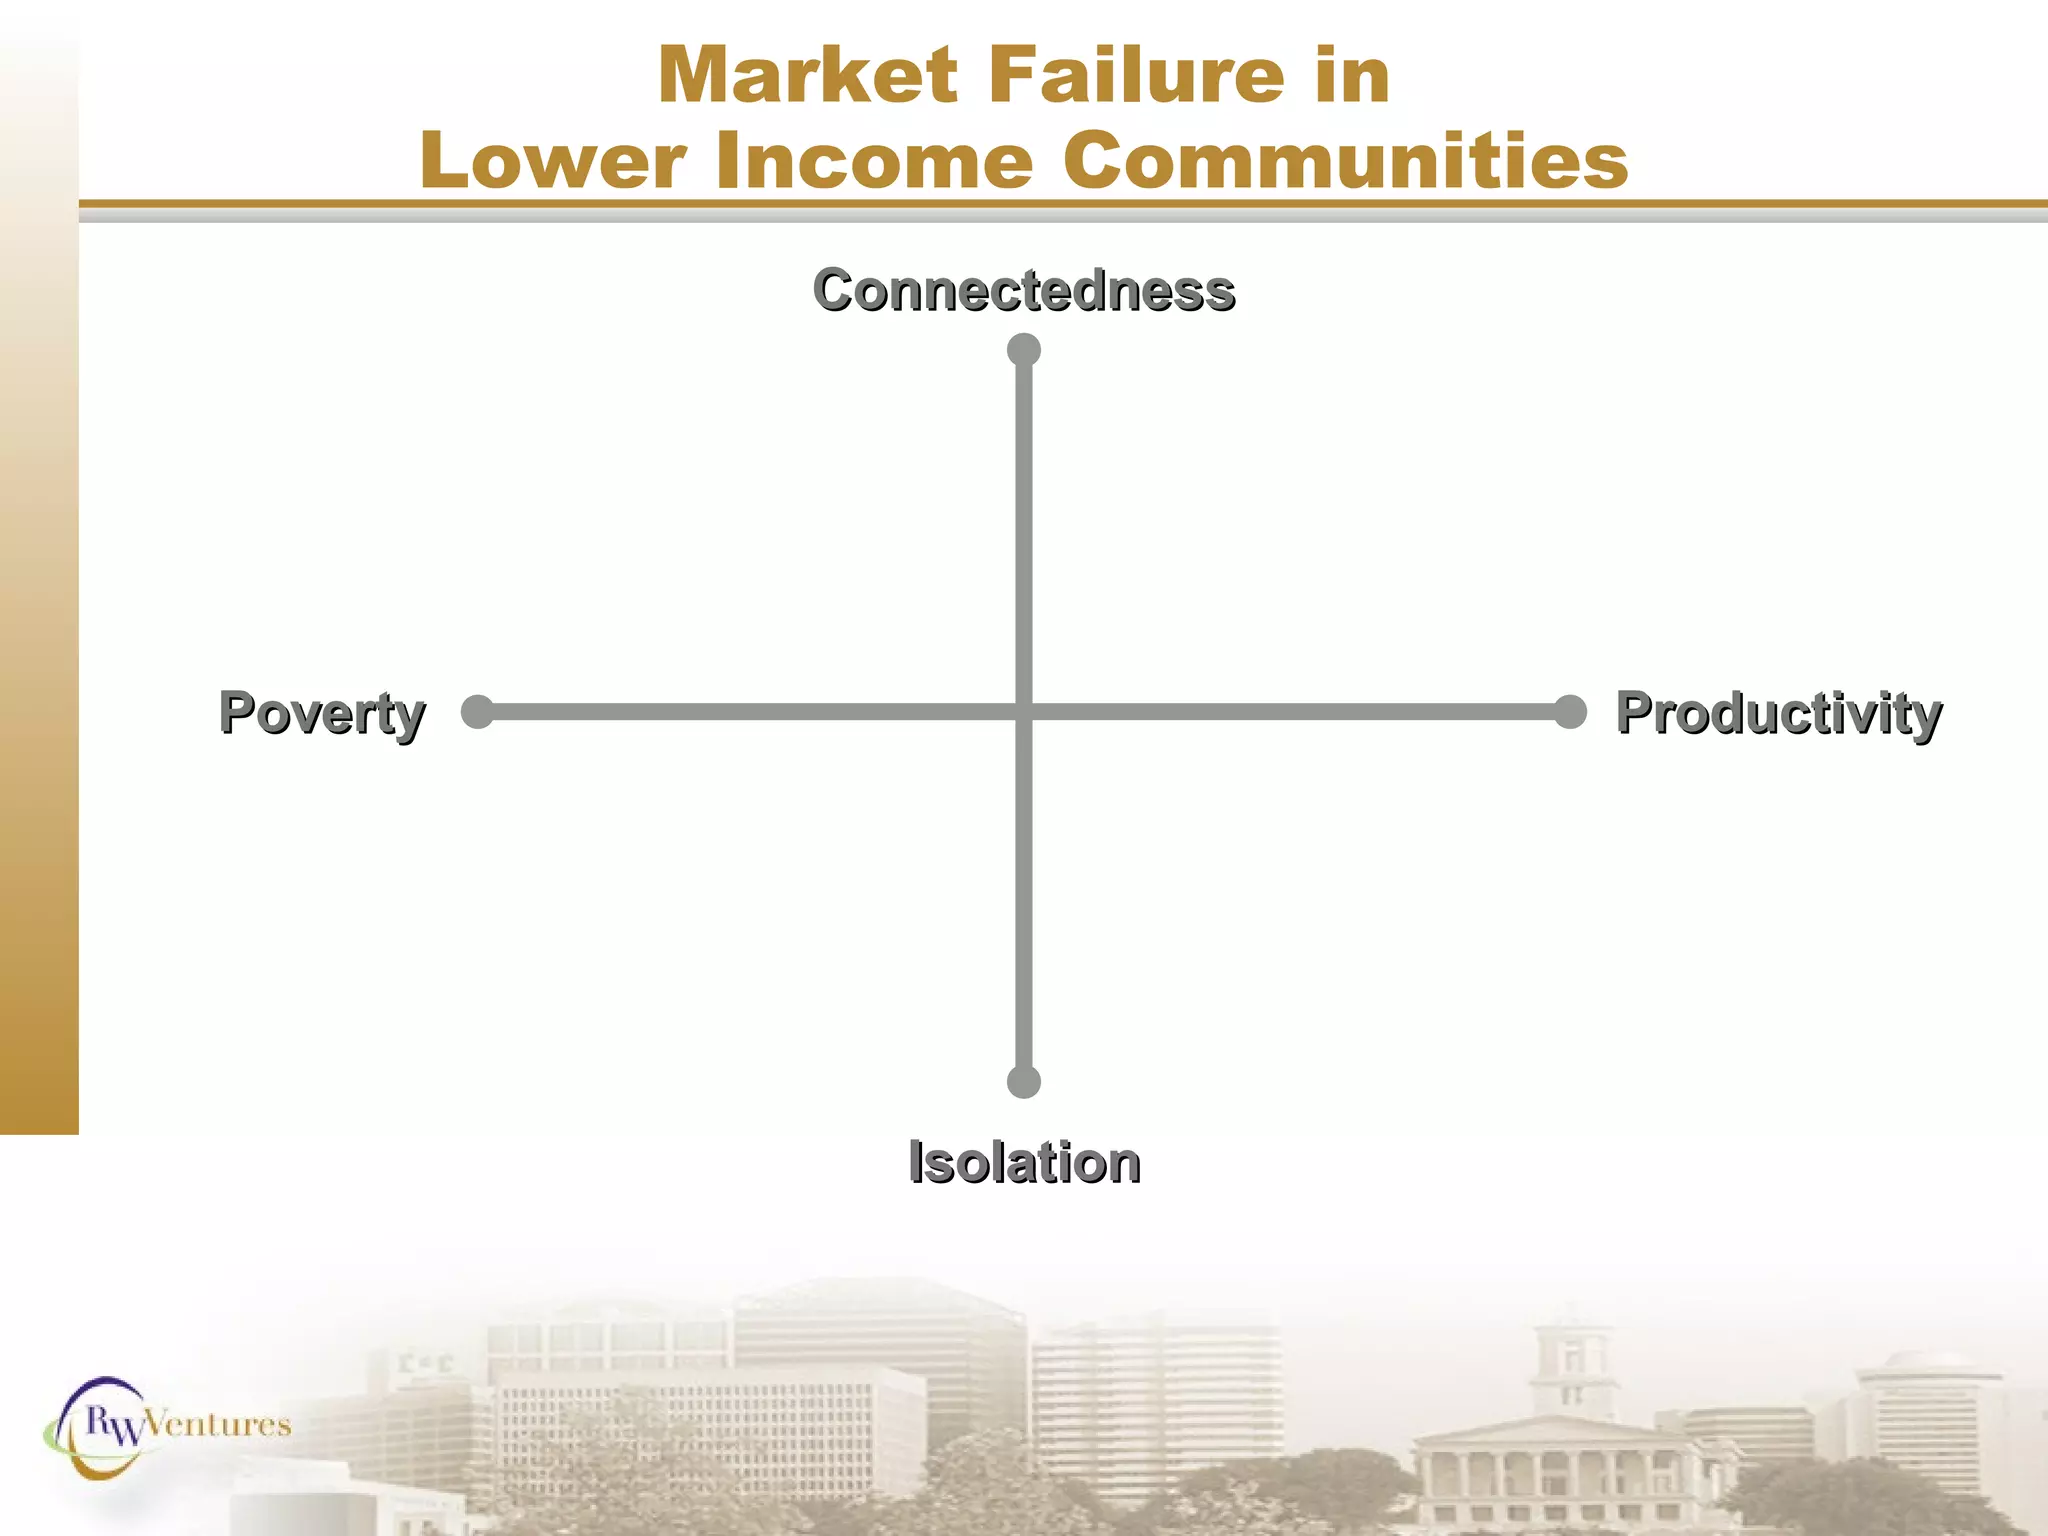
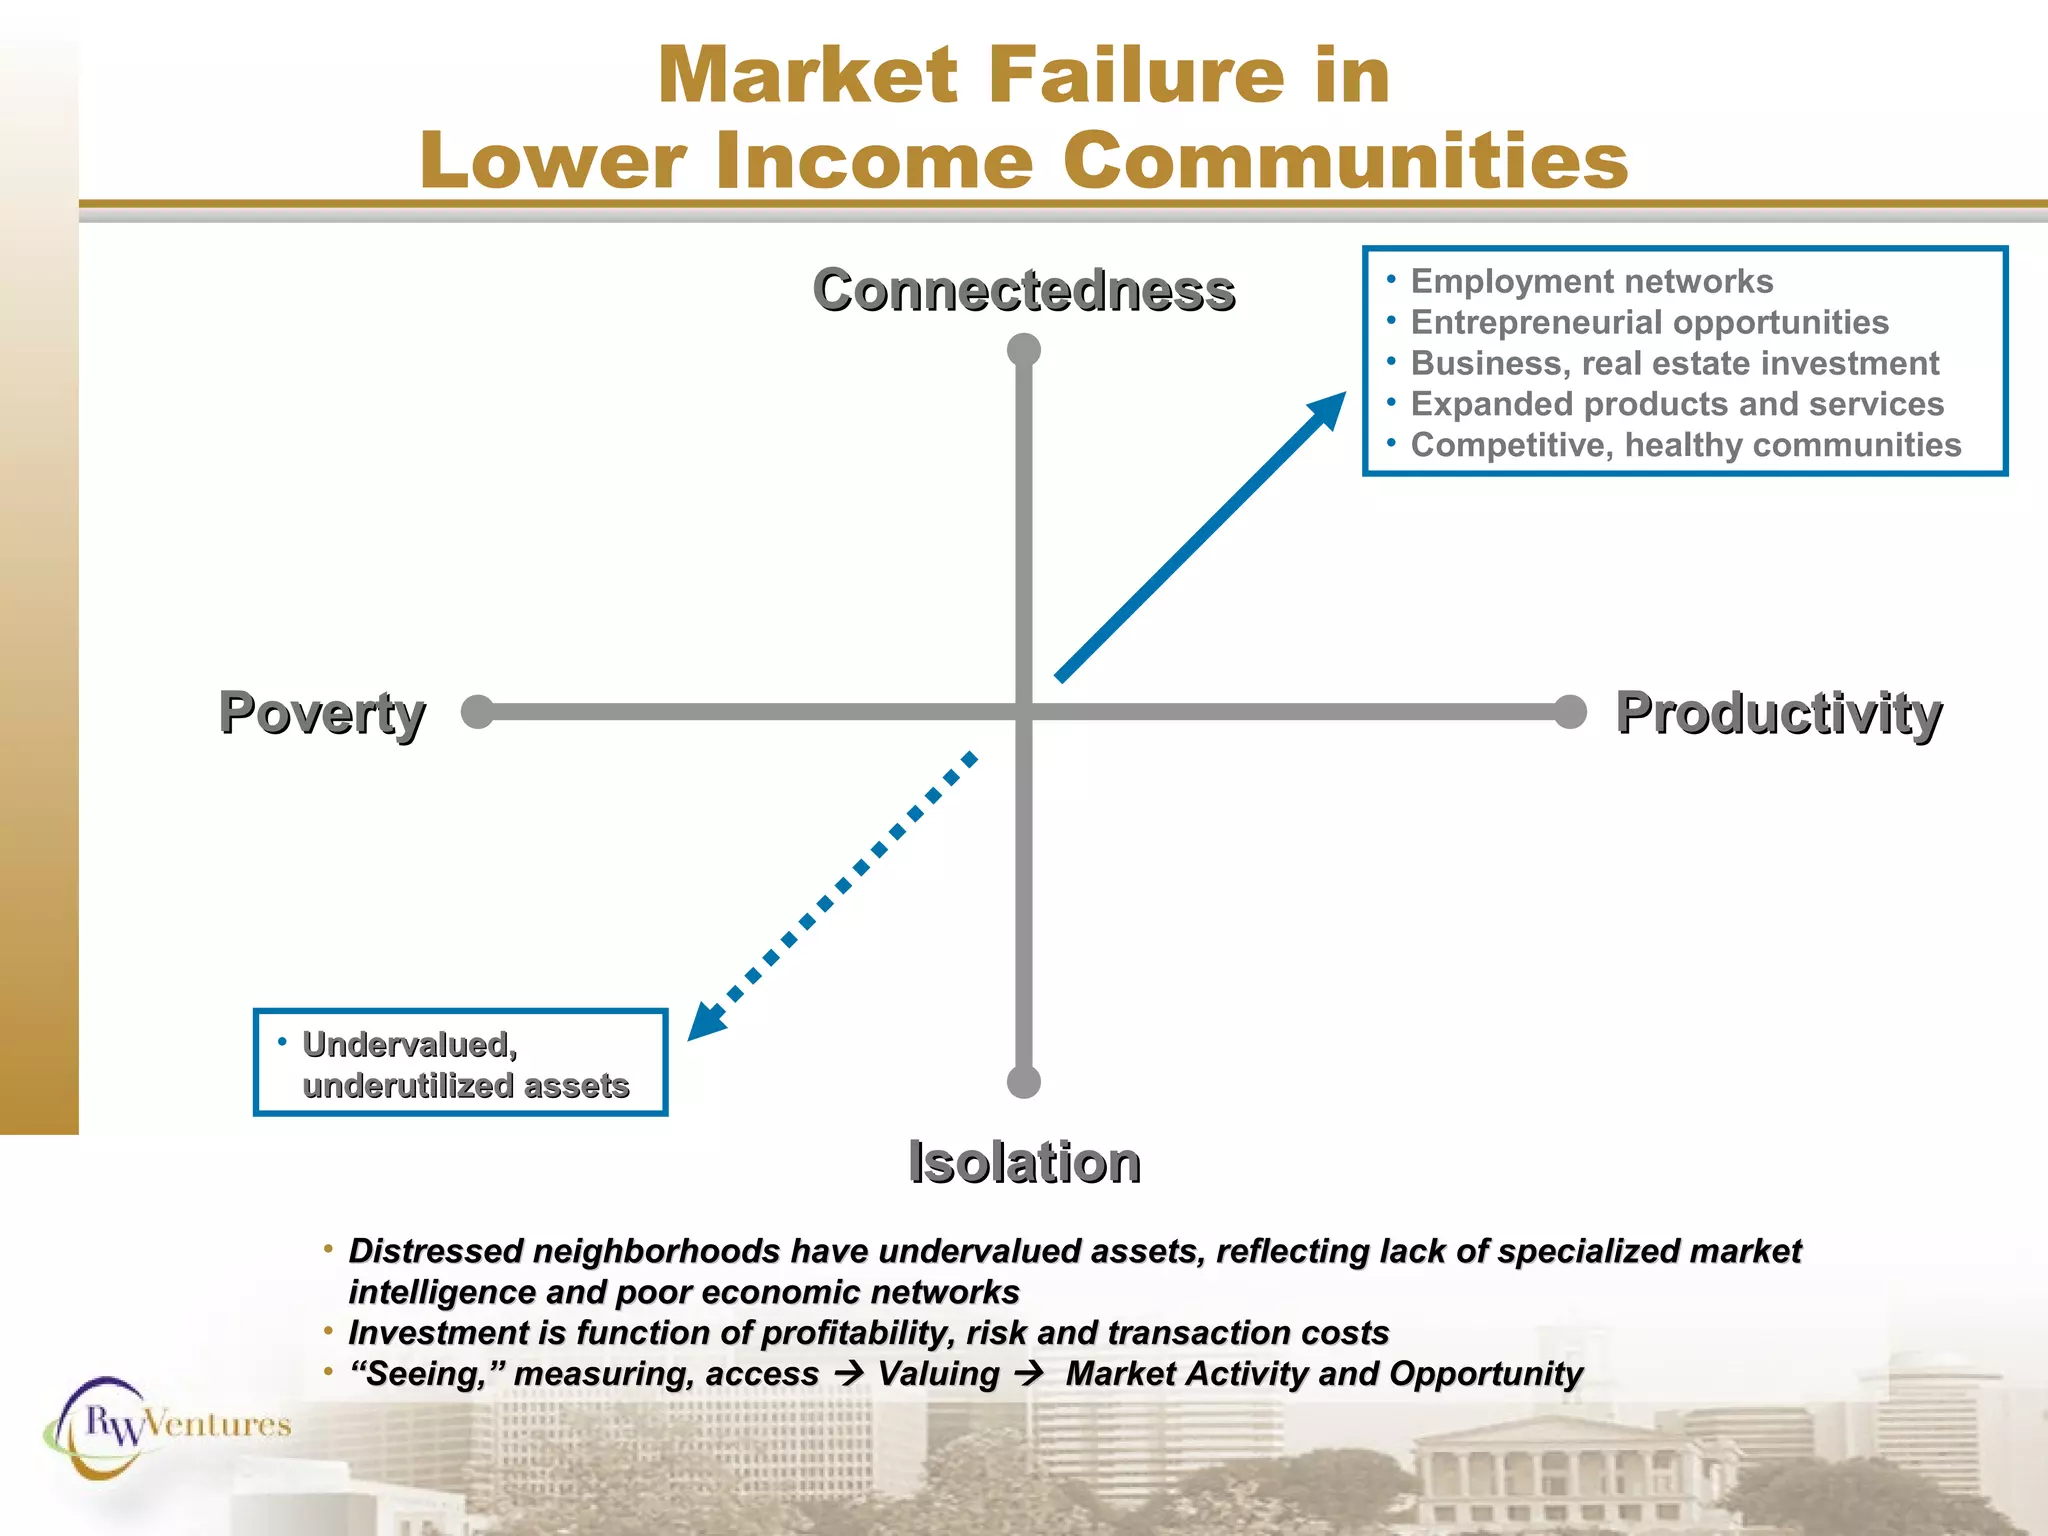
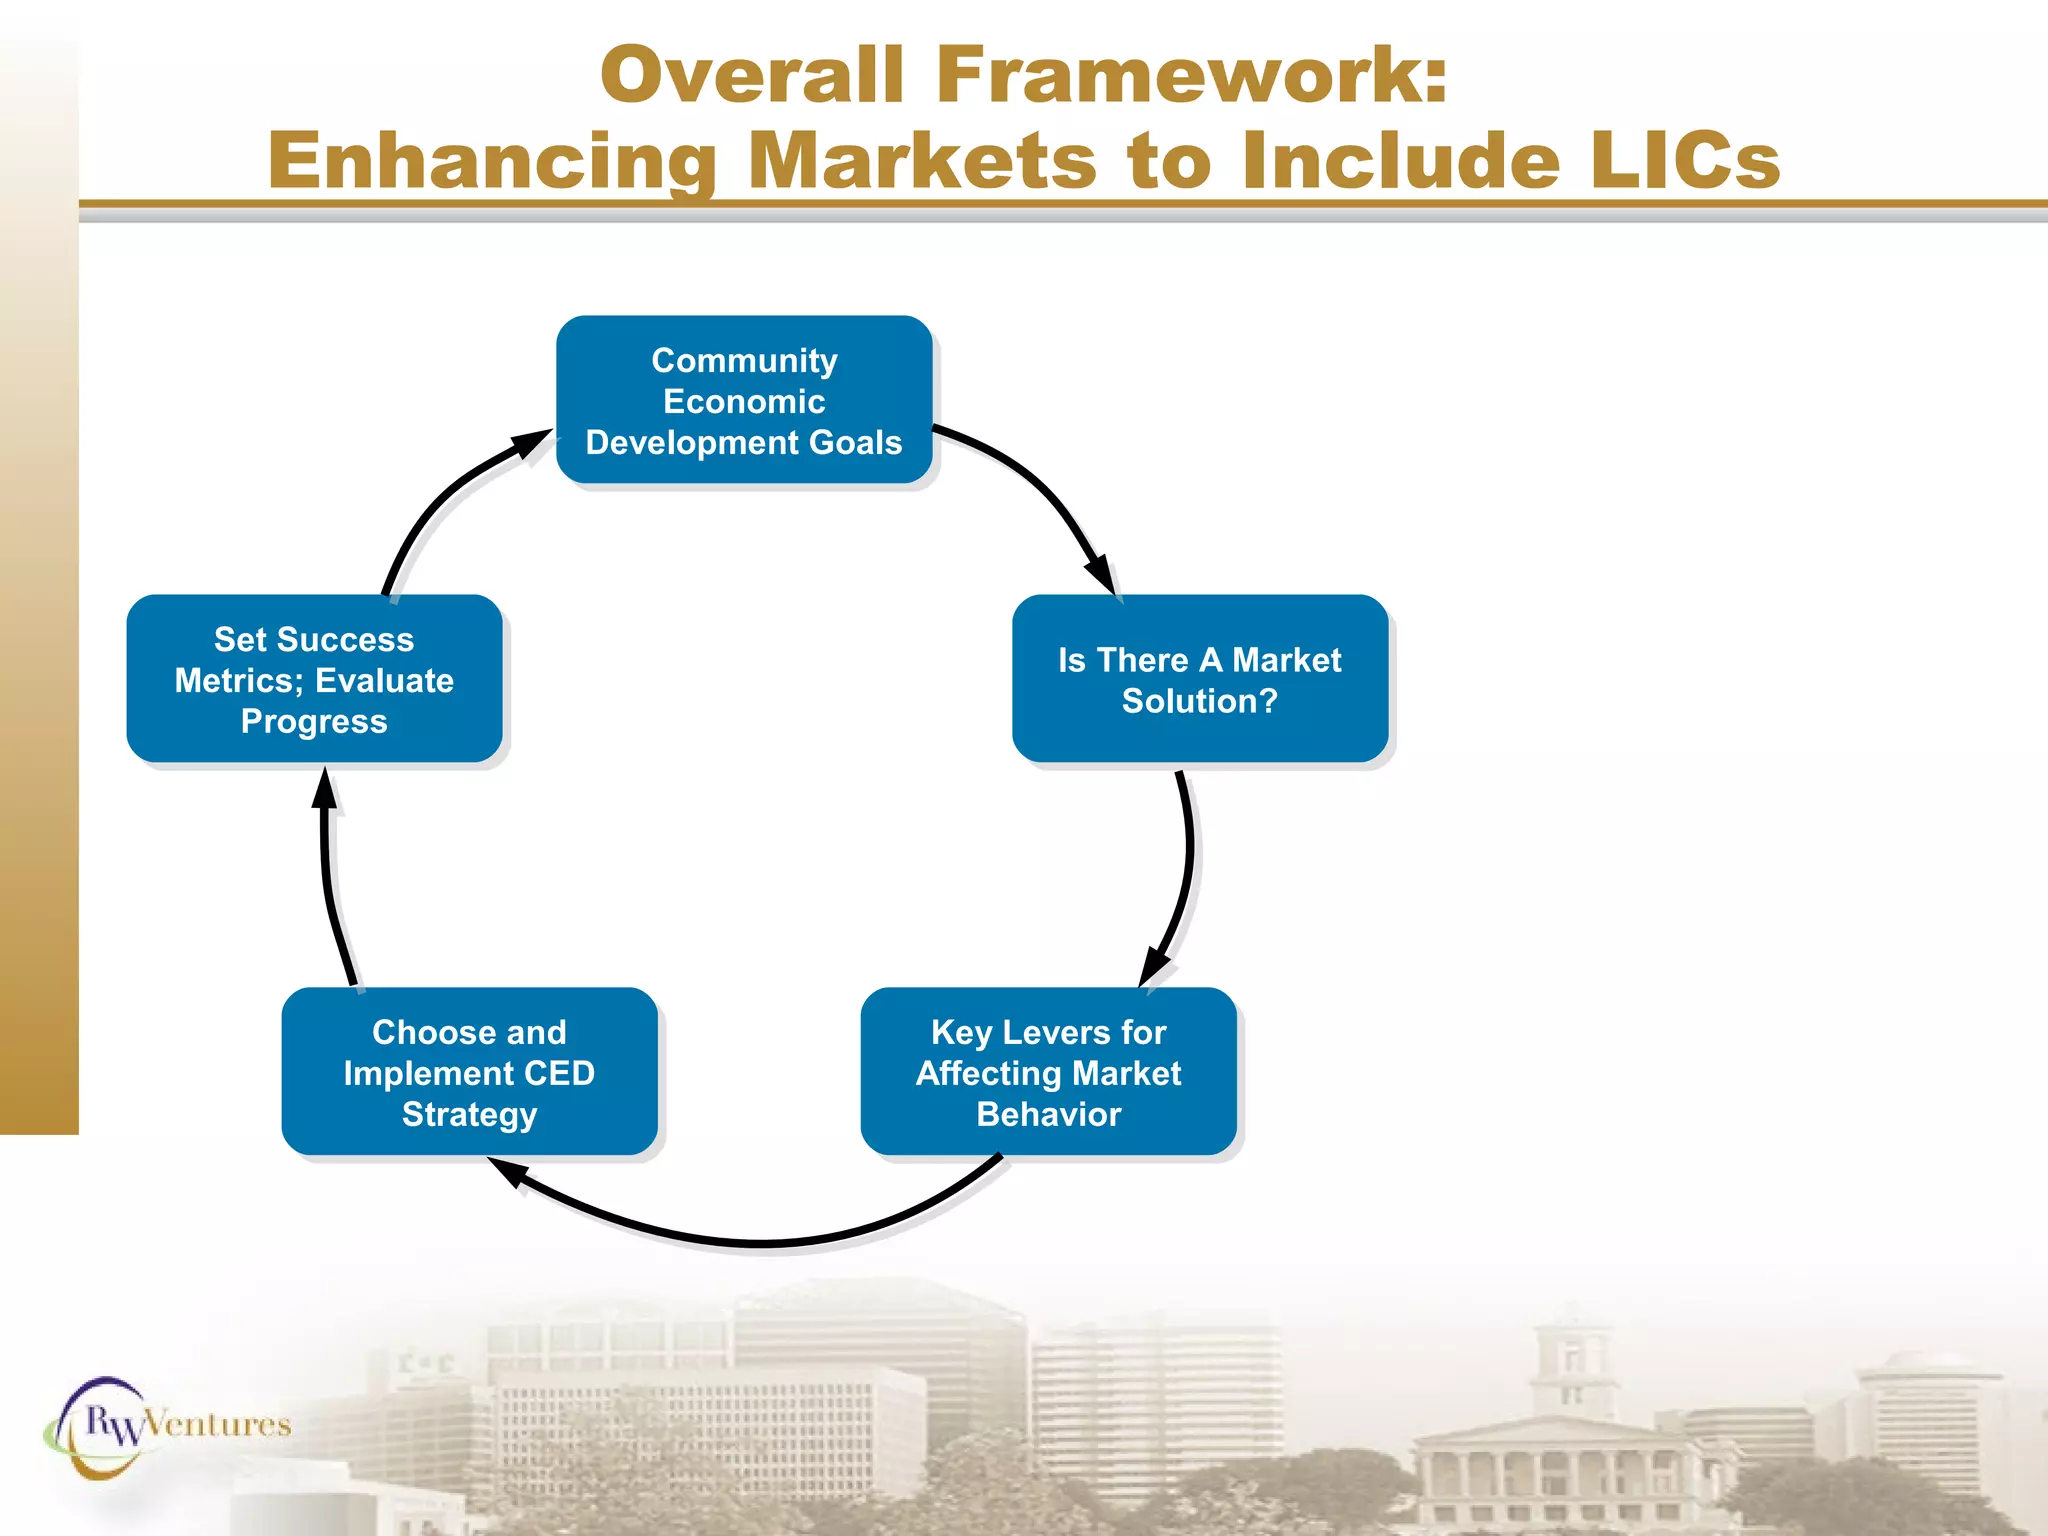
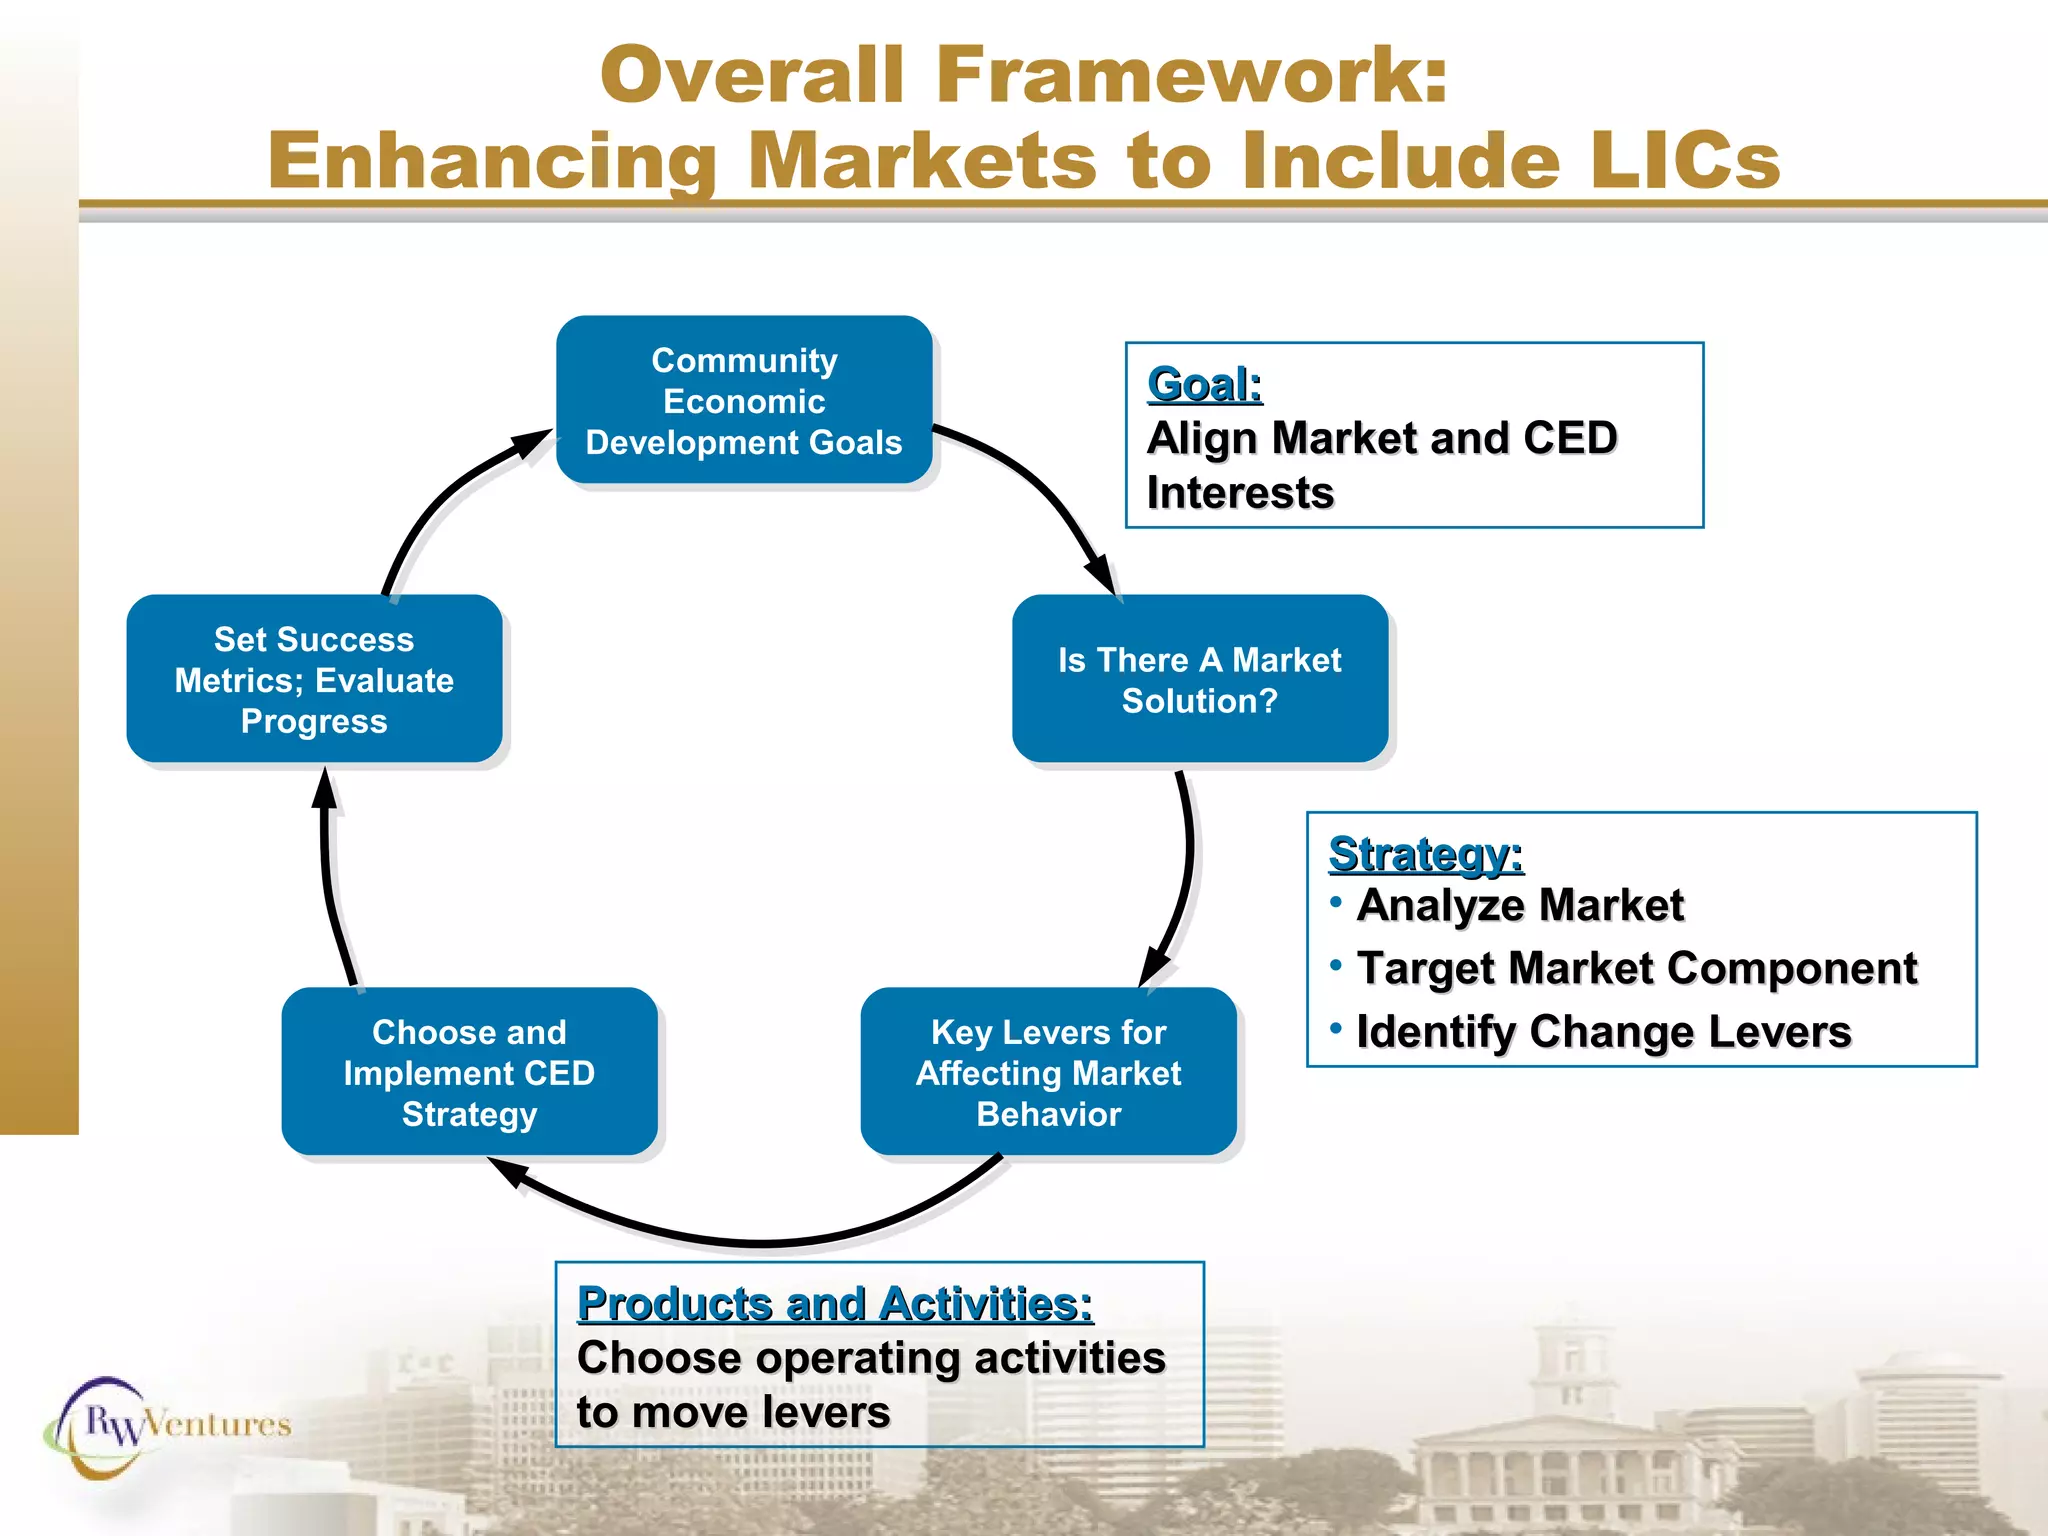
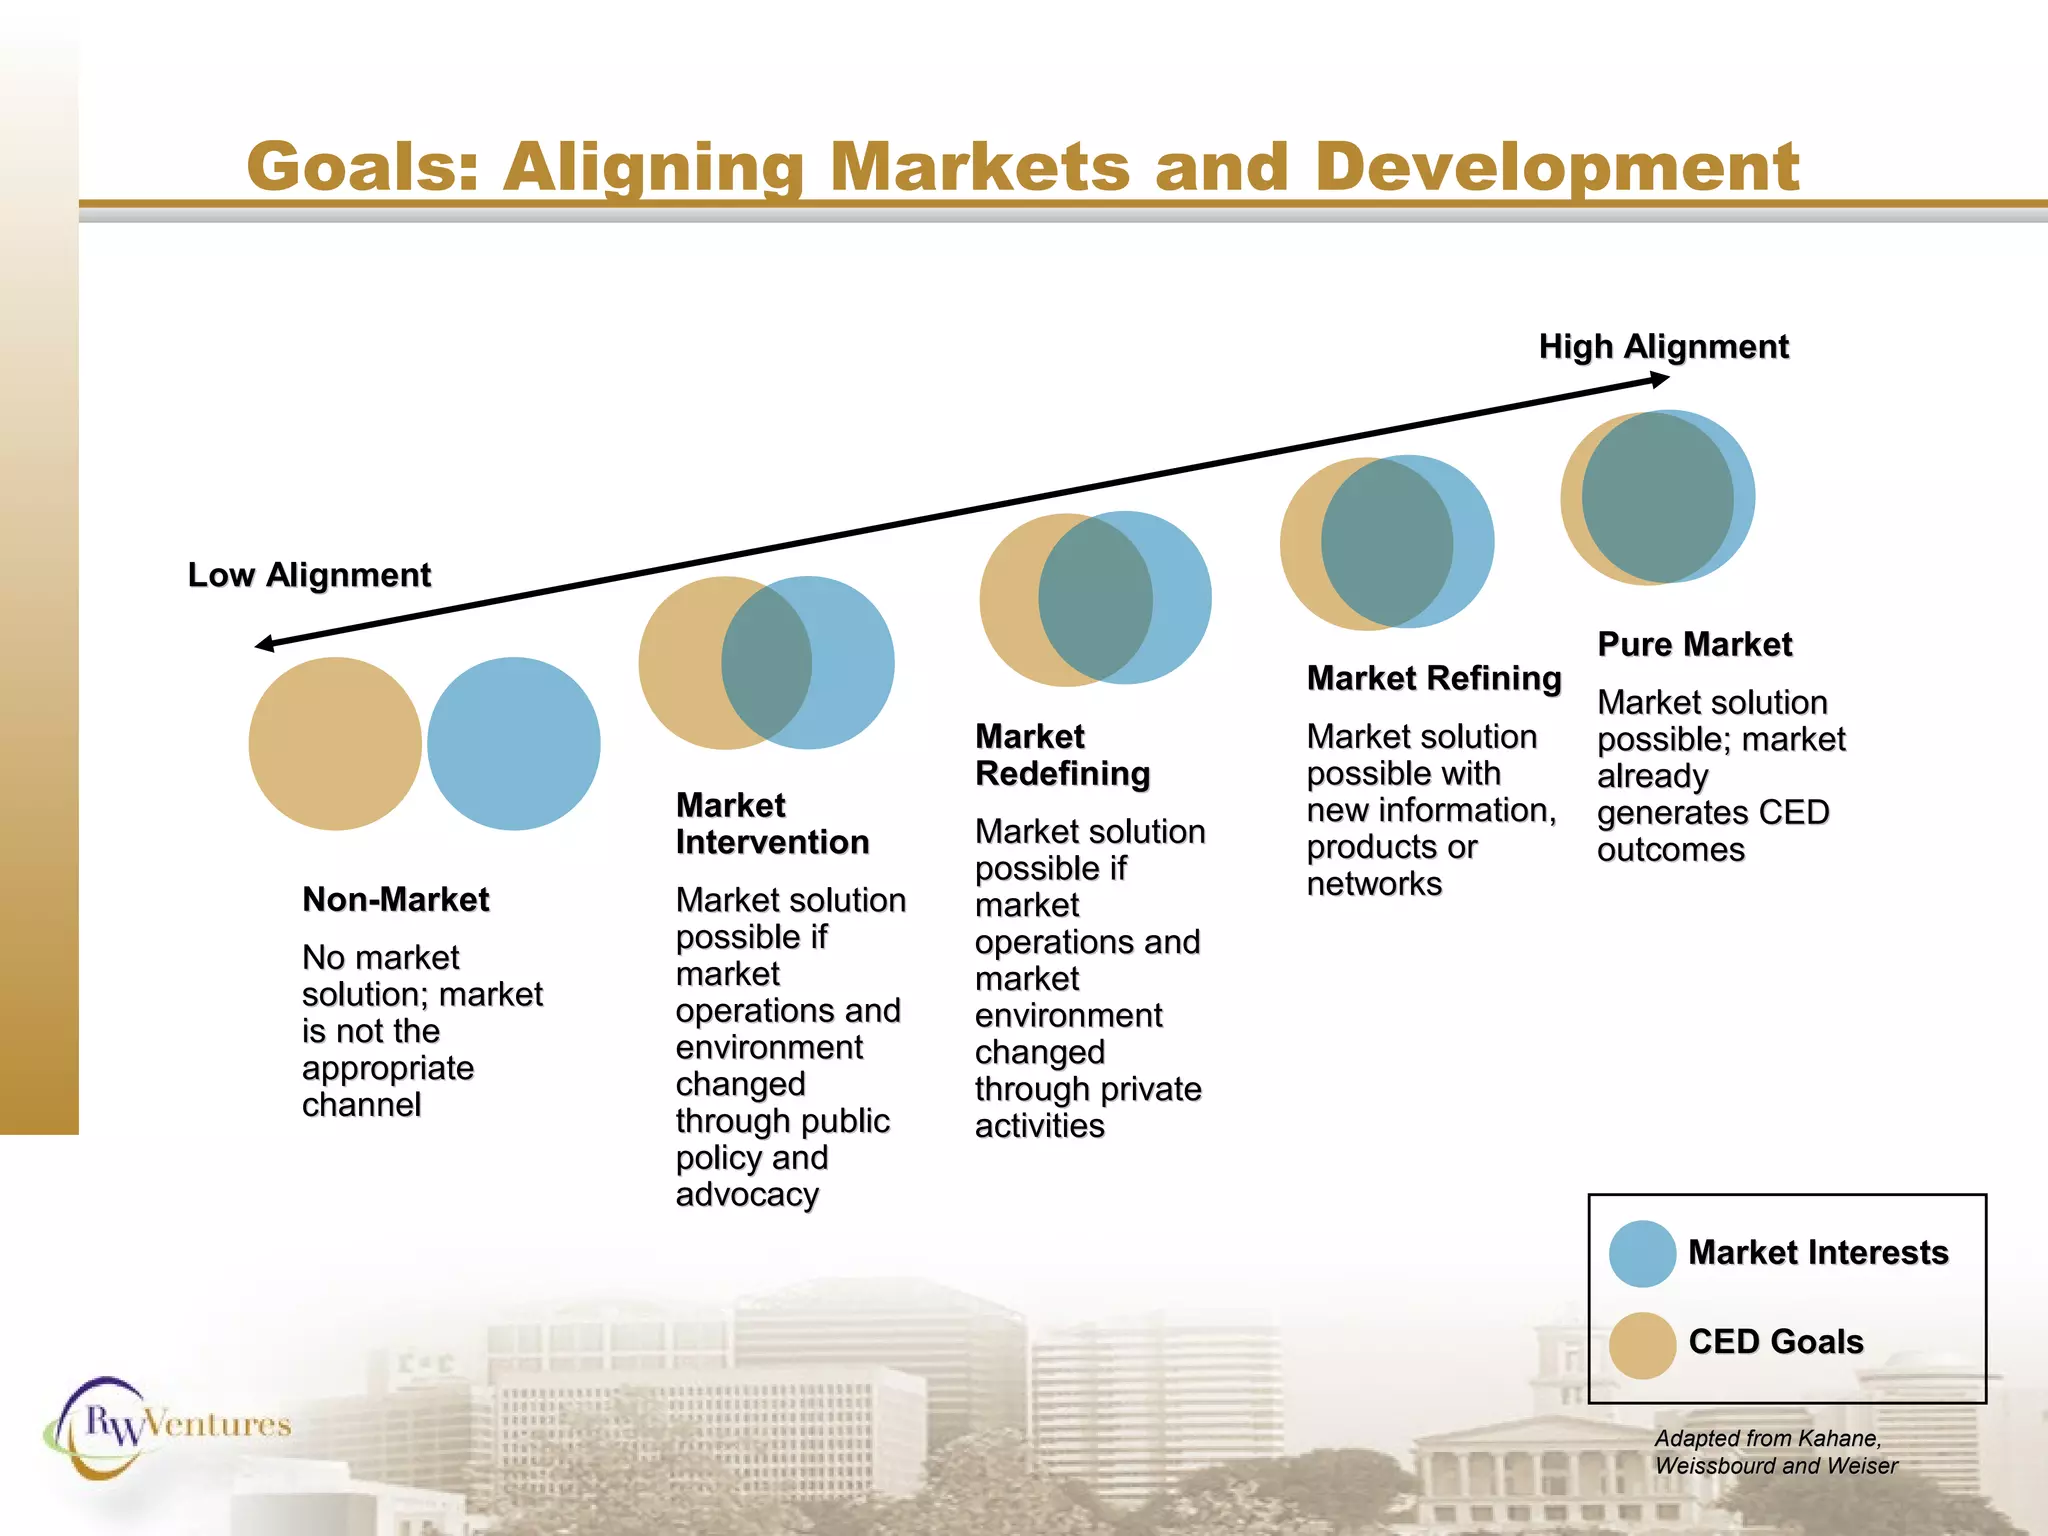
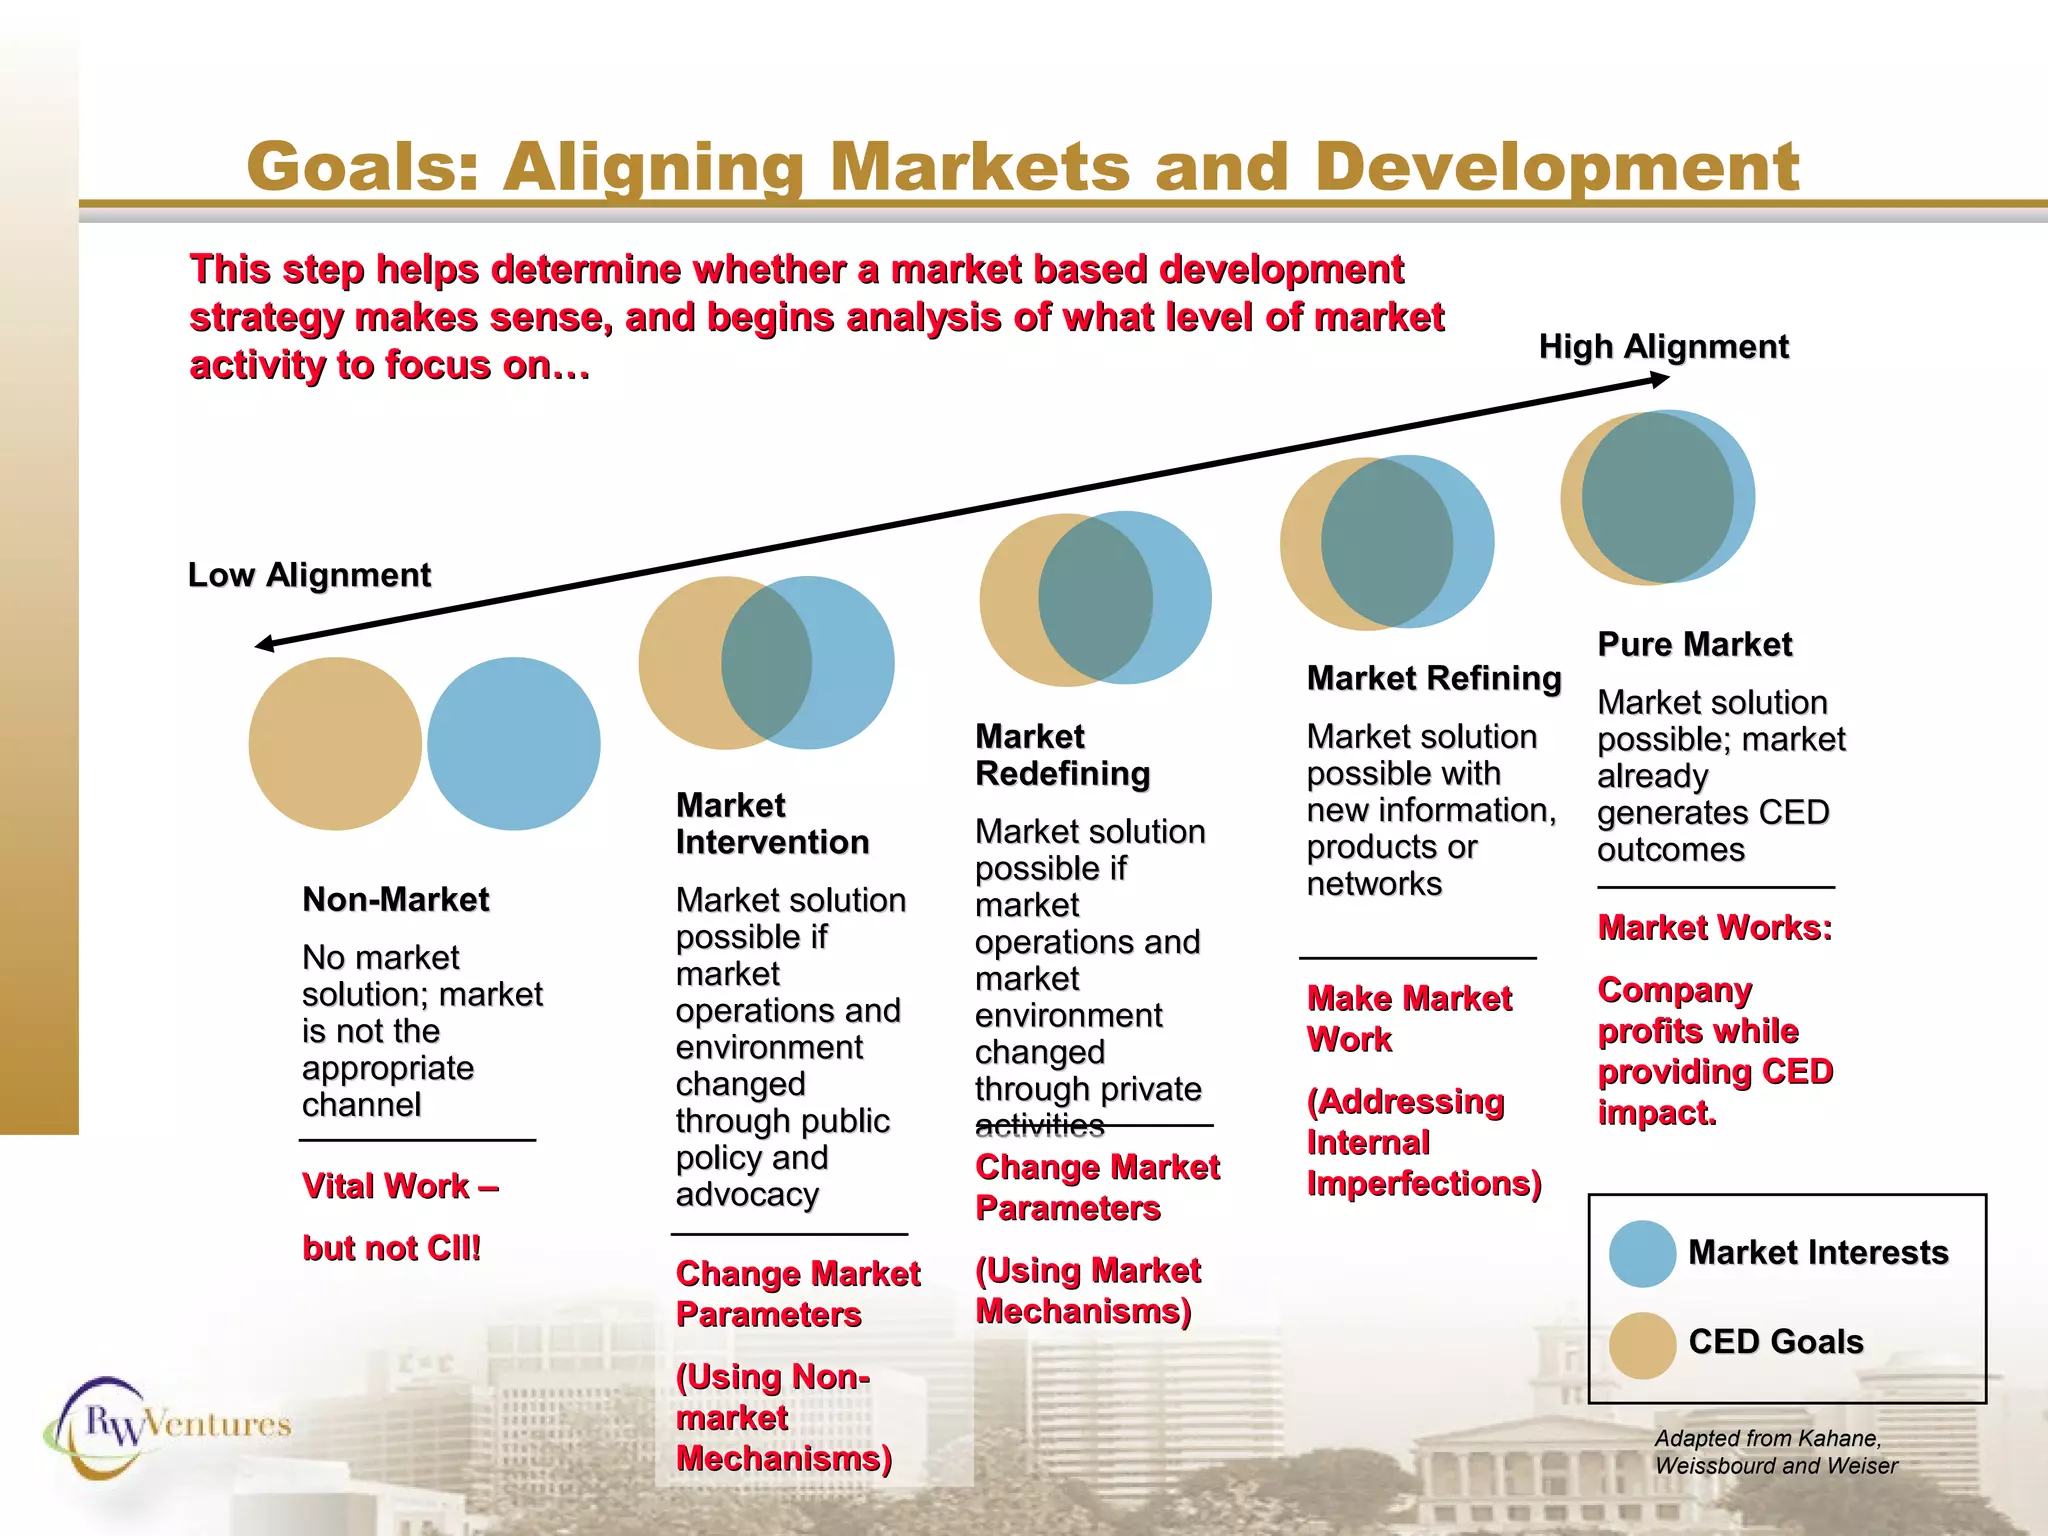
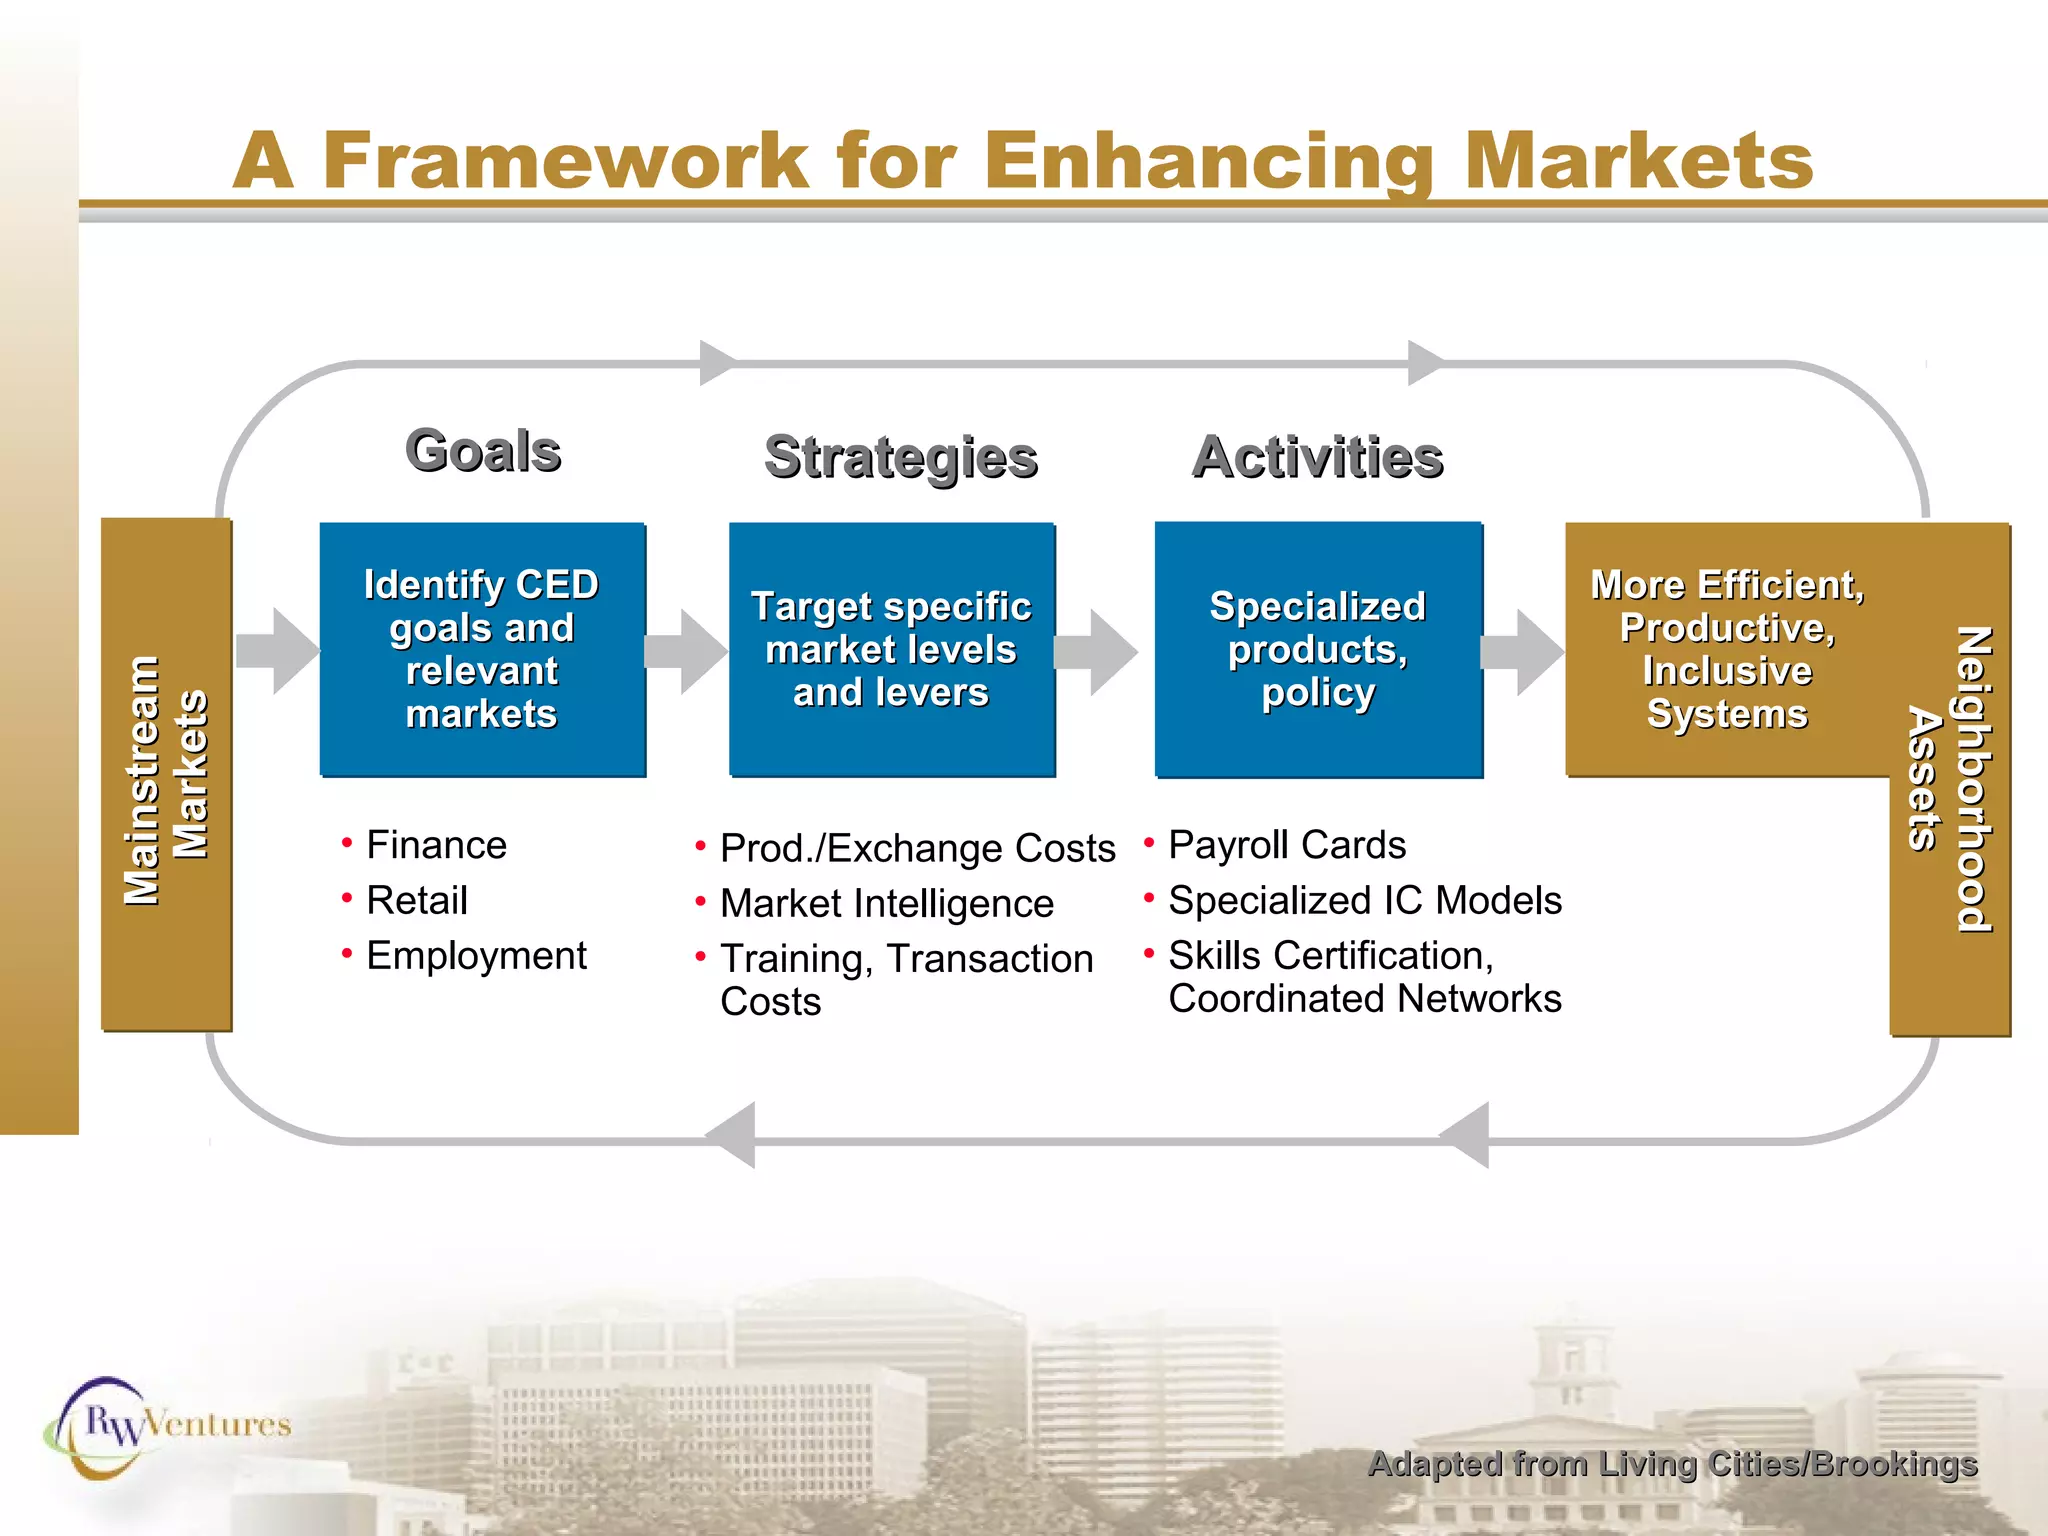
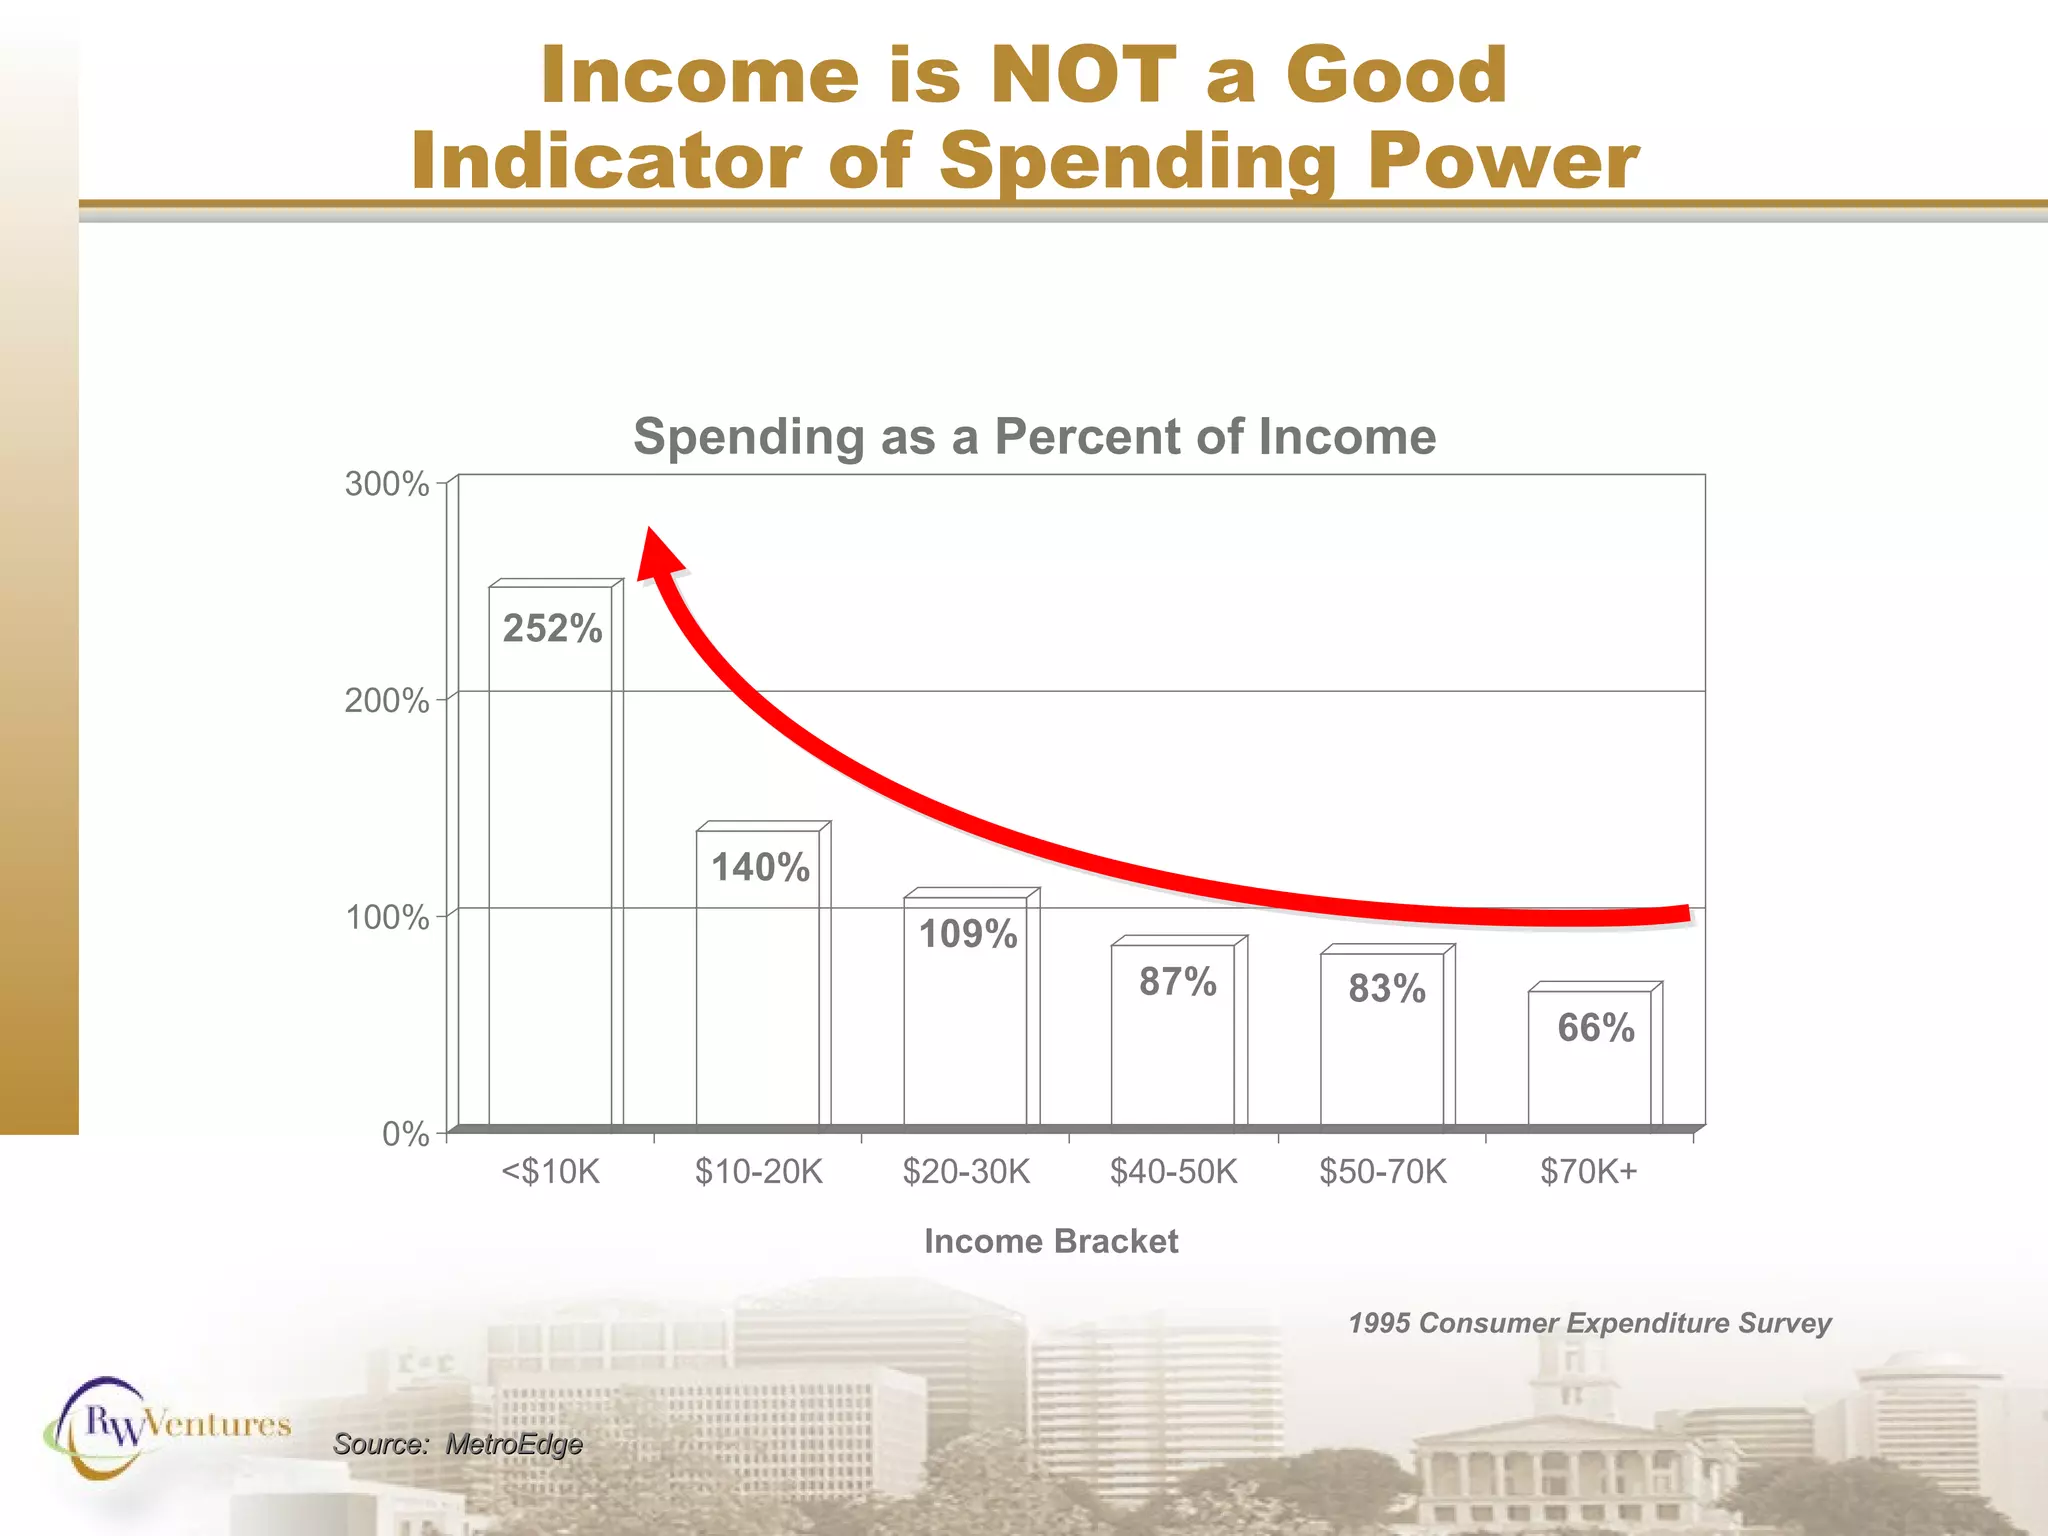
This document outlines a framework for using market-based approaches to community economic development. It argues that markets can be leveraged to invest in undervalued assets in low-income communities. The framework involves:
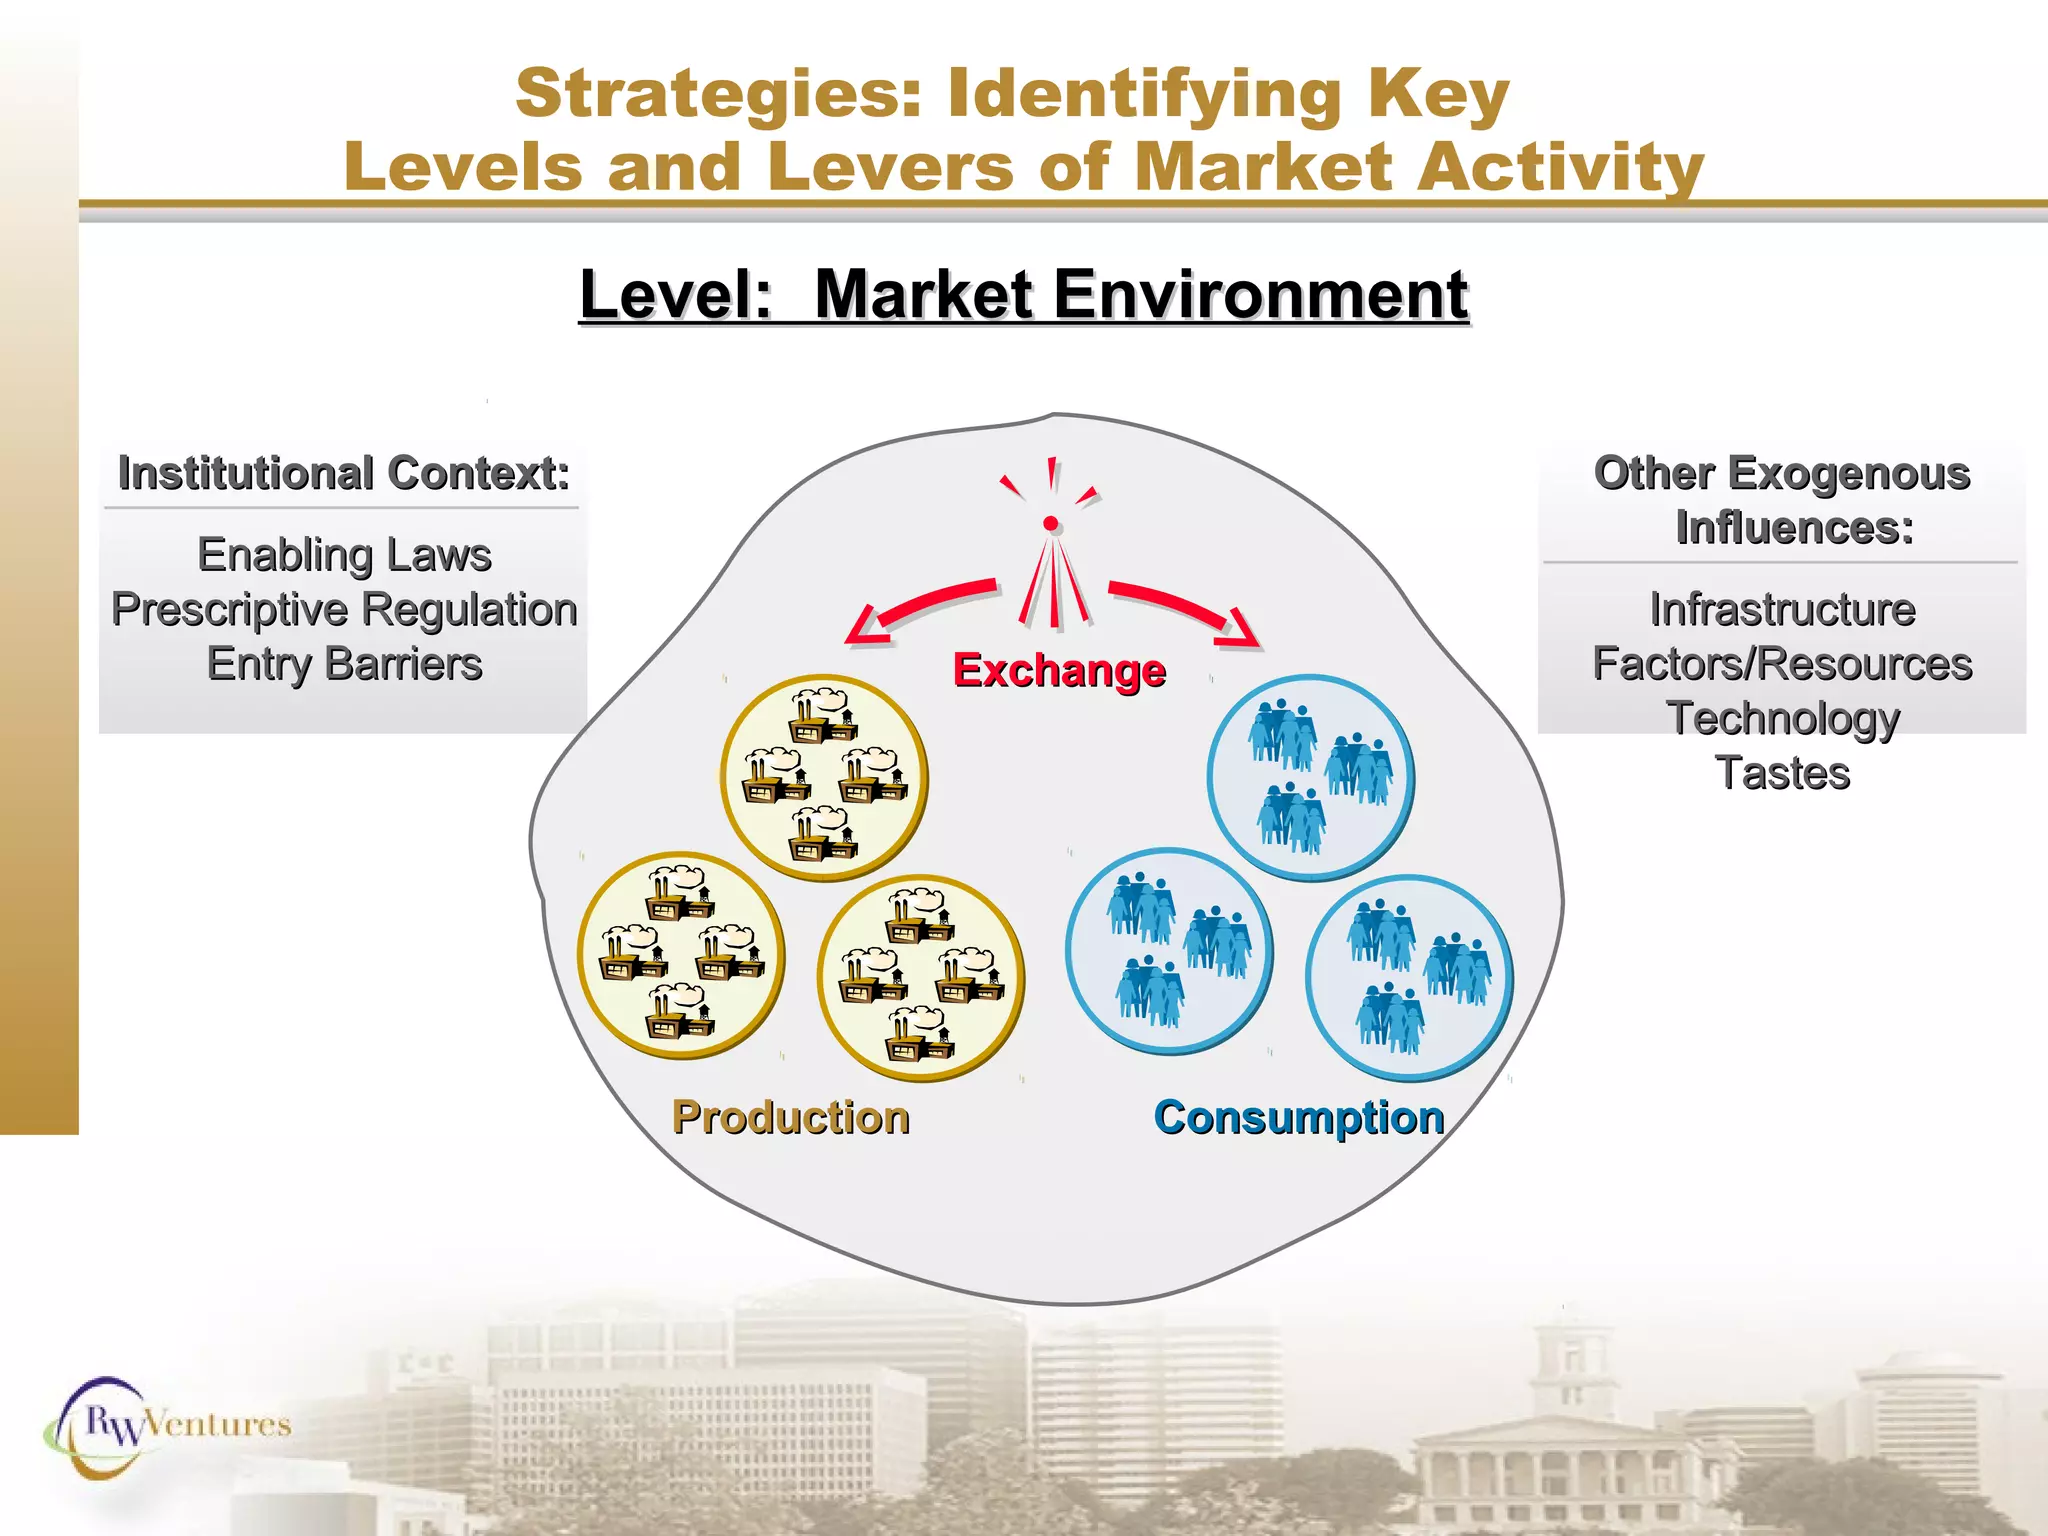
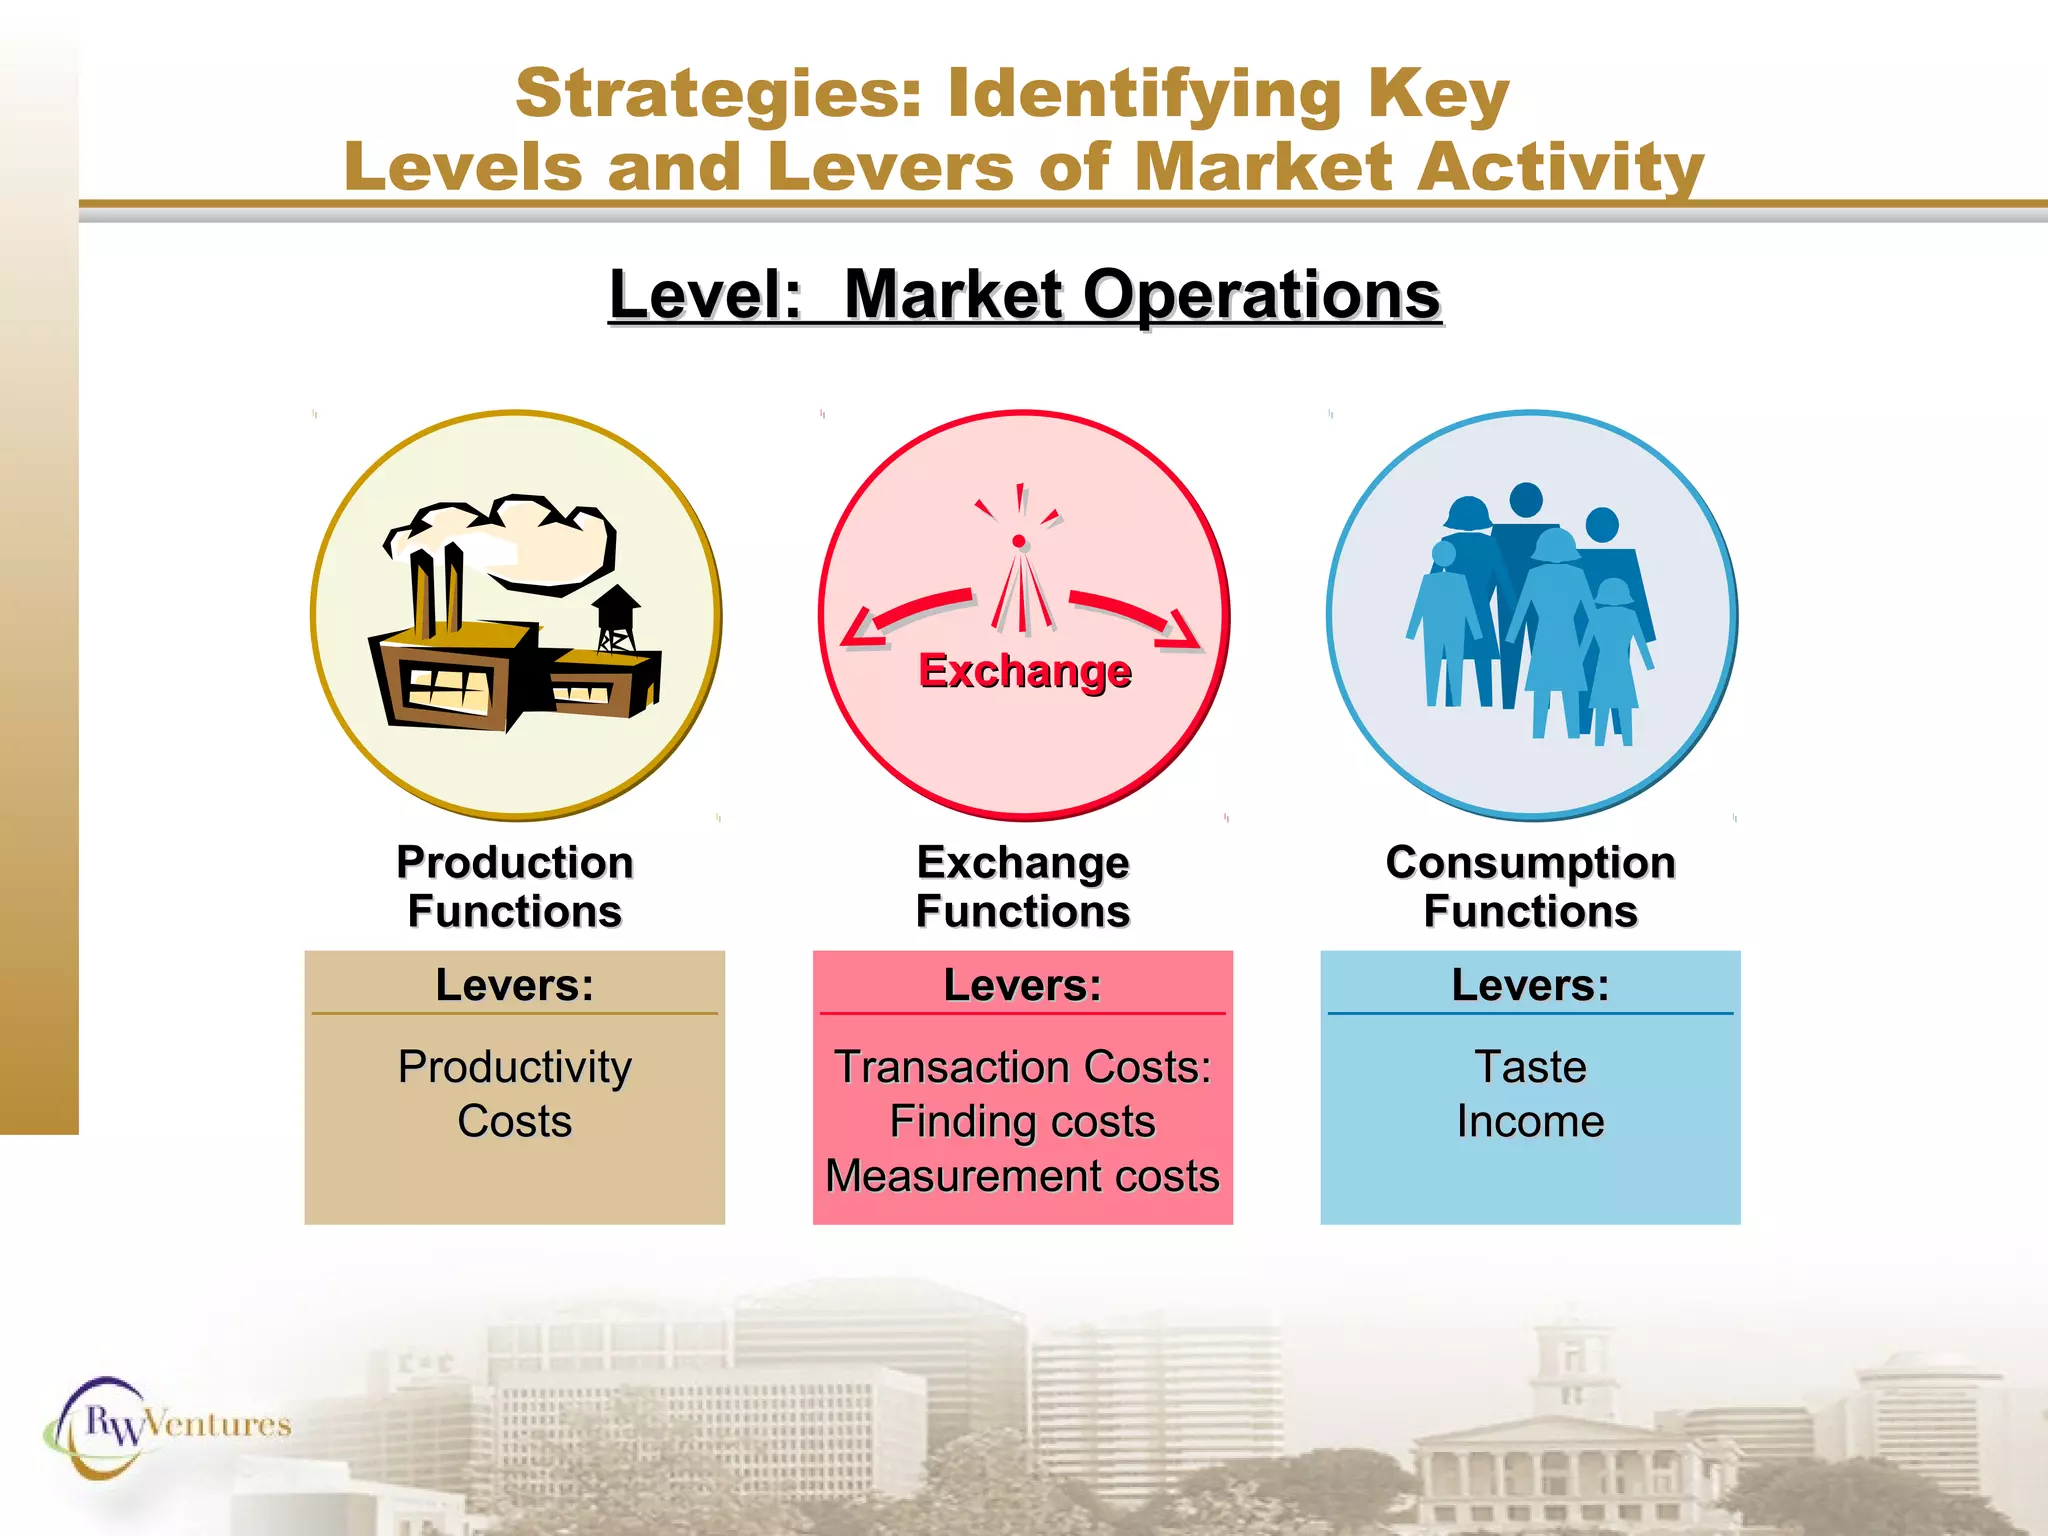
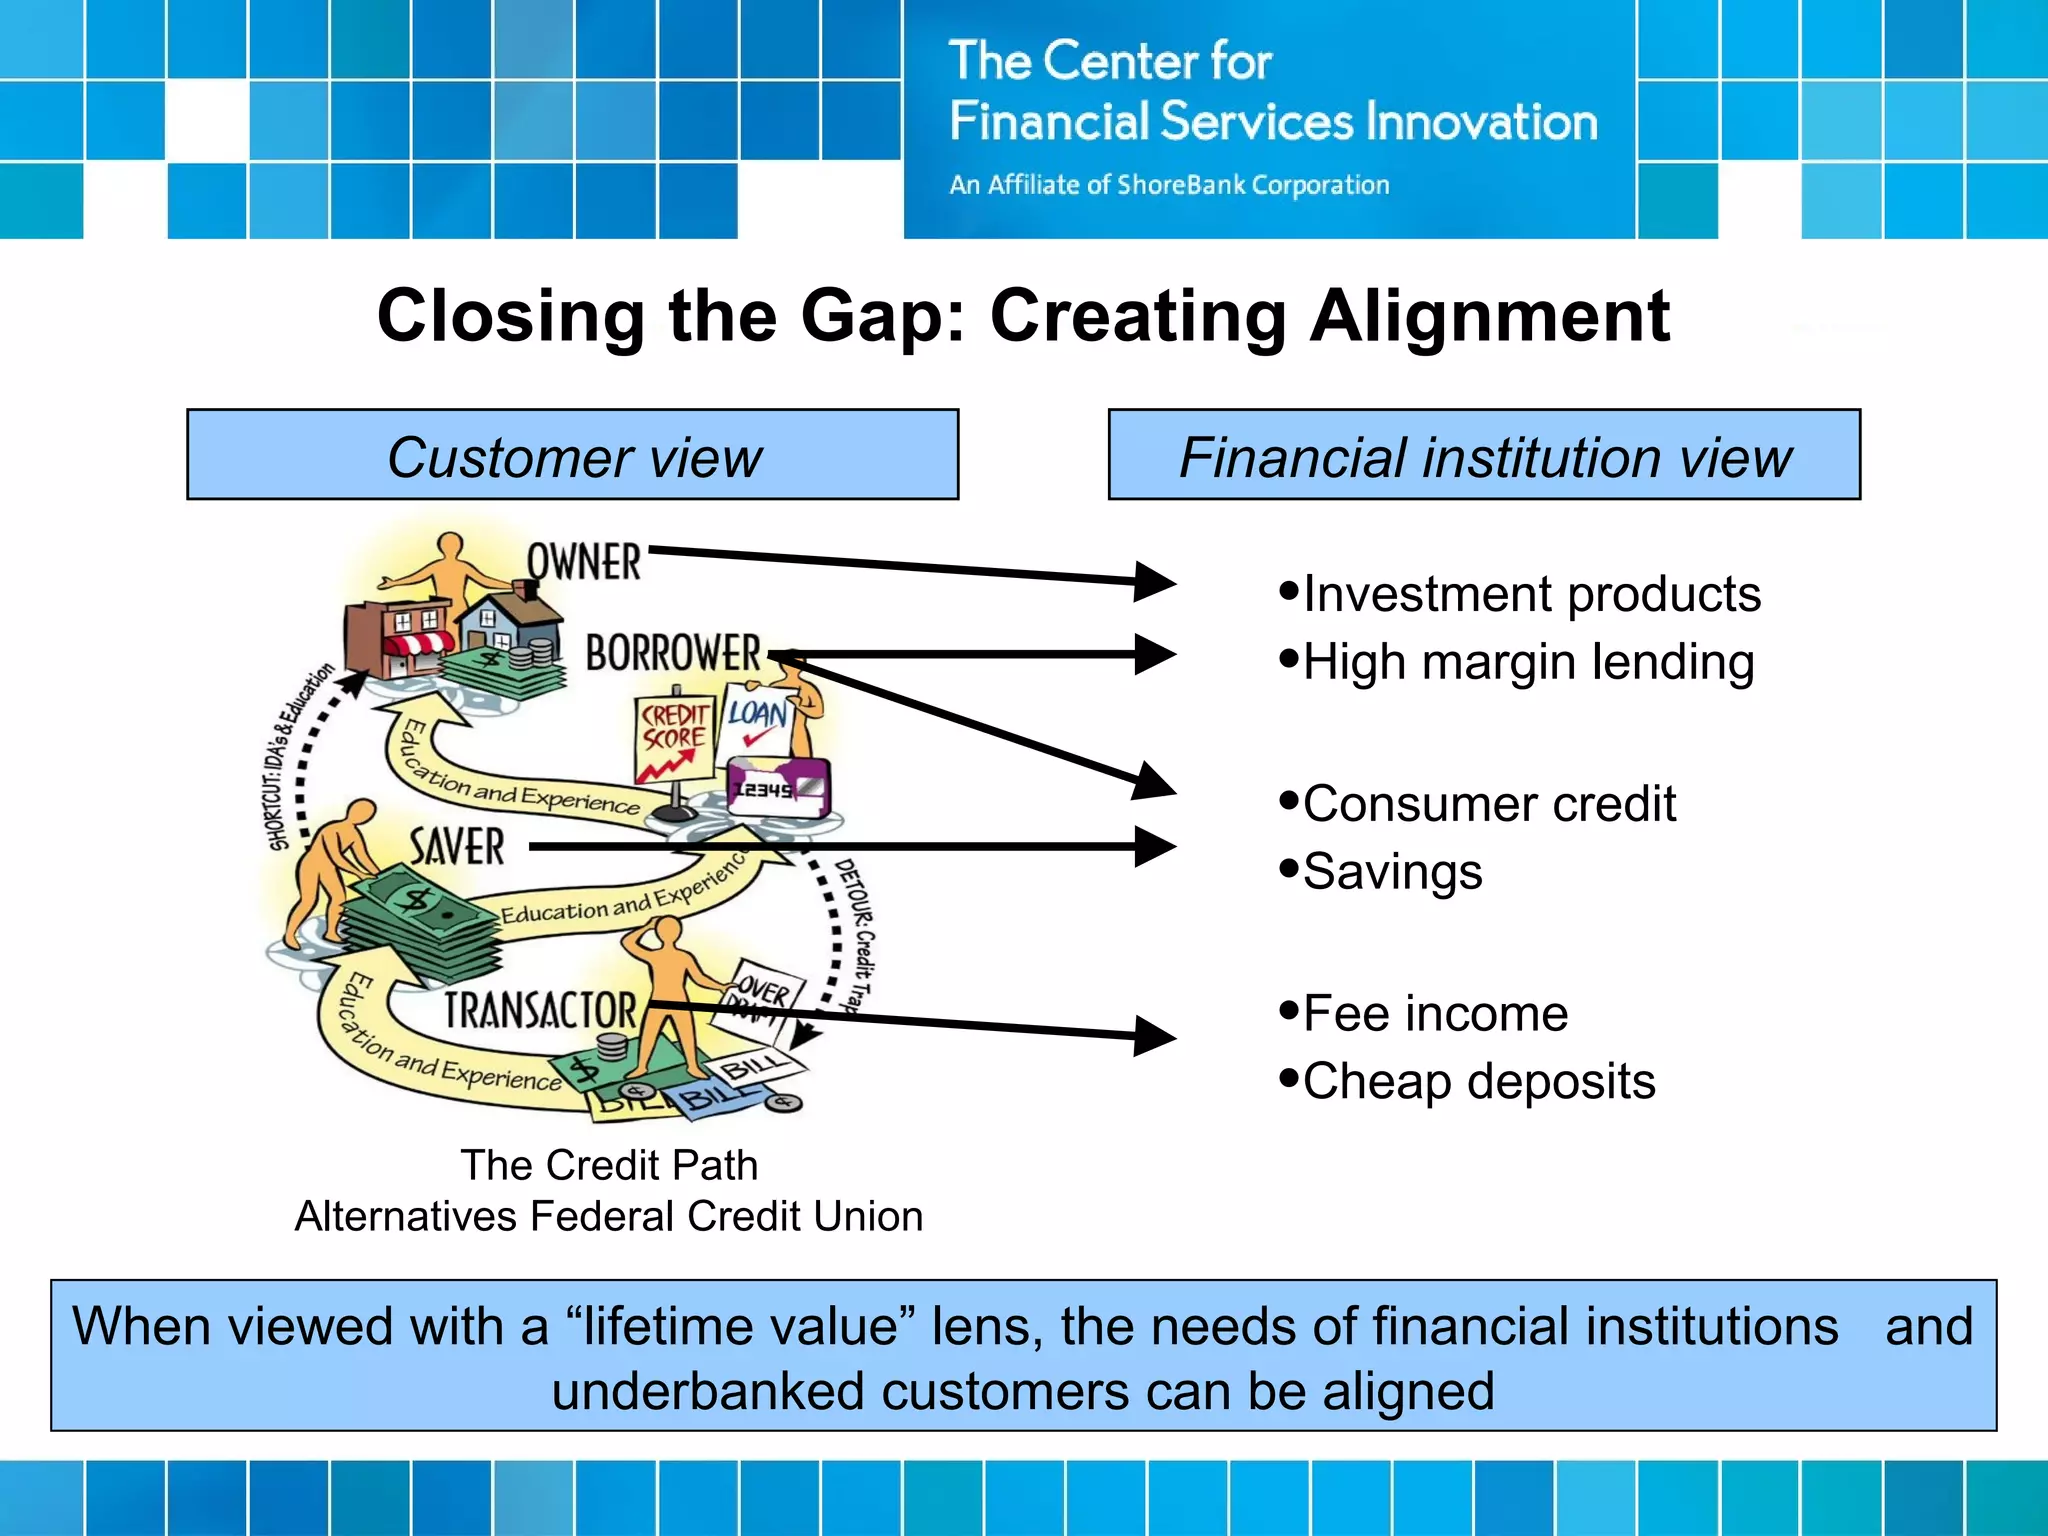
1) Analyzing specific market components and levels like production, exchange, and consumption to identify how to better align market and development goals
2) Identifying "levers" like costs, networks, and information flows that influence market behavior and can be adjusted through activities
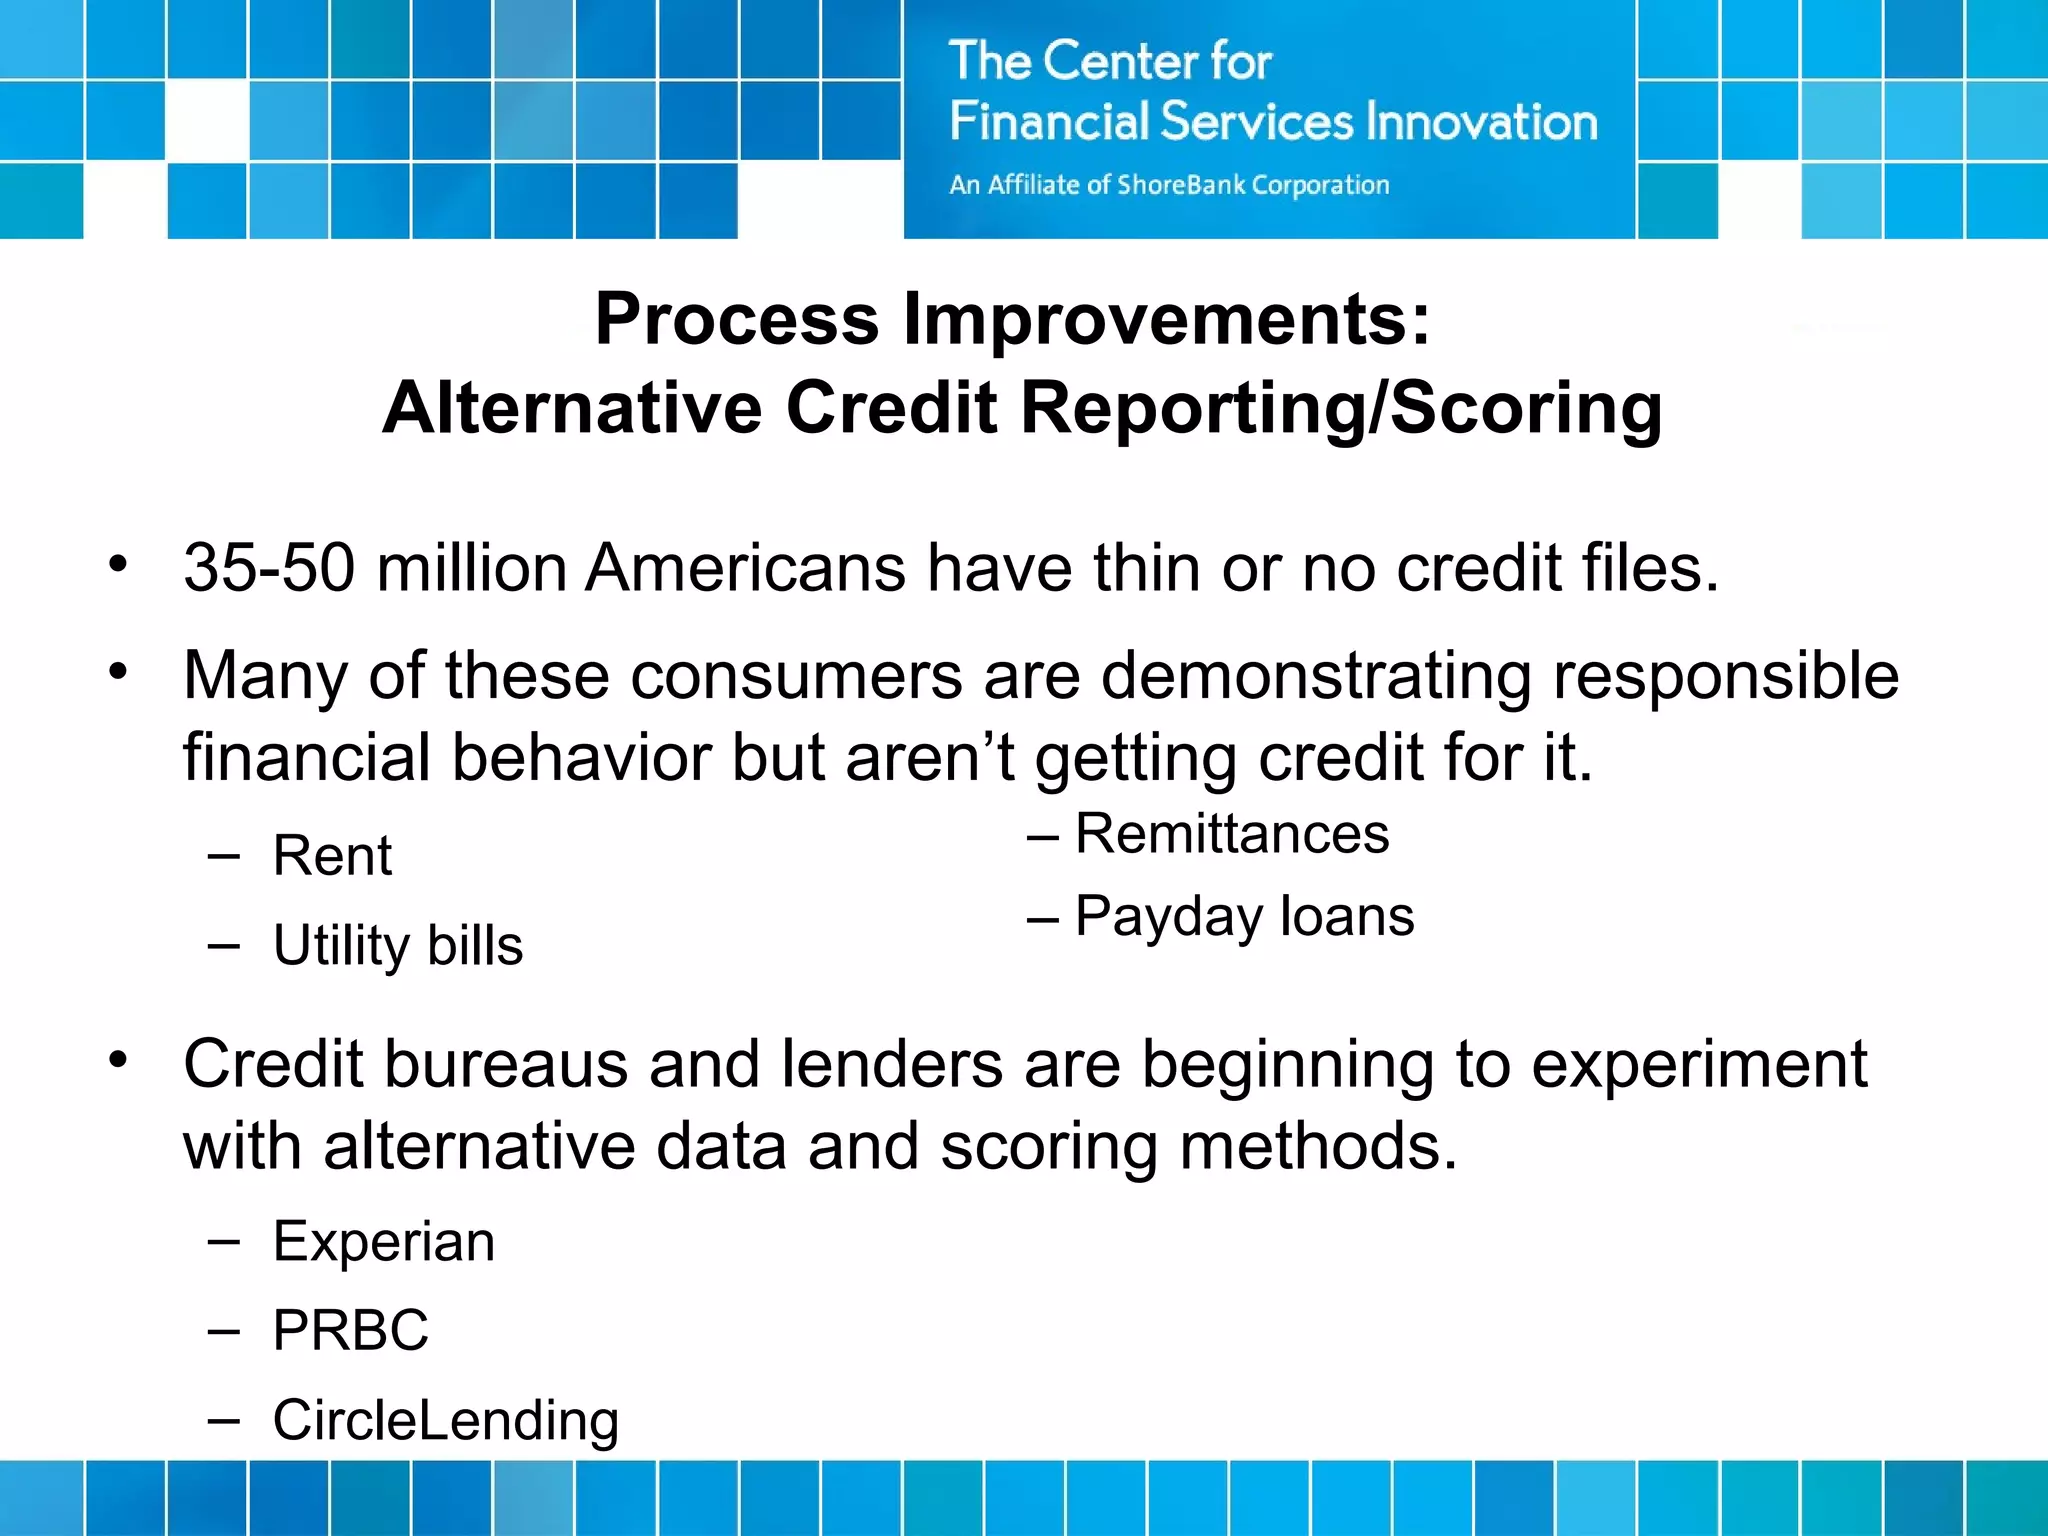
3) Choosing activities that target key market levels and levers, like providing alternative credit scoring to reduce risks for lenders.
The goal is to refine markets to include low-income communities by addressing market failures and expanding economic opportunities.


![Evaluating your ed efforts bc webinar [compatibility mode]](https://cdn.slidesharecdn.com/ss_thumbnails/evaluating-20your-20ed-20efforts-20-20bc-20webinar-20-5bcompatibility-20mode-5d-130724142906-phpapp02-thumbnail.jpg?width=640&height=640&fit=bounds)


