Download as PDF, PPTX


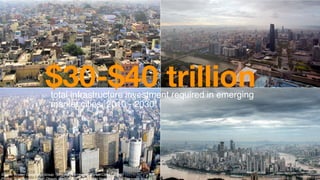
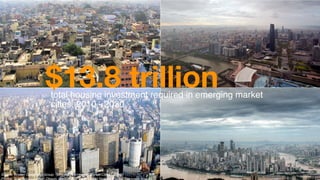
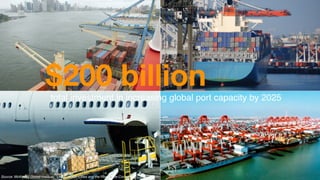


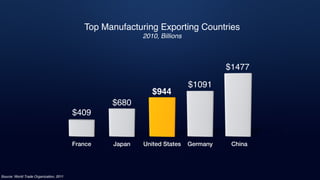


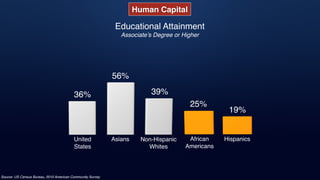


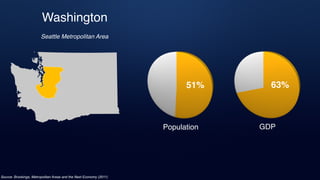
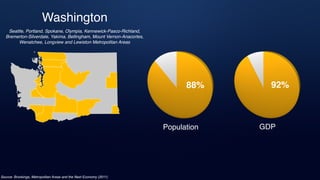

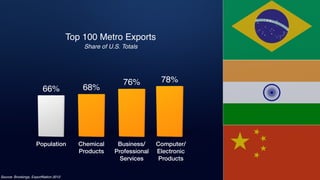


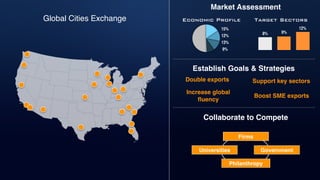


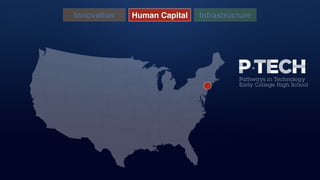

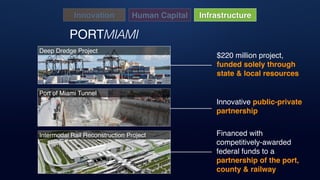


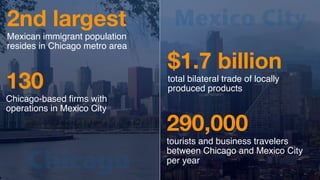


The Global Cities Initiative report highlights the need for increased job creation and improved job quality in metropolitan areas as they serve as centers of global trade and investment. It emphasizes the importance of innovation, human capital, and infrastructure in boosting economic growth and competitiveness. The report also identifies significant investments required in emerging market cities to support urban population growth and enhance trade capacity.


