
![22
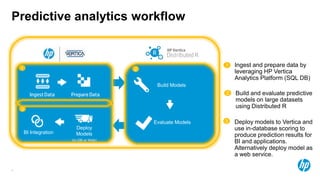
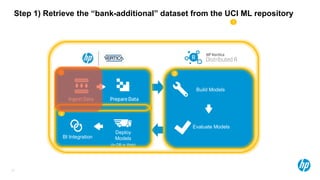
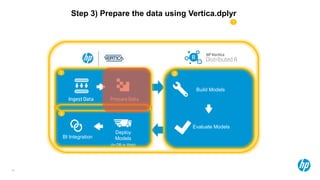
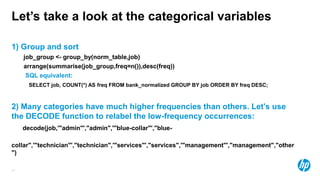
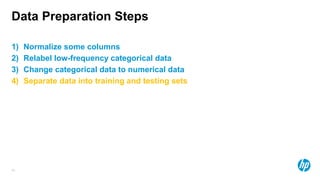
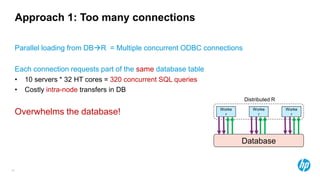
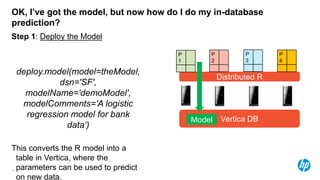
The Bank Marketing Dataset
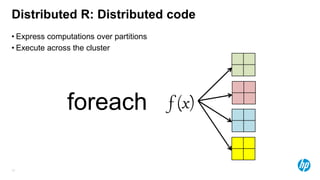
• Background
– A Portuguese banking institution runs a marketing campaign for selling long-term deposits and
collects data from clients they contact, covering various socioeconomic indicators.
– These data are from the years 2008-2013
– The predicted variable is whether or not the client subscribed to the service.
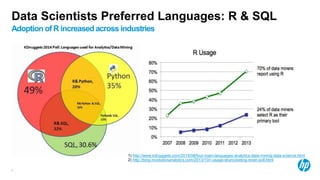
• 45,211 observations
• 17 input features of mixed numerical and categorical data
• Contact communication type (‘email’ vs.
‘phone’)
• Client education level
• Age
• Contact day-of-week
• Employment
• Has loans
• Number of days since last contact
• Contact Month
• Previous contact outcome
• Consumer Price Index
• Duration of Contact
• Others
Source: http://mlr.cs.umass.edu/ml/datasets/Bank+Marketing
[Moro et al., 2014] S. Moro, P. Cortez and P. Rita. A Data-Driven Approach to
Predict the Success of Bank Telemarketing. Decision Support Systems, Elsevier,
62:22-31, June 2014](https://image.slidesharecdn.com/2015-june-bigdata-la-150722205755-lva1-app6891/85/Big-Data-Day-LA-2015-Scalable-and-High-Performance-Analytics-with-Distributed-R-and-Vertica-by-Edward-Ma-of-HP-22-320.jpg)
![29
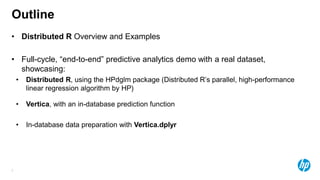
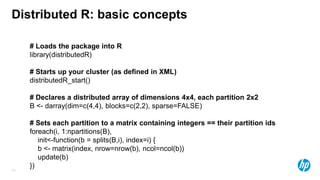
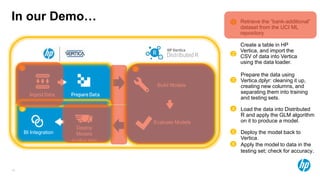
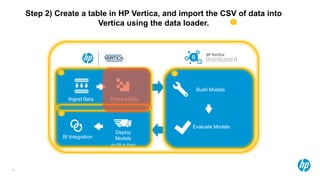
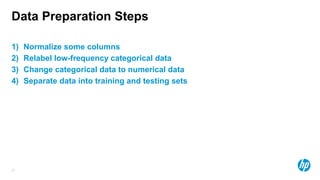
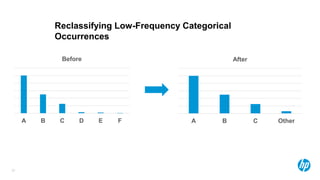
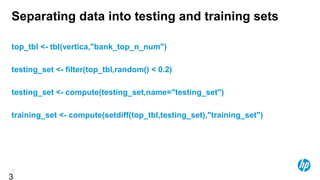
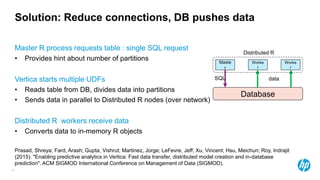
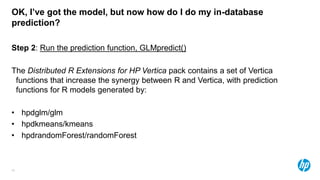
Computing the Z-Score
1) To normalize the data, we will compute the z-score for all quantitative variables.
𝒛 =
𝒙 − 𝝁
𝝈
1) For these features, we’ll first have to compute the mean and standard deviation.
m_sd <- summarise(orig,m_age=mean(age),std_age=sd(age) ….
summarise in dplyr collapses columns into aggregates.
3) Then we’ll need to convert the quantitative values into z_scores for every
observation
normalized <- mutate(orig,age_z=(age-z[["m_age"]])/z[["std_age"]] …..
mutate creates new columns – in this case, we are creating new columns to store](https://image.slidesharecdn.com/2015-june-bigdata-la-150722205755-lva1-app6891/85/Big-Data-Day-LA-2015-Scalable-and-High-Performance-Analytics-with-Distributed-R-and-Vertica-by-Edward-Ma-of-HP-29-320.jpg)


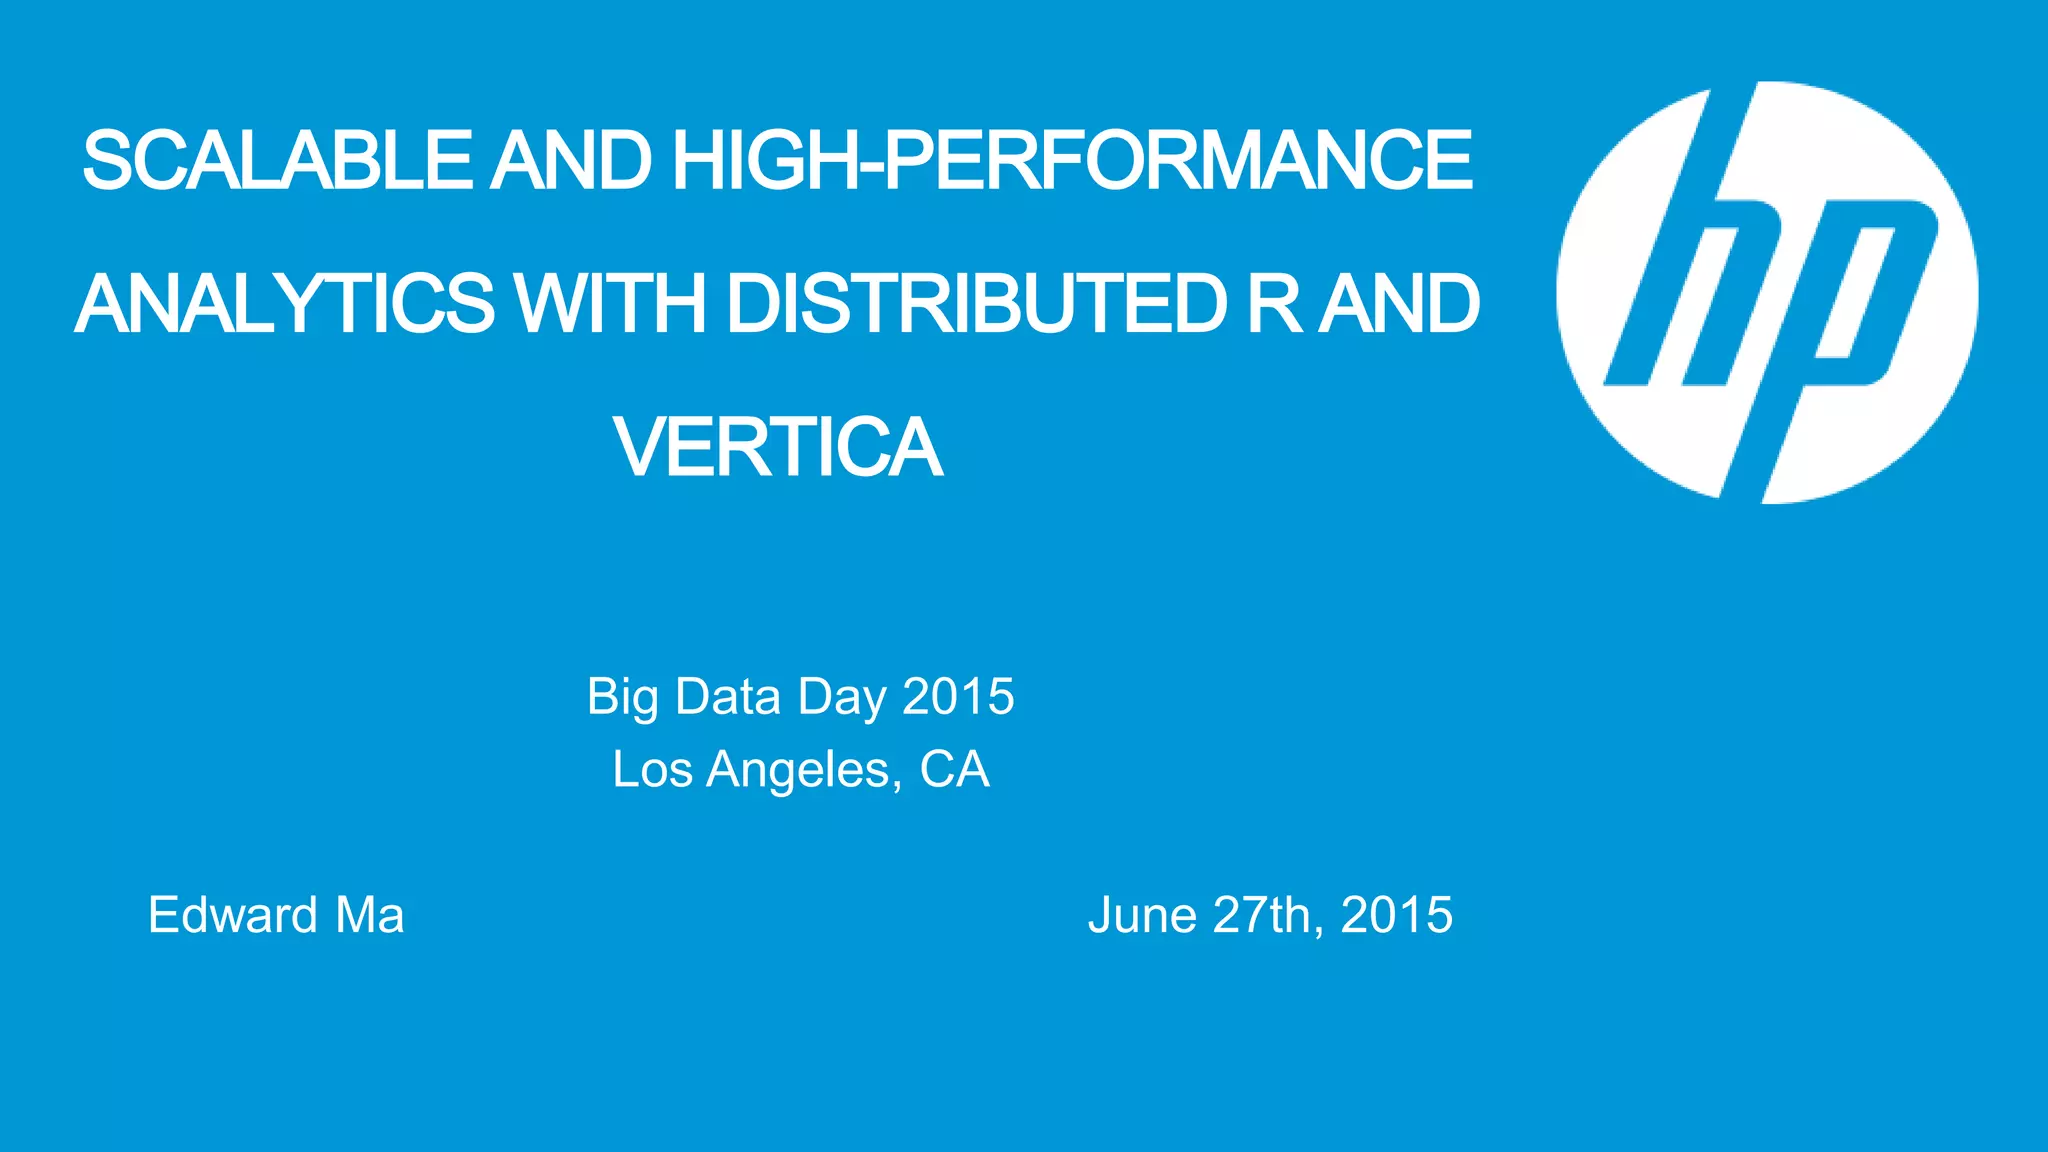
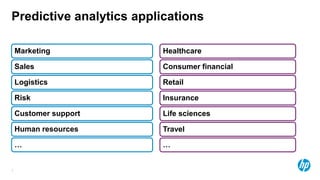
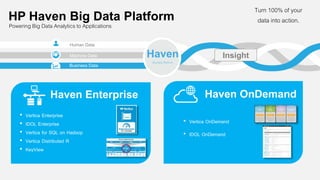
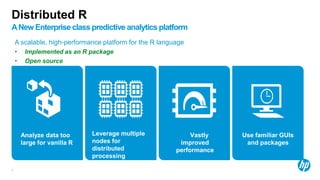
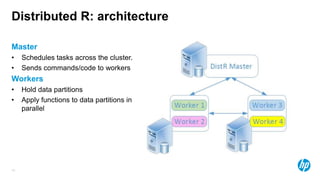
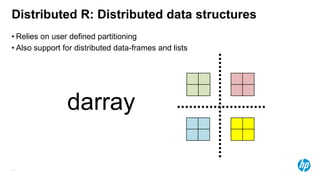
The document presents an overview of scalable and high-performance analytics using Distributed R and Vertica within the context of predictive analytics applications across various industries. It details the architecture, implementation, and operational workflow of Distributed R, emphasizing its improvements in data processing and model deployment capabilities. The document also highlights integration with Vertica for enhanced data analytics and in-database predictions, showcasing an end-to-end predictive analytics demo with a real dataset.