Downloaded 10 times
![Int. J. Environ. Res. Public Health 2014, 11 5171
Keywords: data quality; information quality; data use; data collection process; evaluation;
assessment; public health; population health; information systems
1. Introduction
Public health is “the science and art of preventing disease, prolonging life, and promoting physical
health and efficiency through organized community efforts” [1]. The ultimate goal of public health is
to improve health at the population level, and this is achieved through the collective mechanisms and
actions of public health authorities within the government context [1,2]. Three functions of public
health agencies have been defined: assessment of health status and health needs, policy development to
serve the public interest, and assurance that necessary services are provided [2,3]. Since data,
information and knowledge underpin these three functions, public health is inherently a data-intensive
domain [3,4]. High quality data are the prerequisite for better information, better decision-making and
better population health [5].
Public health data represent and reflect the health and wellbeing of the population, the determinants
of health, public health interventions and system resources [6]. The data on health and wellbeing
comprise measures of mortality, ill health, and disability. The levels and distribution of the
determinants of health are measured in terms of biomedical, behavioral, socioeconomic and
environmental risk factors. Data on public health interventions include prevention and health
promotion activities, while those on system resources encompass material, funding, workforce, and
other information [6].
Public health data are used to monitor trends in the health and wellbeing of the community and of
health determinants. Also, they are used to assess the risks of adverse health effects associated with
certain determinants, and the positive effects associated with protective factors. The data inform the
development of public health policy and the establishment of priorities for investment in interventions
aimed at modifying health determinants. They are also used to monitor and evaluate the
implementation, cost and outcomes of public health interventions, and to implement surveillance of
emerging health issues [6].
Thus, public health data can help public health agencies to make appropriate decisions, take
effective and efficient action, and evaluate the outcomes [7,8]. For example, health indicators set up
the goals for the relevant government-funded public health agencies [5]. Well-known health indicators
are the Millennium Development Goals (MDGs) 2015 for the United Nations member states [9]; the
European Core Health Indicators for member countries of the European Union [10]; “Healthy People” in
the United States, which set up 10-year national objectives for improving the health of US citizens [11];
“Australia: The Healthiest Country by 2020” that battles lifestyle risk factors for chronic disease [12];
and “Healthy China 2020”, an important health strategy to improve the public’s health in China [13].
Public health data are generated from public health practice, with data sources being population-based
and institution-based [5,6]. Population-based data are collected through censuses, civil registrations,
and population surveys. Institution-based data are obtained from individual health records and
administrative records of health institutions [5]. The data stored in public health information systems](https://image.slidesharecdn.com/2014reviewofdataqualityassessmentmethods-151014210318-lva1-app6892/75/2014-review-of-data-quality-assessment-methods-2-2048.jpg)
![Int. J. Environ. Res. Public Health 2014, 11 5172
(PHIS) must first undergo collection, storage, processing, and compilation. The procured data can then
be retrieved, analyzed, and disseminated. Finally, the data will be used for decision-making to guide
public health practice [5]. Therefore, the data flows in a public health practice lifecycle consist of three
phases: data, data collection process and use of data.
PHIS, whether paper-based or electronic, are the repositories of public health data. The systematic
application of information and communication technologies (ICTs) to public health has seen the
proliferation of computerized PHIS around the world [14–16]. These distributed systems collect
coordinated, timely, and useful multi-source data, such as those collected by nation-wide PHIS from
health and other sectors [17]. These systems are usually population-based, and recognized by
government-owned public health agencies [18].
The computerized PHIS are developed with broad objectives, such as to provide alerts and early
warning, support public health management, stimulate research, and to assist health status and trend
analyses [19]. Significant advantages of PHIS are their capability of electronic data collection, as well
as the transmission and interchange of data, to promote public health agencies’ timely access to
information [15,20]. The automated mechanisms of numeric checks and alerts can improve validity
and reliability of the data collected. These functions contribute to data management, thereby leading to
the improvement in data quality [21,22].
Negative effects of poor data quality, however, have often been reported. For example, Australian
researchers reported coding errors due to poor quality documentations in the clinical information
systems. These errors had consequently led to inaccurate hospital performance measurement,
inappropriate allocation of health funding, and failure in public health surveillance [23].
The establishment of information systems driven by the needs of single-disease programs may
cause excessive data demand and fragmented PHIS systems, which undermine data quality [5,24].
Studies in China, the United Kingdom and Pakistan reported data users’ lack of trust in the quality of
AIDS, cancer, and health management information systems due to unreliable or uncertain data [25–27].
Sound and reliable data quality assessment is thus vital to obtain the high data quality which
enhances users’ confidence in public health authorities and their performance [19,24]. As countries
monitor and evaluate the performance and progress of established public health indicators, the need for
data quality assessment in PHIS that store the performance-and-progress-related data has never been
greater [24,28,29]. Nowadays, data quality assessment that has been recommended for ensuring the
quality of data in PHIS becomes widespread acceptance in routine public health practice [19,24].
Data quality in public health has different definitions from different perspectives. These include:
“fit for use in the context of data users” [30], (p. 2); “timely and reliable data essential for public health
core functions at all levels of government” [31], (p. 114) and “accurate, reliable, valid, and trusted data
in integrated public health informatics networks” [32]. Whether the specific data quality requirements
are met is usually measured along a certain number of data quality dimensions. A dimension of data
quality represents or reflects an aspect or construct of data quality [33].
Data quality is recognized as a multi-dimensional concept across public health and other
sectors [30,33–35]. Following the “information chain” perspective, Karr et al. used “three
hyper-dimensions” (i.e., process, data and user) to group a set of conceptual dimensions of data
quality [35]. Accordingly, the methods for assessment of data quality must be useful to assess these
three dimensions [35]. We adopted the approach of Karr et al. because their typology provided a](https://image.slidesharecdn.com/2014reviewofdataqualityassessmentmethods-151014210318-lva1-app6892/75/2014-review-of-data-quality-assessment-methods-3-2048.jpg)
![Int. J. Environ. Res. Public Health 2014, 11 5173
comprehensive perspective for classifying data quality assessment. However, we replace “process” by
“data collection process” and “user” by “data use”. “Process” is a broad term and may be considered as
the whole process of data flows, including data and use of data. “User” is a specific term related to data
users or consumers and may ignore the use of data. To accurately reflect the data flows in the context
of public health, we define the three dimensions of data quality as data, data use and data collection
process. The dimension of data focuses on data values or data schemas at record/table level or database
level [35]. The dimension of data use, related to use and user, is the degree and manner in which data
are used [35]. The dimension of data collection process refers to the generation, assembly, description
and maintenance of data [35] before data are stored in PHIS.
Data quality assessment methods generally base on the measurement theory [35–38]. Each dimension
of data quality consists of a set of attributes. Each attribute characterizes a specific data quality
requirement, thereby offering the standard for data quality assessment [35]. Each attribute can be
measured by different methods; therefore, there is flexibility in methods used to measure data
quality [36–38]. As the three dimensions of data quality are embedded in the lifecycle of public health
practice, we propose a conceptual framework for data quality assessment in PHIS (Figure 1).
Figure 1. Conceptual framework of data quality assessment in public health practice.
Although data quality has always been an important topic in public health, we have identified a lack
of systematic review of data quality assessment methods for PHIS. This is the motivation for this study
because knowledge about current developments in methods for data quality assessment is essential for
research and practice in public health informatics. This study aims to investigate and compare the
methods for data quality assessment of PHIS so as to identify possible patterns and trends emerging
over the first decade of the 21st century. We take a qualitative systematic review approach using our
proposed conceptual framework.](https://image.slidesharecdn.com/2014reviewofdataqualityassessmentmethods-151014210318-lva1-app6892/75/2014-review-of-data-quality-assessment-methods-4-2048.jpg)
![Int. J. Environ. Res. Public Health 2014, 11 5175
function and scope of the PHIS, definition of data quality, methods for data quality assessment, study
design, data collection methods, data collected, research procedure, methods for data analysis, key
findings, conclusions and limitations.
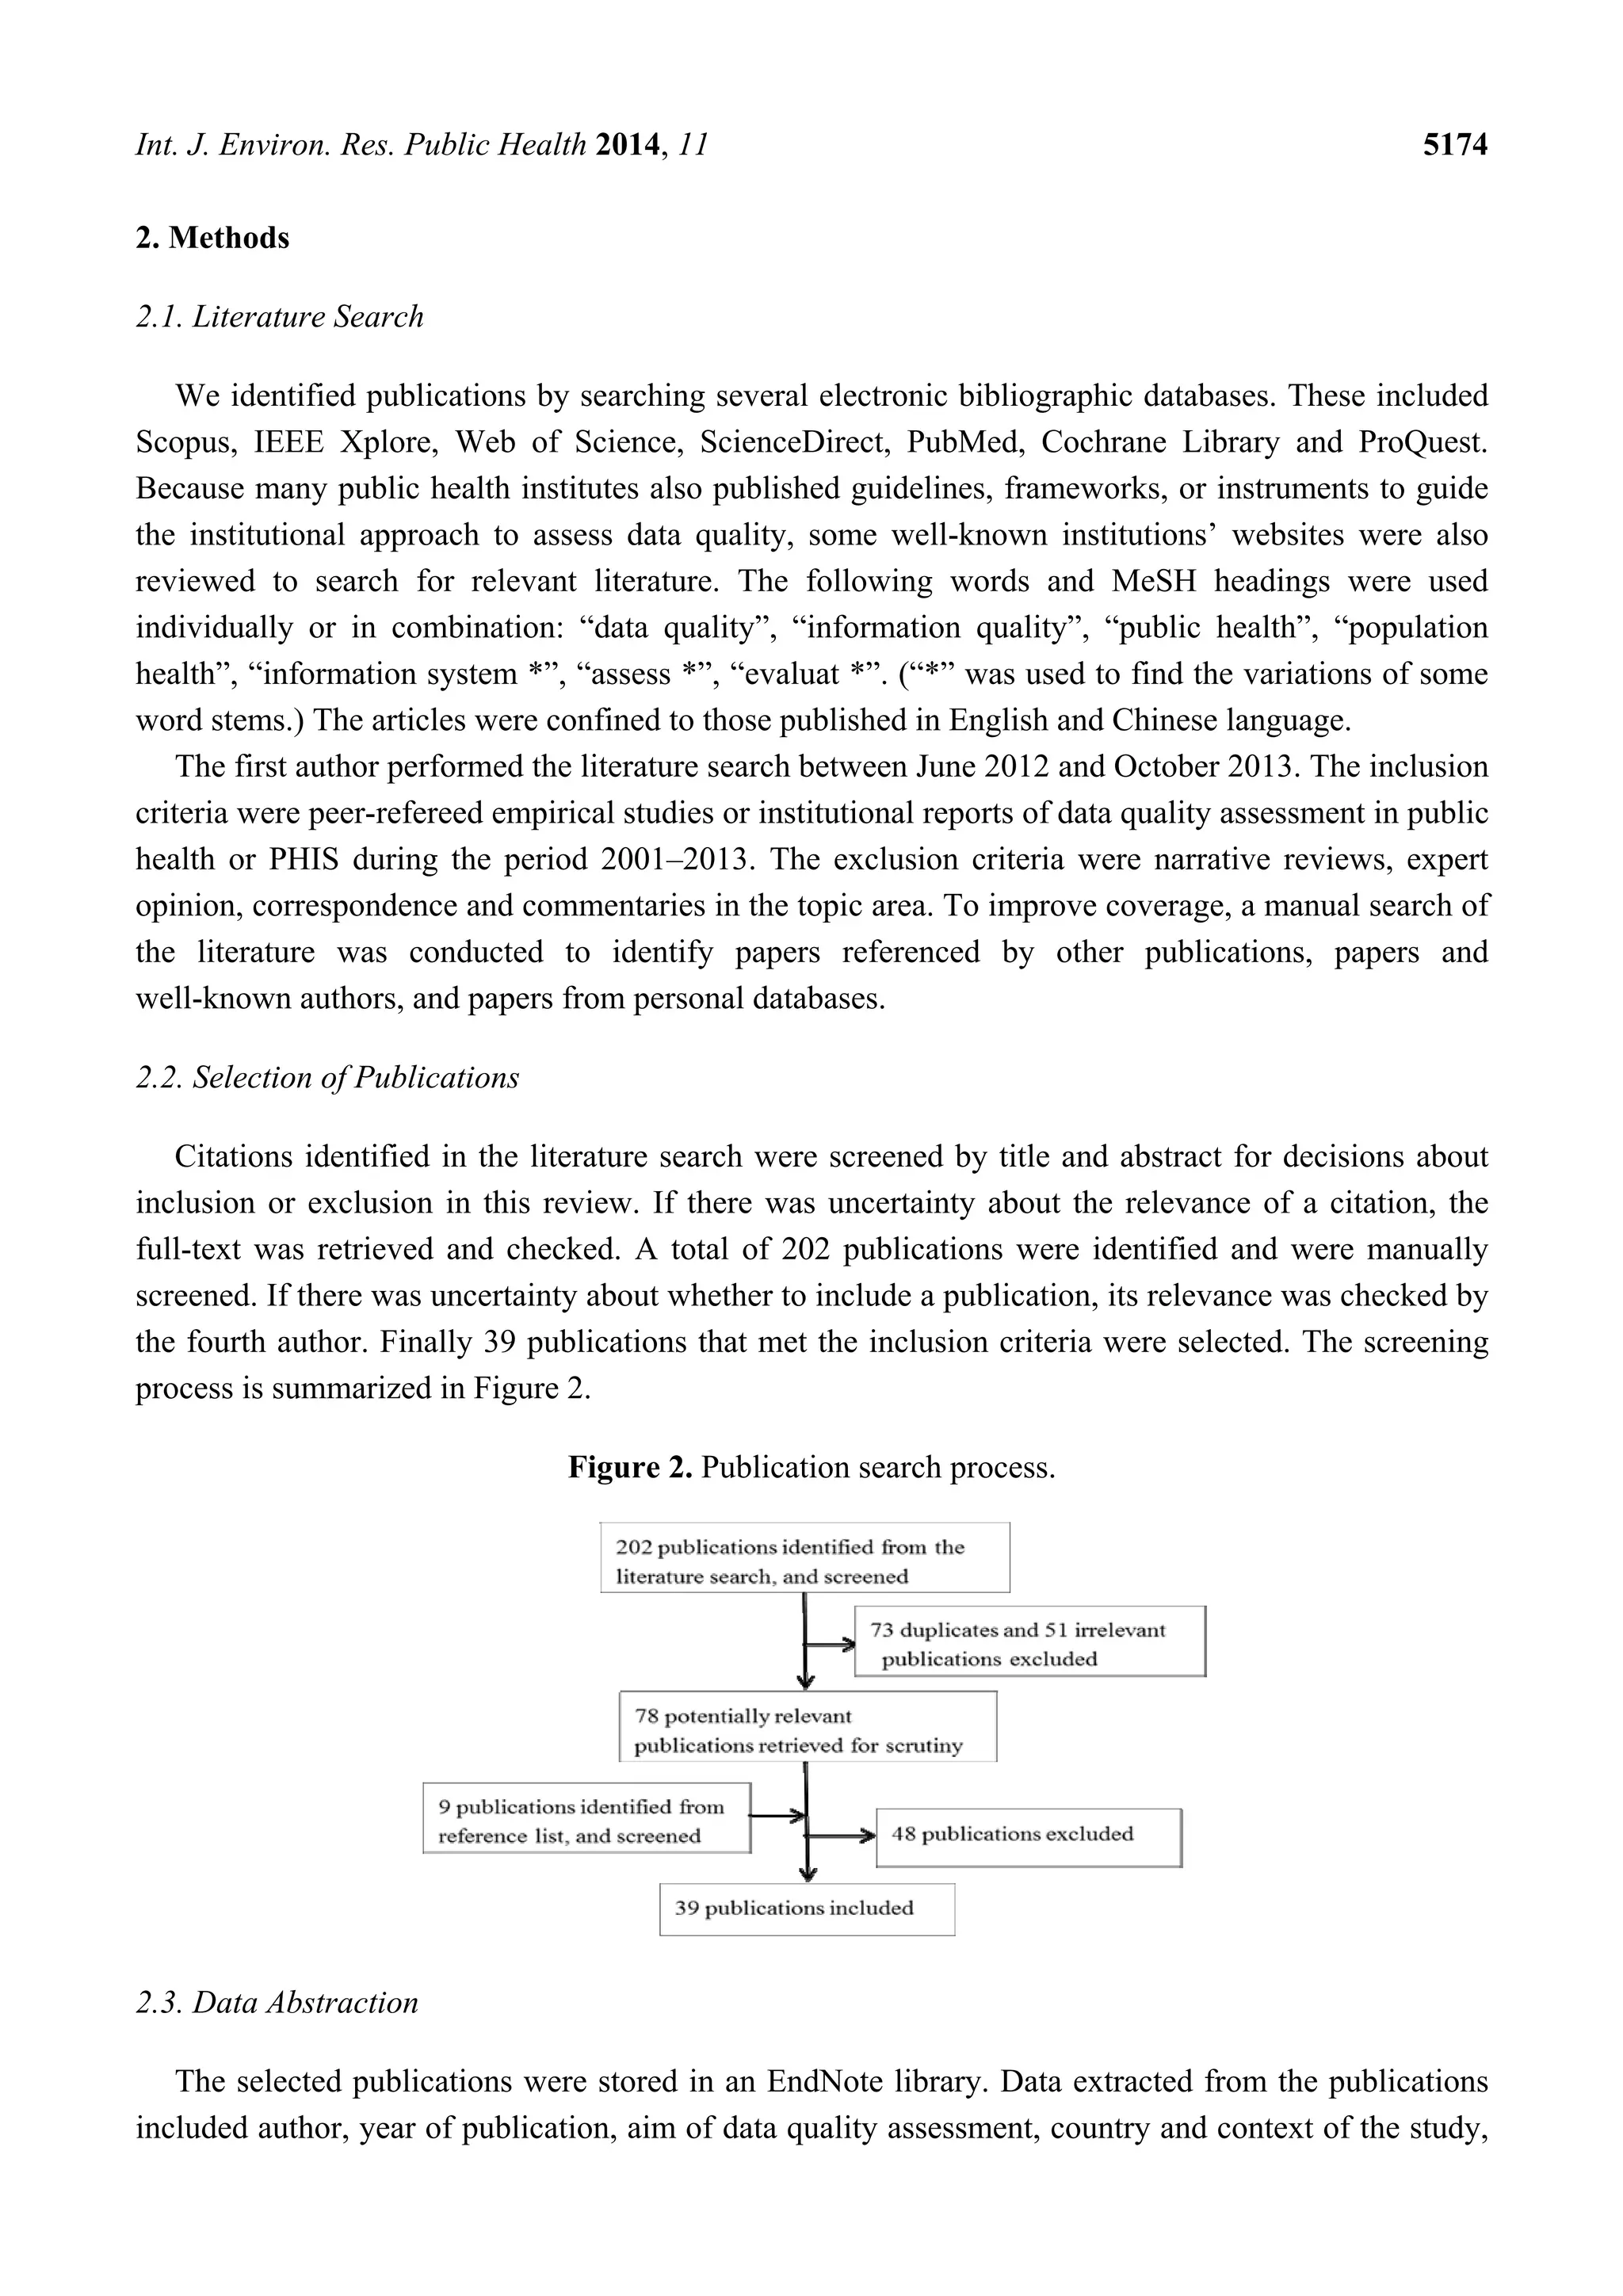
The 39 publications were placed in two groups according to whether they were published by a
public health institution at national or international level or by individual researchers. If the article was
published by the former, it is referred to as an institutional publication, if by the latter, as a research paper.
3. Results
Of the 39 publications reviewed, 32 were peer-refereed research papers and seven were published
by public health institutions. The institutional publications are listed in Table 1.
Table 1. Institutional data quality assessment publications.
Acronym Title Institution
CDC’s Guidelines [15]
Updated Guidelines for Evaluating
Public Health Surveillance Systems
United States Centers for Diseases
Control and Prevention
CIHI DQF [30] CIHI Data Quality Framework Canadian Institute for Health Information
ME DQA [34,39] * Data Quality Audit Tool MEASURE Evaluation Project
ME PRISM [40,41]
Performance of Routine Information
System Management Version 3.1
MEASURE Evaluation Project
WHO DQA [42,43]
The Immunization Data Quality
Audit (DQA)Procedure;
Immunization Data Quality
Self-assessment (WHO DQS) Tool
Department of Immunization
Vaccines and Biologicals,
World Health Organization
WHO DQRC [44]
Guide to the Health Facility Data
Quality Report Card
World Health Organization
WHO HMN [45]
Assessing the National Health
Information System An Assessment
Tool Version 4.00
Health Metrics Network,
World Health Organization
* ME DQA is adopted by the Global Fund to Fight AIDS, Tuberculosis and Malaria.
27 of the 39 reviewed publications were published between 2008 and 2013. There was a trend of
increasing numbers of research papers per year, suggesting an increasing research focus on data quality
with the wider adoption of computerised PHIS in recent years.
The results are organized as follows. First, the aims of the studies are given. This is followed by
context and scope identified in Section 3.2. Section 3.3 examines the methods for data quality
assessment. A detailed summary of the findings concludes the results in Section 3.4. For each section,
a comparison between institutional publications and research papers was conducted, where this was
possible and meaningful.
3.1. Aims of the Studies
The main aims of the studies are assessing the quality of data (19 publications [30,34,42,44,46–60])
and assessing the performance of the PHIS (17 publications [15,22,34,40,42,45,50,58,61–69]). Five
studies assessed data use and explored the factors influencing data use [26,27,52,70,71]. Four studies](https://image.slidesharecdn.com/2014reviewofdataqualityassessmentmethods-151014210318-lva1-app6892/75/2014-review-of-data-quality-assessment-methods-6-2048.jpg)
![Int. J. Environ. Res. Public Health 2014, 11 5176
investigated the facilitators and barriers for achieving high quality data and systems [22,40,59,65].
Three studies compared or developed methods for the improvement of data quality assessment or data
exchange [54,56,72]. Finally two studies assessed data flow [30,70].
The institutions tended to focus on the PHIS system and the data [15,30,34,40,42,44,45]. Data use,
comparison of different PHIS, identification of the factors related to poor data quality, and analysis of
data flow were also reported in research papers [22,26,27,52,54,56,59,61,65,70–73].
3.2. Context and Scope of the Studies
The contexts of the studies were primarily confined to the public health domain, with other settings
addressed occasionally.
Two types of public health context were covered in the institutional publications. The first included
specific disease and health events, such as AIDS, tuberculosis, malaria, and immunization [15,34,42].
The latter was the public health system. This included public health project/program data management and
reporting, routine health information systems, and PHIS under a national health institute [34,40,41,44,45].
Most research studies were conducted in disease-specific public health contexts. Ten were in the
maternal and children’s health setting, e.g., immunization, childbirth, maternal health and hand-foot-mouth
disease [47,53,56–58,68–70,72,73]. Another five were delivered in the context of HIV/AIDS
prevention and care [48,49,63,65,67]. Two studies were related to tuberculosis [46,61]. Other contexts
included multi-disease surveillance system, primary health care, acute pesticide poisoning, road data or
road safety, aboriginal health, monkey pox, and cancer [22,26,51,52,55,59,66,74]. In addition, clinical
information management was studied in four research papers [50,54,62,71]. National health management
information systems were studied in one publication [27].
The public health data from information systems operated by agencies other than public health were
also assessed. They include the National Coronial Information System managed by the Victorian
Department of Justice in Australia, women veteran mortality information maintained by the U.S.
Department of Veterans’ Affairs, and military disability data from U.S. Navy Physical Evaluation
Board [47,52,64].
The studies were conducted at different levels of the PHIS, including health facilities that deliver
the health service and collect data (e.g., clinics, health units, or hospitals), and district, provincial and
national levels where PHIS data are aggregated and managed. The institutions took a comprehensive
approach targeting all levels of PHIS [15,30,34,40,42,44,45]. Twenty-seven research studies were
conducted at a single level [22,26,46–57,59,61–64,66,68–74]. Of these, 14 were conducted at data
collection and entry level. The other 13 studies assessed the PHIS at management level. Only five
research papers covered more than one level of the system [27,58,60,65,67], two of which were
multi-country studies [58,67]. Lin et al. studied the surveillance system at national level, provincial
level, and at surveillance sites [65].
3.3. Methods for Data Quality Assessment
Analysis of methods for data quality assessment in the reviewed publications is presented in three
sections, based on the dimensions of data quality that were covered: data, data use or data collection
process. Seven perspectives were reviewed, including quality attributes for each dimension, major](https://image.slidesharecdn.com/2014reviewofdataqualityassessmentmethods-151014210318-lva1-app6892/75/2014-review-of-data-quality-assessment-methods-7-2048.jpg)
![Int. J. Environ. Res. Public Health 2014, 11 5177
measurement indicators for each attribute, study design/method of assessment, data collection
methods, data analysis methods, contributions and limitations.
3.3.1. Methods for Assessment of the Dimension of Data
In this section, the concept of data quality is a narrow one, meaning the quality of the dimension of
data. All of the institutional publications and 28 research papers, a total of 35 articles, conducted
assessment of the quality of data [15,22,30,34,40,42,44–69,72–74]. Matheson et al. introduced the
attributes of data quality but did not give assessment methods [71]. Additional information is provided
in Table A1.
Quality Attributes of Data and Corresponding Measures
A total of 49 attributes were used in the studies to describe data quality, indicating its multi-dimensional
nature. Completeness, accuracy and timeliness were the three attributes measured most often.
Completeness was the most-used attribute of data quality in 24 studies (5 institutional and 19 research
publications) [15,22,34,40,42,44,46,48–51,54,57,61–66,68,69,72–74]. This was followed by accuracy,
in 5 institutional and 16 research publications [15,30,34,40,42,46,48–53,56–58,63–65,69,72,74].
The third most-used attribute, timeliness, was measured in 5 institutional and 4 research
publications [22,30,40,42,44,45,64,69,73].
The attributes of data quality are grouped into two types: those of good data quality and those of
poor data quality (see Table 2).
Table 2. Attributes of data quality.
Item Attribute
High data
quality (38)
Completeness, accuracy or positional accuracy, timeliness or up-datedness or currency,
validity, periodicity, relevance, reliability, precision, integrity, confidentiality or data
security, comparability, consistency or internal consistency or external consistency,
concordance, granularity, repeatability, readily useableness or usability or utility, objectivity,
ease with understanding, importance, reflecting actual sample, meeting data standards, use of
standards, accessibility, transparency, representativeness, disaggregation, data collection
method or adjustment methods or data management process or data management
Poor data
quality (11)
Missing data, under-reporting, inconsistencies, data errors or calculation errors or errors in
report forms or errors resulted from data entry, invalid data, illegible hand writing,
non-standardization of vocabulary, and inappropriate fields
Inconsistencies in the definition of attributes were identified. The same attribute was sometimes
given different meanings by different researchers. One example of this was “completeness”. Some
institutions required conformity to the standard process of data entry, such as filling in data elements in
the reporting forms [15,40,41,44]. Completeness was represented as the percentage of blank or unknown
data, not zero/missing, or proportion of filling in all data elements in the facility report form [15,40,41,44].
The ME PRISM, instead, defined completeness as the proportion of facilities reporting in an
administrative area [40]. The other definition of completeness was the correctness of data collection
methods in ME DQA, i.e., “complete list of eligible persons or units and not just a fraction of the list” [34].](https://image.slidesharecdn.com/2014reviewofdataqualityassessmentmethods-151014210318-lva1-app6892/75/2014-review-of-data-quality-assessment-methods-8-2048.jpg)
![Int. J. Environ. Res. Public Health 2014, 11 5178
Of the 19 research papers including completeness as an attribute, 12 measured the completeness of
data elements as “no missing data or blank” [22,46,48–51,57,63,69,72–74]. Dixon et al. defined
completeness as considering both filling in data elements and data collection methods [54].
Four studies measured completeness of data by the sample size and the percentage of health facilities that
completed data reports [61,65,66,68]. The remaining two studies did not give precise definitions [51,64].
On the other hand, different attributes could be given the same meaning. For example, the ME DQA
defined accuracy as “validity”, which is one of two attributes of data quality in CDC’s Guidelines [15,34].
Makombe et al. considered that data were accurate if none of the examined variables in the site report
was missing [49]. This is similar to the definition of completeness, as “no missing data” or “no blank
of data elements” in the reports by other studies.
Study Design
Quantitative methods were used in all studies except that of Lowrance et al. who used only
qualitative methods [63]. Retrospective, cross-sectional survey was commonly used for quantitative
studies. Pereira et al. conducted a multi-center randomized trial [72].
Qualitative methods, including review of publications and documentations, interviews with key
informants, and field observations, were also used in 8 studies [34,45,50,57,61,65,69,72]. The purpose
of the application of qualitative methods was primarily to provide the context of the findings from the
quantitative data. For example, Hahn et al. conducted a multiple-case study in Kenya to describe
clinical information systems and assess the quality of data. They audited a set of selected data tracer
items, such as blood group and weight, to assess data completeness and accuracy. Meanwhile, they
obtained end-users’ views of data quality from structured interviews with 44 staff members and
qualitative in-depth interviews with 15 key informants [50].
The study subjects varied. In 22 publications, the study subjects were entirely
data [15,42,44,46–49,51–56,58–60,64,66–68,73,74]; in four of these publications, they were entirely
users or stakeholders of the PHIS [30,45,62,63]. Three publications studied both the data and the
users [22,50,72]. Study subjects in research included data and documentations by Dai et al. [69]; data,
documentation of instructions, and key informants in four studies [34,40,57,61]; and data, user,
documentations of guidelines and protocols, and the data collection process by Lin et al. [65]. Both
data and users as study subjects were reported in eight publications [22,34,40,50,57,61,65,72].
The sampling methods also varied. Only the study by Clayton et al. calculated sample size and
statistical power [56]. Freestone et al. determined the sample size without explanation [52]. One study used
two-stage sampling [56]. Ten studies used multi-stage sampling methods [22,34,42,48,52,55,56,58,68,72].
The rest used convenience or purposive sampling. The response rates were reported in two studies [62,72].
The data collection period ranged from one month to 16 years [67,74]. The study with the shortest
time frame of one month had the maximum number of data records, 7.5 million [67], whereas the
longest study, from 1970 to 1986, collected only 404 cases of disease [74]. The sample size of users
ranged from 10 to 100 [45,61].](https://image.slidesharecdn.com/2014reviewofdataqualityassessmentmethods-151014210318-lva1-app6892/75/2014-review-of-data-quality-assessment-methods-9-2048.jpg)
![Int. J. Environ. Res. Public Health 2014, 11 5179
Data Collection Methods
Four methods were used individually or in combination in data collection. These were: field
observation, interview, structured and semi-structured questionnaire survey, and auditing the existing
data. Field observation was conducted using checklist and rating scales, or informal observations on
workplace walkthroughs [34,40,50,65]. Open, semi-structured or structured interviews were used when
the study subjects were users or stakeholders of the PHIS [30,40,45,50,57,61–63,65]. Auditing was
used in directly examining existing datasets in PHIS, looking for certain data elements or variables.
The benchmarks used for auditing included: in-house-defined data standards, international or national gold
standards, and authoritative datasets [15,40,42,44,46,48,49,51–56,58,59,64,66–68,72–74]. The effect of
auditing was enhanced by field observations to verify the accuracy of data sets [34,40,42,50,58,65].
Data Analysis Methods
Data analysis methods were determined by the purpose of the study and the types of data collected.
For the quantitative data, descriptive statistics were often used. For example, continuous data were
usually analyzed by the value of percentage, particularly for the data about completeness and
accuracy, to ascertain whether they reached the quality standards. This method was most often used in
24 papers [22,34,40,42,44,46–50,52–59,64–66,68,72,73]. Plot chart, bubble scatter chart, and
confidence intervals were also used in two studies [52,68]. Other common statistical techniques
included: correlation relationship, the Chi-square test, and the Mann–Whitney test [56,58,68]. The
geographic information system technique was reported in 3 studies [51,52,74]. Seven studies reported
the use of questionnaires or checklists with a Likert scale or a yes/no tick, as well as simple,
summative and group scoring methods [30,34,40,45,58,61,62].
In the publications with data as the study subject, a certain number of data variables were selected,
but the reason(s) for the section was (were) not always given. They included elements of demographics
such as age, gender, and birth date, and specific information such as laboratory testing results, and
disease code. The minimum and maximum number of data variables was 1 and 30, respectively [58,59].
The qualitative data were transcribed first before semantic analysis by theme grouping methods [63].
3.3.2. Methods for Assessment of the Dimension of Data Use
Ten studies, including one institutional publication and nine research papers, are reviewed in this
section [26,27,40,45,50,52,61,62,70,71]. Five studies were concerned with the assessment of data use
and the factors influencing data use [26,27,52,70,71]. The other five included assessment of data use,
but this was not always highlighted [40,45,50,61,62]. Details are given in Table A2.
Quality Attributes of Data Use and Corresponding Measures
A total of 11 attributes were used to define the concept of data use. These were: trend in use, use of
data or use of information, system use or usefulness of the system, intention to use, user satisfaction,
information dissemination or dissemination of data, extent of data source recognition and use or
specific uses of data, and existence and contents of formal information strategies and routines.](https://image.slidesharecdn.com/2014reviewofdataqualityassessmentmethods-151014210318-lva1-app6892/75/2014-review-of-data-quality-assessment-methods-10-2048.jpg)
![Int. J. Environ. Res. Public Health 2014, 11 5180
The measures fall into three categories: data use for the purpose of action, planning and research;
strategies and mechanisms of data use; and awareness of data sources and data use.
The first category of measures was mentioned in eight studies [26,40,45,50,52,61,70,71].
For example, actioned requests from researchers, the number of summaries/reports produced, and the
percentage of report use [40,52,71]. Freestone et al. calculated actioned requests from researchers who
do not have access to the PHIS [52]. The measurement indicators in ME PRISM were report
production and display of information. They were assessed by whether and how many reports
containing data from the PHIS were compiled, issued, fed back and displayed for a set time frame [40].
Saeed et al. assessed the use of data by predefined criteria, including the availability of comprehensive
information, whether data were used for planning and action at each level, and whether feedback was
given to the lower organizational level of the public health system [61].
The second category of measures was assessed in five studies [26,27,45,61,70]. The criteria of the
measurement included the availability of a feedback mechanism, policy and advocacy, the existence
and the focus of formal information strategies, and routines of data use [26,45,70].
The third category measured users’ awareness of data use which was reported in two studies [26,62].
Petter and Fruhling applied the DeLone and McLean information systems success model [62]. They
used the framework to evaluate system use, intention to use, and user satisfaction in 15 questions by
considering the context of the PHIS, which was an emergency response medical information system.
Wilkinson and McCarthy recommended examining whether the studied information systems were
recognized by the users in order to assess the extent of data source recognition among respondents [26].
Study Design
Three studies only used quantitative methods [40,52,62] and three studies only used qualitative
methods [27,50,70]. The remaining four studies combined qualitative and quantitative
methods [26,45,61,71]. Interviews, questionnaire surveys, reviews of documentation and abstracts of
relevant data were used in the studies.
Data Collection Methods
The sources of information for the study subjects included users and stakeholders, existing
documents, and data from the PHIS. Study subjects were all users in six studies [26,27,45,50,62,70],
and all data in the study by Freestone et al. [52]. Both user and documentation were study subjects in
two studies [40,61], and together with data in another study [71]. Convenience or purposive sampling
was generally used.
Among nine studies whose study subjects were users, structured and semi-structured questionnaire
surveys, group discussions, and in-depth interviews were used to collect data. Use of self-assessment,
face-to-face communication, telephone, internet telephony, online, email, facsimile and mail were
reported in the studies. For example, Wilkinson and McCarthy used a standardized semi-structured
questionnaire for telephone interviews with key informants [26]. Petter and Fruhling used an online
survey as well as facsimile and mail to the PHIS users [62]. Qazi and Al administered in-depth,
face-to-face and semi-structured interviews with an interview guide [27]. Saeed et al. predefined each
criterion for data use and measured it by a 3-point Likert scale. They assessed each criterion through](https://image.slidesharecdn.com/2014reviewofdataqualityassessmentmethods-151014210318-lva1-app6892/75/2014-review-of-data-quality-assessment-methods-11-2048.jpg)
![Int. J. Environ. Res. Public Health 2014, 11 5181
interviewing key informants and consulting stakeholders. Desk review of important documents, such
as national strategic plans, guidelines, manuals, annual reports and databases was also reported in their
study [61].
Four studies assessing data use by data and documentation either queried information directly from
the data in the studied PHIS, if applicable, or collected evidence from related documents such as
reports, summaries, and guidelines [40,52,61,71]. The data to be collected included actioned requests,
the number of data linked to action, and the number of data used for planning. Time for data collection
varied without explanation, such as 12 months in ME PRISM or six years by Freestone et al. [40,52].
Data Analysis Methods
The data collected from qualitative studies were usually processed manually, organized thematically
or chronologically. They were either analyzed by classification of answers, grouping by facility or
respondent’s role, or categorization of verbatim notes into themes.
Various strategies were applied for quantitative data. For example, Wilkinson and McCarthy
counted the same or similar responses to indicate frequency of beliefs/examples across participants [26].
Data in their study were analyzed individually, by role and aggregated level. Some correlational
analyses, such as Pearson’s r for parametric data and Spearman’s Rho for non-parametric data, were
conducted to identify possible relationships between data use, perceptions of data, and organizational
factors. Petter and Fruhling conducted hypothesis analysis in structured questionnaire with a 7-point
Likert scale for all quantitative questions [62]. Due to the small sample size of 64 usable responses,
they used summative scales for each of the constructs. All of the items used for a specific construct
were averaged to obtain a single value for this construct. Then, using this average score, each
hypothesis was tested using simple regression.
3.3.3. Methods for Assessment of the Dimension of Data Collection Process
Although the aim of assessing data flow or the process of data collection was only stated in
two studies, another 14 articles were found that implicitly assessed data collection
process [22,30,34,40,42,45,50,52,55,58–60,65,67,69,70]. These articles were identified through a
detailed content analysis. For example, data collection process assessment activities were sometimes
initiated by identification of the causes of poor data quality [52,55,59]. Or data collection process was
considered as a component of the evaluation of the effectiveness of the system [22,34,42,45,58,60,65,69].
Three studies led by two institutions, CIHI and MEASURE Evaluation Project, assessed data
collection process while conducting assessment of the quality of the data, [30,40,50]. Details are given
in Table A3.
Quality Attributes of Data Collection Process and Corresponding Measures
A total of 23 attributes of data collection process were identified. These were: quality index or
quality scores or functional areas, root causes for poor data quality, metadata or metadata
documentation or data management or case detection, data flow or information flow chart or data
transmission, data collection or routine data collection or data recording or data collection and](https://image.slidesharecdn.com/2014reviewofdataqualityassessmentmethods-151014210318-lva1-app6892/75/2014-review-of-data-quality-assessment-methods-12-2048.jpg)
![Int. J. Environ. Res. Public Health 2014, 11 5182
recording processes or data collection procedures, data quality management or data quality control,
statistical analysis or data compilation or data dissemination, feedback, and training.
Only four studies explicitly defined the attributes of the dimension of data collection process,
two of them from institutions [40,45,52,70]. Data collection was the most-used attribute in six
publications [34,40,52,65,67,69,70]. The next most-assessed attribute is data management processes or
data control reported in four publications [34,45,67,69].
Data collection process was sometimes considered a composite concept in six studies, four of them
proposed by institutions [30,34,42,45,58,60]. For example, the quality index/score was composed of
five attributes: recording practices, storing/reporting practices, monitoring and evaluation, denominators,
and system design (the receipt, processing, storage and tabulation of the reported data) [42,58,60].
Metadata documentation or metadata dictionary cover dataset description, methodology, and data
collection, capture, processing, compilation, documentation, storage, analysis and dissemination [30,45].
The ME DQA assessed five functional areas, including structures, functions and capabilities, indicator
definitions and reporting guidelines, data collection and reporting forms and tools, data management
processes, and links with the national reporting system [34].
Study Design
Seven studies only used qualitative methods [50,52,55,59,65,69,70], five only conducted
quantitative research [22,30,40,58,67], and four used both approaches [34,42,45,60]. Questionnaire
surveys were reported in 10 papers [22,30,34,40,42,45,58,60,67,70]. Interviews were conducted in
3 studies [34,50,70]. Focus group approaches, including consultation, group discussion, or meeting
with staff or stakeholders, were reported in four studies [45,52,59,65]. Review of documentation was
conducted in five papers [34,40,52,55,69], and field observation was used in five studies [34,40,50,52,65].
Data Collection and Analysis Methods
The study subjects included managers or users of the PHIS, the documentation of instructions and
guidelines of data management for the PHIS, and some procedures of data collection process.
The study subjects were entirely users in eight studies [22,30,40,45,58,59,67,70]. Corriols et al. and
Dai et al. only studied documentation such as evaluation reports on the PHIS including deficiency in
the information flow chart and non-reporting by physicians [55,69]. Data collection process was
studied in six publications [34,45,50,52,60,65]. Of these, four studies combined data collection
procedures with users and documentation [34,42,52,65], while Hahn et al. only observed data
collection procedures and Ronveaux et al. surveyed users and observed data collection procedures for
a hypothetical population [50,60].
The data collection methods included field observation, questionnaire surveys, consensus
development, and desk review of documentation. Field observations were conducted either in line with
a checklist or in an informal way [34,40,50,52,60,65]. Lin et al. made field observations of the
laboratory staff dealing with specimens and testing at the early stage of the data collection process [65].
Freestone et al. observed data coders’ activities during the process of data geocoding and entry [52].
Hahn et al. followed the work-through in study sites [50]. WHO DQA conducted field observations on
sites of data collection, processing and entry [42], while Ronveaux et al. observed workers at the](https://image.slidesharecdn.com/2014reviewofdataqualityassessmentmethods-151014210318-lva1-app6892/75/2014-review-of-data-quality-assessment-methods-13-2048.jpg)
![Int. J. Environ. Res. Public Health 2014, 11 5183
health-unit level who completed some data collection activities for 20 hypothetical children [60]. ME
DQA made follow-up on-site assessment of off-site desk-reviewed documentation at each level of the
PHIS [34].
Questionnaire surveys included semi-structured and structured ones [22,30,34,40,42,45,58,60,67,70].
The questionnaire data were collected by face-to-face interviews, except one online questionnaire
survey study by Forster et al. [67]. Five studies used a multi-stage sampling method [22,34,42,58,60].
The rest surveyed convenience samples or samples chosen according to a particular guideline, which
was sometimes not described [30,34,40].
Consensus development was mainly used in group discussion and meetings, guided by either
structured questionnaires or data quality issues [45,59]. Ancker et al. held a series of weekly team
meetings over about four months with key informants involved in data collection [59]. They explored
the root causes of poor data quality in line with the issues identified from assessment results. WHO
HMN organized group discussions with approximately 100 major stakeholders [45]. Five measures
related to data collection process were contained in a 197-item questionnaire. The consensus to each
measure was reached through self-assessment, individual or group scoring to yield a percentage rating [45].
Desk review of documentation was reported in six studies [34,52,55,65,69,70]. The documentation
included guidelines, protocols, official evaluation reports and those provided by data management units.
The procedures for appraisal and adoption of relevant information were not introduced in the studies.
Data analysis methods for quantitative studies were mainly descriptive statistics. Most papers did
not present the methods for analysis of the qualitative data. Information retrieved from the qualitative
study was usually triangulated with findings from quantitative data.
3.4. Summary of the Findings
Four major themes of the results have emerged after our detailed analysis, which are summarized in
this section.
The first theme is there are differences between the seven institutional and the 32 individual
research publications in their approach to data quality assessment, in terms of aims, context and scope.
First, the effectiveness of the PHIS was more of an institutional rather than a researcher’s interest. It
was covered in all of the institutional publications but only in one-third of the research papers. Second,
the disease-specific public health contexts covered by United Nations’ MDGs, maternal health,
children’s health, and HIV/AIDS, were the area most often studied by researchers. Whereas the
institutions also paid attention to the routine PHIS. Third, the institutions tended to evaluate all levels
of data management whereas most research studies were focused on a single level of analysis, either
record collection or management.
The second theme is coverage of the three dimensions of data quality was not equal. The dimension
of data was most frequently assessed (reported in 35 articles). Data use was explicitly assessed in five
studies and data collection process in one. Implicit assessment of data use and data collection process
was found in another five and 15 papers, respectively. The rationale for initiating these implicit
assessments was usually to identify factors arising from either data use or data collection process while
assessing the quality of data. Within studies that considered more than one dimension of data quality,](https://image.slidesharecdn.com/2014reviewofdataqualityassessmentmethods-151014210318-lva1-app6892/75/2014-review-of-data-quality-assessment-methods-14-2048.jpg)
![Int. J. Environ. Res. Public Health 2014, 11 5185
The importance of systematic, scientific data quality assessment needs to be highlighted. All three
dimensions of data quality, data, data use and data collection process, need to be systematically
evaluated. To date, the three dimensions of data quality were not given the same weight across the
reviewed studies. The quality of data use and data collection process has not received adequate
attention. This lack of recognition of data use and data collection process might reflect a lack of
consensus on the dimensions of data quality. Because of the equal contributions of these three
dimensions to data quality, they should be given equal weight in data quality assessment. Further
development in methods to assess data collection process and data use is required.
Effort should also be directed towards clear conceptualisation of the definitions of the relevant
terms that are commonly used to describe and measure data quality, such as the dimensions and
attributes of data quality. The lack of clear definition of the key terms creates confusions and
uncertainties and undermines the validity and reliability of data quality assessment methods. An
ontology-based exploration and evaluation from the perspective of data users will be useful for future
development in this field [33,75]. Two steps that involve conceptualization of data quality attributes
and operationalization of corresponding measures need to be taken seriously into consideration and
rationally followed as shown in our proposed conceptual framework.
Data quality assessment should use mixed methods (e.g., qualitative and quantitative assessment
methods) to assess data from multiple sources (e.g., records, organisational documentation, data
collection process and data users) and used at different levels of the organisation [33,35,36,38,75,76].
More precisely, we strongly suggest that subjective assessments of end-users’ or customers’
perspectives be an indispensible component in data quality assessment for PHIS. The importance of
this strategy has long been articulated by the researchers [33,75,76]. Objective assessment methods
assess the data that were already collected and stored in the PHIS. Many methods have been
developed, widely accepted and used in practice [38,76]. On the other hand, subjective assessments
provide a supplement to objective data quality assessment. For example, interview is useful for the
identification of the root causes of poor data quality and for the design of effective strategies to
improve data quality. Meanwhile, field observation and validation is necessary wherever it is possible
because reference of data to the real world will give data users confidence in the data quality and in
application of data to public health decision-making, action, and outcomes [52]. The validity of a study
would be doubtful if the quality of data could not be verified in the field [36], especially when the data
are come from a PHIS consisting of secondary data.
To increase the rigor of data quality assessment, the relevant statistical principles for sample size
calculation, research design, measurement and analysis need to be adhered to. Use of convenience or
specifically chosen sampling methods in 24 studies included in this review reduced the
representativeness and generalizability of the findings of these studies. At the same time, reporting of
data quality assessment needs to present the detailed procedures and methods used for the study, the
findings and limitations. The relatively simple data analysis methods using only descriptive statistics
could lead to loss of useful supportive information.
Finally, to address the gaps identified in this review, we suggest re-prioritizing the orientation of
data quality assessment in future studies. Data quality is influenced by technical, organizational,
behavioural and environmental factors [35,41]. It covers large information systems contexts, specific
knowledge and multi-disciplinary techniques [33,35,75]. Data quality in the reviewed studies is](https://image.slidesharecdn.com/2014reviewofdataqualityassessmentmethods-151014210318-lva1-app6892/75/2014-review-of-data-quality-assessment-methods-16-2048.jpg)
![Int. J. Environ. Res. Public Health 2014, 11 5186
frequently assessed as a component of the quality or effectiveness or performance of the PHIS. This
may reflect that the major concern of public health is in managerial efficiency, especially of the PHIS
institutions. Also, this may reflect differences in the resources available to, and the responsibilities of
institutions and individual researchers. However, data quality assessment hidden within other scopes
may lead to ignorance of data management and thereby the unawareness of data quality problems
enduring in public health practice. Data quality needs to be positioned at the forefront of public health
as a distinct area that deserves specific scientific research and management investment.
While this review provides a detailed overview of data quality assessment issues, there are some
limitations in its coverage, constrained by the access to the databases and the breadth of public health
information systems making it challenge to conduct systematic comparison among studies. The search
was limited by a lack of subject headings for data quality of PHIS in MeSH terms. This could cause
our search to miss some relevant publications. To compensate for this limitation, we used the strategy
of searching well-known institutional publications and manually searching the references of each
article retrieved.
Our classification process was primarily subjective. It is possible that some original researchers
disagree with our interpretations. Each assessment method has contributions and limitations which
make the choices difficult. We provided some examples of approaches to these issues.
In addition, our evaluation is limited by an incomplete presentation of details in some of the papers
that we reviewed. A comprehensive data quality assessment method includes a set of guidelines and
techniques that defines a rational process to assess data quality [37]. The detailed procedure of data
analysis, data quality requirements analysis, and identification of critical attributes is rarely given in
the reviewed papers. A lack of adequate detail in the original studies could have affected the validity of
some of our conclusions.
5. Conclusions
Public health is a data-intensive field which needs high-quality data to support public health
assessment, decision-making and to assure the health of communities. Data quality assessment is
important for public health. In this review of the literature we have examined the data quality
assessment methods based on our proposed conceptual framework. This framework incorporates the
three dimensions of data quality in the assessment methods for overall data quality: data, data use and
data collection process. We found that the dimension of the data themselves was most frequently
assessed in previous studies. Most methods for data quality assessment evaluated a set of attributes
using relevant measures. Completeness, accuracy, and timeliness were the three most-assessed
attributes. Quantitative data quality assessment primarily used descriptive surveys and data audits,
while qualitative data quality assessment methods include primarily interview, documentation review
and field observation.
We found that data-use and data-process have not been given adequate attention, although they
were equally important factors which determine the quality of data. Other limitations of the previous
studies were inconsistency in the definition of the attributes of data quality, failure to address data
users’ concerns and a lack of triangulation of mixed methods for data quality assessment. The
reliability and validity of the data quality assessment were rarely reported. These gaps suggest that in](https://image.slidesharecdn.com/2014reviewofdataqualityassessmentmethods-151014210318-lva1-app6892/75/2014-review-of-data-quality-assessment-methods-17-2048.jpg)
![Int. J. Environ. Res. Public Health 2014, 11 5193
Table A1. Characteristics of methods for assessment of the data dimension reported in the 36 publications included in the review.
Authors Year Attributes Major measures Study design Data collection methods Data analysis methods Contribution Limitations
Ancker et al.
2011 [59]
Percentage of missing data, inconsistencies and
potential errors of different variables; number of
duplicate records, number of non-standardization of
vocabulary, number of inappropriate fields
Quantitative audit of data
attributes of dataset.
Selected one data set and used tools to query
30 variables, manually assessed data formats
Rates, percentage or counts
Identified data quality issues
and their root causes.
Need a specific data
query tool
Bosch-Capblanch
et al. 2009 [58]
Accuracy
Proportions in the relevant data set, such as the
recounted number of indicator’s data by the reported
number at the next tier in the reporting system. A
ratio less than 100% indicates “over-reporting”; a
ratio over 100% suggests “under-reporting”
Quantitative audit of data
accuracy by external
auditors applying WHO
DQA in 41 countries
A multistage weighted representative random
sampling procedure, field visits verifying the
reported data. Compared data collected from
fields with the reports at the next tier
Percentage, median, inter-quartile
range, 95% confidence intervals,
ratio (verification factor quotient)
adjusted and extrapolated
Systematic methodology to
describe data quality and
identify basic recording and
reporting practices as key
factors and good practices
Limited attributes,
lack of verification of
source of actual data
and excluded
non-eligible districts
CDC 2001 [15]
Completeness, accuracy
Percentage of blank or unknown responses, ratio of
recorded data values over true values
Quantitative audit of dataset,
a review of sampled data, a
special record linkage, or a
patient interview
Calculating the percentage of blank or unknown
responses to items on recording forms, reviewing
sampled data, conducting record linkage, or a
patient interview
Descriptive statistics: percentage Provides generic guidelines
Lack of detail on
procedures, needs
adjustment
Chiba et al.
2012 [57]
Completeness: percentage of complete data.
Accuracy: 1-percentage of the complete data which
were illegible, wrongly coded, inappropriate and
unrecognized.
Relevance: comparing the data categories with those
in upper level report to evaluate whether the data
collected satisfied management information needs
Quantitative verification of
data accuracy and
completeness, and
qualitative verification of
data relevance in a
retrospective comparative
case study
Purposive sampling, clinical visits, re-entered and
audited 30 data categories of one year data to
evaluate accuracy and completeness; qualitatively
examined data categories and instructions to
assess the relevance, completeness and accuracy
of the data, semi-structured interviews to capture
factors that influence data quality
Descriptive statistics for accuracy
and completeness of the data.
Qualitative data were thematically
grouped and analyzed by data
categories, instructions, and key
informants’ views
Quantitative and qualitative
verification of data quality;
comparison of two hospitals
increased generalizability of
the findings
Consistency and
timeliness were not
assessed. Data from
the system were not
able to be validated](https://image.slidesharecdn.com/2014reviewofdataqualityassessmentmethods-151014210318-lva1-app6892/75/2014-review-of-data-quality-assessment-methods-24-2048.jpg)
![Int. J. Environ. Res. Public Health 2014, 11 5194
Table A1. Cont.
Authors Year Attributes Major measures Study design Data collection methods Data analysis methods Contribution Limitations
CIHI 2009 [30]
Accuracy: coverage, capture and collection, unit
non-response, item (partial) non-response,
measurement error, edit and imputation, processing
and estimation. Timeliness: data currency at the
time of release, documentation currency.
Comparability: data dictionary standards,
standardization, linkage, equivalency, historical
comparability. Usability: accessibility,
documentation, interpretability.
Relevance: adaptability, value.
Quantitative method, user
survey-questionnaire
Questionnaire by asking users, three ratings of
each construct, including met, not met, unknown
or not applicable (or minimal or none, moderate,
significant or unknown) All levels of the system
were taken into account in the assessment
Descriptive statistics for ratings by
each criterion, the overall
assessment for a criterion based on
the worst assessment of the
applicable levels
Data quality assessed from
user’s perspective provides
comprehensive characteristics
and criteria of each dimension
of data quality. 5 dimensions,
19 characteristics and 61criteria
Undefined procedures
of survey including
sample size. Being an
internal assessment,
rating scores were used
for internal purposes
Clayton et al.
2013 [56]
Accuracy
Sensitivity, specificity, positive predictive value
(PPV), negative predictive value (NPV)
Quantitative method to audit
dataset by power calculation
of 840 medical records
Two stage sampling of study sites, abstracting
records and auditing 25 data variables to assess
accuracy of the data reported on three data sources
Descriptive statistics were
calculated for each data sources;
summary measure of kappa values
sing the paired sample Wilcoxon
signed rank test
Accessing and linking three
data sources—maternal
medical charts, birth
certificates and hospital
discharge data whose access is
limited and using the medical
chart as the gold standard
Limited
generalizability of the
findings; low sample
size and limited
representativeness
Corriols et al.
2008 [55]
Under-reporting
Calculating the difference between registered cases
and surveyed cases
Quantitative method to
administer a cross-sectional
survey in the country
4 stage consistent random sampling method across the
country. Face-to-face interview questionnaire survey.
Descriptive statistics for estimation
of national underreporting by using
survey results
Good representativeness of the
study population
Lack of case
diagnosis information
and the quality of the
source of the data
Dai et al.
2011 [69]
Under-reporting, errors on report forms, errors
resulted from data entry; completeness of
information, accuracy, timeliness
Qualitative and quantitative
methods by reviewing
publications on the system
and data from the system
Reviewing publications on the system and data
from the system
Descriptive statistics for
quantitative data and thematically
grouping for qualitative data
Evaluated all existing
sub-systems included in
the system
Undefined
procedures of review,
lack of verification of
source data](https://image.slidesharecdn.com/2014reviewofdataqualityassessmentmethods-151014210318-lva1-app6892/75/2014-review-of-data-quality-assessment-methods-25-2048.jpg)
![Int. J. Environ. Res. Public Health 2014, 11 5195
Table A1. Cont.
Authors Year Attributes Major measures Study design Data collection methods Data analysis methods Contribution Limitations
Dixon et al.
2011 [54]
Completeness
The proportion of diagnosed cases and the
proportion of fields in a case report
Quantitative method by
auditing dataset
Creating a minimum data set of 18 key data
elements, using structured query language (SQL)
statements to calculate the percent completeness of
each field of a total of 7.5 million laboratory reports
Descriptive statistics to calculate
the difference between the
completeness scores across samples
Development of a method for
evaluating the completeness of
laboratory data
Need a specific data
query tool and only
assessed completeness
Edmond et al.
2011 [68]
Completeness, illegible hand writing, calculation
errors
The proportion of the consultation rates for two
items, the proportion of illegible hand writing and
required clarification, and the proportion of
calculation errors on the submitted record forms
Quantitative method: audit
the submitted record forms
in the dataset
3303 cards from randomly selected five weeks
from each year between 2003 and 2009
Descriptive statistics for
the percentage of each data
quality attribute
Random selection of dataset
Only calculated
completeness,
without field
verification of
accuracy of data
Ford et al.
2007 [53]
Accuracy
Sensitivity, specificity and positive predictive values
Quantitative method to use
record linkage to audit
dataset, comparing the
system with a gold standard
(a statewide audit dataset)
Calculated data quality indicators for 18 data
variables, compared with a statewide audit
(gold standard), including 2432 babies admitted to
NICUs, 1994–1996
Descriptive statistics with exact
binomial confidence intervals for data
quality attributes, comparing two
datasets by using the chi-square test
The findings are consistent
with other validation studies
that compare routinely
collected population health
data with medical records
Lack of verification
of variations between
two datasets,
inadequate
representativeness
Forster et al.
2008 [67]
Missing data
The percentage of the missing data
Quantitative method to
audit dataset
Assessed data quality of a set of six key variables.
A global missing data index was computed
determining the median of the percentages missing
data. Sites were ranked according to this index
Confidence interval (CI), Conbach’s,
multivariate logic models, Spearman
rank correlation coefficient
Directly examined
associations between site
characteristics and
data quality
Convenience sample
and uncertain
generalizability
Freestone et al.
2012 [52]
Accuracy, consistency, granularity
Quantitative method to
audit dataset from three
components: source
documents, data
extraction/transposition,
and data cleaning
Systematic sampling 200 cases, each geocoded
and comparatively assessed of data quality with
and without the influence of geocoding, by
pre-selected criteria
Data quality measured by category:
perfect, near perfect, poor. Paired t-
test for 200 samples and chi-square
test for year
Quantify data quality
attributes with
different factors
No reference type
and no field
verification
(for historic data)](https://image.slidesharecdn.com/2014reviewofdataqualityassessmentmethods-151014210318-lva1-app6892/75/2014-review-of-data-quality-assessment-methods-26-2048.jpg)
![Int. J. Environ. Res. Public Health 2014, 11 5196
Table A1. Cont.
Authors Year Attributes Major measures Study design Data collection methods Data analysis methods Contribution Limitations
Frizzelle et al.
2009 [51]
Accuracy, completeness, currency
Assessed by positional errors, generalizations
incompatible with highly accurate geospatial
locations, updated with the change
Quantitative method to use
geographic information
systems (GIS) by
developing a custom road
dataset for analyzing data
quality of four datasets
Developed a custom road dataset, and compared
with four readily available public and commercial
road datasets; developed three analytical measures
to assess the comparative data quality
Percentage, concordance coefficients
and Pearson correlation coefficients
Exemplary to assessing the
feasibility of readily available
commercial or public road
datasets and outlines the steps
of developing a custom dataset
No field verification
for historic data
Hahn et al.
2013 [50]
Completeness, accuracy
The percentage of correctly or completely
transmitted items from the original data source to
secondary data sources
A multiple case study by
quantitative and qualitative
approaches in 3 antenatal care
clinics of two private and one
public Kenyan hospital
Quantitative method: selected 11 data tracer items
followed retrospectively and audited compared to
independently created gold standard. Qualitative
methods: structured interviews and qualitative
in-depth interviews to assess the subjective
dimensions of data quality. Five-point scales were
used for each statement. Purposeful sampling of
44 staff for survey and 15 staff for key
informants interviews
Quantitative data: manual review,
descriptive statistics, Kruskal-Wallis
test, Mann-Whitney U test for
continuous measures. Qualitative
data: processed manually and
classified and grouped by facility
and staff class
Combining different methods
and viewing the information
systems from different
viewpoints, covering the
quality of PHIS and drawing
suggestions for improvement of
data quality from qualitative
results, likely to produce robust
results in other settings
Harper et al.
2011 [66]
Completeness: the proportion of filled fields on the
reports. Validity: the proportion of the number of
the written indicators against the assigned standard;
the proportion of entered incorrect numbers; the
proportion of illegible entries; the proportion of
entries out of chronological order
Quantitative method to
audit an electronic database
that was manually extracted
entries of a reference
syndrome from anonymized
dataset from the E-Book
health registry entries
Using a random systematic sample of 10% of the
extracted entries (i.e., beginning with a randomly
chosen starting point and then performing interval
sampling to check 10% of records), with an
acceptable error rate of <5%
Descriptive statistics on attributes.
To avoid bias, age and sex
proportions were extracted from
available records, the proportions
compared to National Census data.
Examine data quality using a
reference syndrome, thus
making it possible to provide
informed recommendations.
Descriptive data analysis
provides grounded and useful
information for decision makers
No evaluation of data
collection methods](https://image.slidesharecdn.com/2014reviewofdataqualityassessmentmethods-151014210318-lva1-app6892/75/2014-review-of-data-quality-assessment-methods-27-2048.jpg)
![Int. J. Environ. Res. Public Health 2014, 11 5197
Table A1. Cont.
Authors Year Attributes Major measures Study design Data collection methods Data analysis methods Contribution Limitations
Hills et al.
2012 [73]
Timeliness: the number of days between Service
Date and Entry Date of submission of data to the
system (three categories: ≤7 days, =8–30 days, and
≥31 days).
Completeness: the complete recording of data
elements by calculating the proportion of complete
fields over total number of fields
Quantitative method to
audit data set
Use a de-identified 757,476 demographic
records and 2,634,101 vaccination records from
the system
Descriptive statistics on attributes
Large dataset provides
a statistically
significant association
Not able to examine
two highly relevant
components of data
quality: vaccination
record coverage
completeness and
accuracy
Lash et al.
2012 [74]
Completeness: the number of locations matching to
latitude and longitude coordinates.
Positional accuracy: spatial resolution of the dataset.
Concordance: the number of localities falling within
the boundary. Repeatability: the georeferencing
methodology
Georeferencing historic
datasets, quantitative
method research historic
data with 404 recorded
MPX cases in seven
countries during 1970–1986
from 231 unique localities
Develop ecological niche models and maps of
potential MPX distributions based on each of the
three occurrence data sets with different
georeferencing efforts
Descriptive statistics on attributes
and comparison of georeferencing
match rates
Document the difficulties and
limitations in the available
methods for georeferencing
with historic disease data in
foreign locations with poor
geographic reference
information.
Not able to examine
the accuracy of
data source
Lin et al.
2012 [65]
Completeness: sufficient sample size. Accuracy:
data missing or discrepancies between
questionnaires and database
Quantitative and qualitative
methods, auditing data set
by cross-checking 5%
questionnaires against the
electronic database during
the field visits
Review guidelines and protocols using a detailed
checklist; purposive sampling; direct observations
of data collection; cross-checking compared
database with the questionnaires
Descriptive statistics for attributes
of data quality
Mixed-methods to assess
data quality
Unable to generalize
the findings to the
whole system
Litow and Krahl
2007 [64]
Accuracy, use of standards, completeness,
timeliness, and accessibility
Quantitative method based
on a framework developed
for assessment of PHIS
Exported and queried one year data by
12 data items
Descriptive statistics for data
quality attributes
Research on Navy population
for public health applicability
of the system and identified
factors influencing data quality
Needs a framework
which was undefined
in the research
Lowrance et al.
2007 [63]
Completeness, updated-ness, accuracy
Qualitative method by
following CDC’s Guidelines
with qualitative methods
Standardized interviews with 18 key informants
during 12 site visits, and meetings with
stakeholders from government, non-governmental
and faith-based organizations.
Thematically grouping
interview responses
Data quality qualitatively
assessed by key informants
and stakeholders
Lack of quantifiable
information](https://image.slidesharecdn.com/2014reviewofdataqualityassessmentmethods-151014210318-lva1-app6892/75/2014-review-of-data-quality-assessment-methods-28-2048.jpg)
![Int. J. Environ. Res. Public Health 2014, 11 5198
Table A1. Cont.
Authors Year Attributes Major measures Study design Data collection methods Data analysis methods Contribution Limitations
Makombe et al.
2008 [49]
Completeness: filled fields; accuracy: no missing
examined variables or a difference less than 5%
compared to the supervision report
Quantitative methods to
audit the quality of site
reports as of the date of
field supervisory visits
6 case registration fields and 2 outcome data
were examined
Descriptive statistics on attributes
of data quality from site reported
were compared to those of
supervision reports
(“gold standard”)
Set up thresholds of accuracy,
examine association between
facility characteristics and
data quality
Only assessed
aggregated
facility-level rather
individual patient data
Mate et al.
2009 [48]
Completeness: no missing data in a period of time;
accuracy: the value in the database was within 10%
of the gold standard value or percentage deviation
from expected for each data element when
compared to the gold standard data set
Quantitative methods to
assess attributes.
Completeness: surveying six
data elements in one year
dataset from all sample sites.
Accuracy: surveying a
random sample sites in three
months to assess variation of
three steps in data collection
and reporting
Extracted one year dataset for surveying data
completeness of six data elements. Randomization
sampling. Paralleled collection of raw data by on-site
audit of the original data. Reconstructed an objective,
quality-assured “gold standard” report dataset. All
clinical sites were surveyed for data completeness,
99 sites were sampled for data accuracy
Descriptive statistics, by using charts,
average magnitude of deviation from
expected, and data concordance
analysis between reported data and
reconstructed dataset
Large sample size,
randomized sampling
technique, the use of an
objective, quality-assured
“gold standard” report
generated by on-site audit of the
original data to evaluate the
accuracy of data elements
reported in the PHIS. Set up
thresholds of accuracy and errors
Sources of data were
not verified
Matheson et al.
2012 [71] *
Missing data, invalid data, data cleaning, data
management processes
Not conducted N/A N/A N/A
Lack of
specific metrics
ME DQA
2008 [34]
Accuracy, reliability, precision, completeness,
timeliness, integrity, confidentiality
Comprehensive audit in
quantitative and qualitative
methods including in-depth
verifications at the service
delivery sites; and follow-up
verifications at the next level
4 methods for selection of sites including
purposive selection, restricted site design,
stratified random sampling, random sampling; the
time period corresponding to the most recent
relevant reporting period for the IS. Five types of
data verifications including description,
documentation review, trace and verification
(recount), cross-checks, spot-checks. Observation,
interviews and conversations with key data quality
officials were applied to collect data
Descriptive statistics on accuracy,
availability, completeness, and
timeliness of reported data,
including results verification ratio
of verification, percentage of each
dimension, differences between
cross-check
Two protocols, 6 phases,
17 steps for the audit; sample
on a limited scale considering
the resources available to
conduct the audit and level of
precision desired; 2–4 indicators
“case by case” purposive
selection; on-site audit visits by
tracing and verifying results
from source documents at each
level of the PHIS
Confined to specific
disease context and
standard
program-level
output indicators](https://image.slidesharecdn.com/2014reviewofdataqualityassessmentmethods-151014210318-lva1-app6892/75/2014-review-of-data-quality-assessment-methods-29-2048.jpg)
![Int. J. Environ. Res. Public Health 2014, 11 5199
Table A1. Cont.
Authors Year Attributes Major measures Study design Data collection methods Data analysis methods Contribution Limitations
ME PRISM
2010 [40]
Relevance: comparing data collected against
management information needs. Completeness:
filling in all data elements in the form, the
proportion of facilities reporting in an administrative
area. Timeliness: submission of the reports by an
accepted deadline. Accuracy: comparing data
between facility records and reports, and between
facility reports and administrative area databases
Quantitative method,
Questionnaire survey
including data
completeness and
transmission, data accuracy
check, data processing and
analysis, assess the
respondent’s perceptions
about the use of registers,
data collection forms and
information technology
Non-anonymous interviews with identified name
and title, including asking, manual counting,
observation and recording results or circling
“yes or no”
Using a data entry and analysis tool
(DEAT), described in quantitative
terms rather than qualitative. Yes or
No tick checklist
A diagnostic tool in forms
measures strengths and
weaknesses in three
dimensions of data quality.
Quantitative terms help set
control limits and targets and
monitor over time
Indicators are not all
inclusive; tool should
be adapted in a given
context. Need
pre-test and make
adjustments
Pereira et al.
2012 [72]
Completeness and accuracy of data-fields and errors
Quantitative and qualitative
methods: Use primary
(multi-center randomized
trial) and secondary
(observational convenience
sample) studies
Field visits of a sample of clinics within each
PHU to assess barcode readability, method
efficiency and data quality. 64 clinic staff
representing 65% of all inventory staff members
in 19 of the 21 participating PHUs completed a
survey examining method perceptions
Descriptive statistics: a weighted
analysis method, histograms, 95%
confidence intervals, F-test,
Bootstrap method, the two-
proportion z-test, adjusted the p
values using Benjamin–Hochberg’s
method for controlling false
discovery rates (FDR)
The first study of such in an
immunization setting.
Lack of
representativeness to
multiple lot numbers.
Inaccurate data entry
was not examined.
Observations were
based on a
convenience sample
Petter and
Fruhling
2011 [62]
Checklist of system quality, information quality
Quantitative methods to use
DeLone&McLean IS
success model. Use a
survey in structured
questionnaire
Online survey, facsimile, and mail, using 7 Likert
scale for all quantitative questions. A response
rate of 42.7% with representative demographics
Summative score for each
construct, and each hypothesis was
tested using simple regression.
Mean, standard deviation, the
Spearman’s correlation coefficients
for analysis
Demonstrates the need to
consider the context of the
medical information system
when using frameworks to
evaluate the system
Inability of assessing
some correlational
factors due to the small
PHIS user system](https://image.slidesharecdn.com/2014reviewofdataqualityassessmentmethods-151014210318-lva1-app6892/75/2014-review-of-data-quality-assessment-methods-30-2048.jpg)
![Int. J. Environ. Res. Public Health 2014, 11 5200
Table A1. Cont.
Authors Year Attributes Major measures Study design Data collection methods Data analysis methods Contribution Limitations
Ronveaux et al.
2005 [60]
Consistency
The ratio of verified indicators reported compared with
written documentation at health facilities and districts
Quantitative methods, using
standardized data quality
audits (WHO DQAs) in
27 countries
Recounted data compared to reported data Descriptive statistics
A quantitative indication of
reporting consistency and
quality, facilitate comparisons
of results over time or place
Similar to WHO DQA
Saeed et al.
2013 [61]
Completeness, validity, data management
Calculation of missing data and illegal values
(out of a predetermined range), data management
(data collection, entry, editing, analysis
and feedback)
Quantitative and qualitative
methods, including
interview, consultation, and
documentation review
10 key informants interview among the directors,
managers and officers; 1 or 2 staff at national
level interviewed; consultation with stakeholders,
document review of each system strategic plan,
guidelines, manuals, annual reports and data bases
at national level
Predefined scoring criteria for
attributes: poor, average, or good
Comparison of two PHIS Purposive sampling
Savas et al.
2009 [47]
Sensitivity, specificity and the Kappa coefficient for
inter-rater agreement
Quantitative methods:
audit data set by
cross-linkage techniques
Databases were deterministically cross linked
using female sex and social security numbers.
Deterministic and probabilistic linkage methods
were also compared
Descriptive statistics
Combined electronic
databases provide nearly
complete ascertainment for
specific dataset
Using data which
were missing would
affect the results by
under-ascertainment
Van Hest et al.
2008 [46]
Accuracy and completeness of reported cases
Quantitative methods: audit
data set by record-linkage
and capture-recapture
techniques
Use record linkage, false-positive records and
correction, and capture-recapture analysis through
3 data sources by a core set of identifiers
Descriptive statistics: number,
proportion and distribution of cases,
95% ACI (Approximate confidence
interval), Zelterman’s truncated model
Record-linkage of TB data
sources and cross-validation
with additional TB related
datasets improves data
accuracy as well as
completeness of case
ascertainment
Imperfect
record-linkage and
false-positive
records, violation of
the underlying
capture–recapture
assumptions
Venkatarao et al.
2012 [22]
Timeliness: Percentage of the reports received on
time every week; Completeness: percentage of the
reporting units sending reports every week
Quantitative methods:
Use field survey
(questionnaire) with a
4-stage sampling method
2 study instruments: the first focused on the
components of disease surveillance; the second
assessed the ability of the study subject in
identifying cases through a syndromic approach
Descriptive statistics analysis
Two instruments including
surveying users and dataset
Not able to assess the
quality of data source
such as accuracy](https://image.slidesharecdn.com/2014reviewofdataqualityassessmentmethods-151014210318-lva1-app6892/75/2014-review-of-data-quality-assessment-methods-31-2048.jpg)
![Int. J. Environ. Res. Public Health 2014, 11 5201
Table A1. Cont.
Authors Year Attributes Major measures Study design Data collection methods Data analysis methods Contribution Limitations
WHO DQA
2003 [42]
Completeness of reporting, report availability,
timeliness of reporting, verification factor
Quantitative methods to
audit selected indicators in
the dataset. Multi-stage
sampling from stratified
sample representing the
country’s PHIS
Recounted data compared to reported data Descriptive statistics
A systematic methodology to
describe data quality in the
collection, transmission and
use of information, and to
provide recommendations to
address them
Sample size and the
precision dictated by
logistical and financial
considerations
WHO DQRC
2013 [44]
Completeness of reporting; internal consistency of
reported data; external consistency of population
data; external consistency of coverage rates
Quantitative method to
conduct a desk review of
available data and a data
verification component
at national level and
sub-national level
An accompanying Excel-based data quality
assessment tool
Simple descriptive statistics:
percentage, standard deviation
Easy to calculate
Needs WHO DQA to
complement
assessment of the
quality of data source
WHO HMN
2008 [45]
Data-collection method, timeliness, periodicity,
consistency, representativeness, disaggregation,
confidentiality, data security, and data accessibility.
Quantitative and qualitative
methods to use 63 out of
197 questions among around
100 major stakeholders
Use consensus development method by group
discussions, self-assessment approach, individual
(less than 14) or group scoring to yield a
percentage rating for each category
An overall score for each question,
quartiles for the overall report.
Expert panel discussion,
operational indicators with
quality assessment criteria.
Sample size was
dictated by logistical
and financial
considerations
Table A2. Characteristics of the methods for assessment of data use reported in the 10 publications included in the review.
Authors Year Attributes Major measures Study design Data collection methods Data analysis methods Contribution Limitations
Freestone et al.
2012 [52]
Trends in use Actioned requests from
researchers in a set period of time
Analysis of actioned requests from
researchers in a period of time
Abstracted data from the database for
the study period
Trend analysis of
proportion of requests
Quantifiable measures Limit attributes
Hahn et al.
2013 [50]
Use of data
The usage of aggregated data for monitoring,
information processing, finance and accounting,
and long-term business decisions
Qualitative methods: structured
interviews with purposive sample of
44 staff and in-depth interviews with
15 key informants
Structured survey and key informant
interview to assess five structured
statements. Five-point scales were
used for each statement
Responses were processed
manually, classified
and grouped by facility and
staff class
Identified indicators of use
of data
Lack of quantifiable results
for assessment of data use](https://image.slidesharecdn.com/2014reviewofdataqualityassessmentmethods-151014210318-lva1-app6892/75/2014-review-of-data-quality-assessment-methods-32-2048.jpg)
![Int. J. Environ. Res. Public Health 2014, 11 5202
Table A2. Cont.
Authors Year Attributes Major measures Study design Data collection methods Data analysis methods Contribution Limitations
Iguiñiz-Romero and
Palomino 2012 [70]
Data use
Data dissemination: identify whether data
used for decision making, the availability of
feedback mechanisms
Qualitative exploratory study
including interview and review
of documentations
Open-ended, semi-structured
questionnaire interviews with 15 key
decision-makers. Review national
documents and academic
publications
Interview data recorded,
transcribed, organized
thematically and
chronologically. The
respondents were identified
by positions but not named
Most respondents held key
positions and a long period of
the reviewed publications
Purposive sample lack of
representativeness
Matheson et al.
2012 [71]
Clinical use of data: the number of summaries
produced.
Use of data for local activities to improve care.
Data entry: the number of active sites.
Report use: the percentage of active sites using
prebuilt queries to produce data for each type of
report in a given month over time
Qualitative and quantitative methods:
key informant interview,
documentation review,
database query.
Personal interviews by phone and
through internet telephony; follow up
in person or by email; running SQL
queries against the central database.
External events were identified by
reviewing news reports and through
personal knowledge of the authors
Descriptive statistics using
charts on number of clinics
using the system in a given
month, percentage of
active clinics
Multiple methods
Lack of verification of
data source
ME PRISM
2010 [40]
Checklist of use of information
Report production, display of information,
discussion and decisions about use of
information, promotion and use of information at
each level
Quantitative method to complete a
predesigned checklist diagnostic tool
Checklist and non-anonymous
interviewing staff, asking, manual
counting, observation and recording
results or circling “yes or no”
Two Likert score and
descriptive statistics
Quantitative terms help set
control limits and targets and
monitor over time
Petter and Fruhling
2011 [62]
System use, intention to use, user satisfaction
Quantitative methods to use DeLone
& McLean IS success model. Survey
respondents with a response rate of
42.7% and with representative
demographics
Use an online survey in structured
questionnaire with 7 Likert scale for
all quantitative questions, in addition
to facsimile and mail
Summative score for each
construct, and each
hypothesis was tested using
simple regression, in
addition to mean, standard
deviation, the Spearman’s
correlation coefficients
Use is dictated by factors
outside of the control of the
user, and it is not a reasonable
measure of IS success. The
quality does not affect the depth
of use
Lack of objective assessments](https://image.slidesharecdn.com/2014reviewofdataqualityassessmentmethods-151014210318-lva1-app6892/75/2014-review-of-data-quality-assessment-methods-33-2048.jpg)
![Int. J. Environ. Res. Public Health 2014, 11 5203
Table A2. Cont.
Authors Year Attributes Major measures Study design Data collection methods Data analysis methods Contribution Limitations
Qazi and Al
2011 [27]
Use of data
Non-use, misuse, disuse of data
Descriptive qualitative interviews
In-depth, face to face and semi
structured interviews with an interview
guide, 26 managers (all men, ages
ranging from 26 to 49 years; selected
from federal level (2), provincial (4)
and seven selected districts (20) from
all four provinces)
Data transcription, analysis
based on categorization of
verbatim notes into themes
and a general description of
the experience that emerged
out of statements
A qualitative study allows
getting close to the people and
situations being studied,
identified a number of hurdles
to use of data
Convenience sample only one
type of stakeholders has
been covered.
Saeed et al. 2013
Usefulness of the system
Data linked to action, feedback at lower level,
data used for planning, detect outbreaks, data
used for the development and conduct of studies
Quantitative and qualitative methods,
including interview, consultation, and
documentation review
10 key informants interview;
consultation with stakeholders,
document review of each system
Predefined scoring criteria
for attributes: poor,
average, or good
Mixed methods Purposive sampling
WHO HMN
2008 [45]
Information dissemination and use, demand and
analysis, policy and advocacy, planning and
priority-setting, resource allocation,
implementation and action
Mixed methods: quantitative and
qualitative. Use 10 out of 197 questions
among stakeholders at national and
subnational levels
Use group discussions (100 major
stakeholders), self-assessment
approach, individual (less than 14) or
group scoring to yield a percentage
rating for each category
An overall score for each
question, quartiles for the
overall report
Expert panel discussion,
operational indicators with
quality assessment criteria
Lack of field verification of
data use
Wilkinson and
McCarthy
Extent of data recognition and use, strategies and
routines, specific uses, dissemination
Quantitative and qualitative methods
to use standardized semi-structured
questionnaire telephone interviews of
key informants from the management
teams of the system
Telephone structured questionnaire
interviews of 68 key informants from
the 29 out of 34 management teams
of the networks. Response options
for most of the questionnaire items
were yes/no or five or seven point
Likert and semantic differential
response scales
Quantitative and qualitative
analysis of survey results.
Qualitative data transcribed,
ordered by question
number, and common
themes, then content
analyzed to indicate
frequencies and
percentages. Correlational
analyses used Pearson’s r
for parametric data and
Spearman’s Rho for
non-parametric data
Quantification of
qualitative data
Statistical analysis is limited
by the size of the sample as
there were only 29 networks
and 68 individual
participants, statistical power
to detect an effect is weak,
and general trends are mainly
reported.](https://image.slidesharecdn.com/2014reviewofdataqualityassessmentmethods-151014210318-lva1-app6892/75/2014-review-of-data-quality-assessment-methods-34-2048.jpg)
![Int. J. Environ. Res. Public Health 2014, 11 5204
Table A3. Characteristics of the methods for assessment of data collection process reported in the 16 publications included in the review.
Authors Year Attributes Major measures Study design Data collection methods Data analysis methods Contribution Limitations
Ancker et al.
2011 [59]
Group discussion about root causes of
poor data quality and strategies for
solving the problems
Qualitative method by focus
group discussion
Held a series of weekly team meetings
over about 4 months with key
informants involved in the
data collection
Theme grouping to each data
quality issue
Initiated by and related
to identified poor data
quality issues
Implicitly focused. Only
analyzed causes not
assessed the magnitude
Bosch-Capblanch
et al. 2009 [58]
Quality scores
Recording and reporting of data,
keeping of vaccine ledgers and
information system design
Quantitative method by user’s
survey based on WHO DQA. A
multistage weighted representative
sampling procedure
Questionnaire based on a series of
19 questions and observations
undertaken at each level
(national, district and health units)
Each question 1 point. Average score,
summary score, medians, inter-quartile
ranges, confidence intervals, P value,
bubble scatter chart, Rho value
Combined with data quality
Implicitly focused, the
number of questions
surveyed was less than that
of the WHO DQA
CIHI 2009 [30]
Metadata documentation
Data holding description, methodology,
data collection and capture, data
processing, data analysis and
dissemination, data storage, and
documentation.
Quantitative method by
surveying users
Questionnaire Undefined
7 categories, with
subcategories and definition
and/or example
Implicitly focused
Corriols et al.
2008 [55]
Identification of underreporting reasons
by reviewing information flow chart and
non-reporting in physicians
Qualitative method to review
documentations
Review the national reports on the
system related to deficiency in the
information flow chart and non-
reporting in physicians
Undefined
Initiated by identified data
quality issues
Implicitly focused
Dai et al. 2011 [69]
Data collection, data quality
management, statistical analysis and data
dissemination
Qualitative method, review
documentations
Document review Theme grouping Desk review Implicitly focused
Forster et al. 2008
Routine data collection, training and data
quality control
Quantitative method by online
survey
Questionnaire Descriptive statistics.
Examine associations
between site characteristics
and data quality
Implicitly focused.
Convenience sample](https://image.slidesharecdn.com/2014reviewofdataqualityassessmentmethods-151014210318-lva1-app6892/75/2014-review-of-data-quality-assessment-methods-35-2048.jpg)
![Int. J. Environ. Res. Public Health 2014, 11 5205
Table A3. Cont.
Authors Year Attributes Major measures Study design Data collection methods Data analysis methods Contribution Limitations
Freestone et al.
2012 [52]
Data collection and recording processes
Qualitative method to review
current processes about
identification, code, geocode of
address or location data. Staff
consulted to establish and observe
coder activities and entry processes
Review the processes; consultation with
staff; observation of coder activities and
entry processes to identify any potential
cause of errors which then grouped
thematically
Thematically grouping data
Identify each of the key
elements of the geocoding
process are factors that
impact on geocoding quality
Differences in software and
system settings need to be
aware of.
Hahn et al.
2013 [50]
Data flow The generation and
transmission of health information
Qualitative method to use workplace
walkthroughs on 5 subsequent
working days at each site
Informal observations of the generation
and transmission of health information of
all kinds for the selection of data flows
Undefined
Observation of
walkthroughs
Undefined indicators
Iguiñiz-Romero and
Palomino 2012 [70]
Data flow or data collection process: data
collectors, frequencies, data flow, data
processing and sharing,
Qualitative exploratory study
including interview and review
documentations
Open-ended, semi-structured
questionnaire interviews with 15 key
decision-makers. Review national
documents and academic publications
Data recorded, transcribed, organized
thematically and chronologically
Most respondents held key
positions and a long period
of reviewed publications
Purposive sample
Lin et al. 2012 [65] Data collection and reporting
Qualitative methods based on
CDC’s Guidelines,
Review guidelines and protocols using a
detailed checklist; direct observation;
focus group discussions and semi-
structured interviews
Theme grouping
Field visits or observations
of data collection to identify
impact on the data quality
Undefined indicators
ME DQA 2008 [34]
Five functional areas: M&E structures,
functions and capabilities, indicator
definitions and reporting guidelines, data
collection and reporting forms and tools,
data management processes, and links
with national reporting system
Quantitative and qualitative methods
by 13 system assessment summary
questions based on 39 questions from
five functional areas. Score the
system combined with a
comprehensive audit of data quality
Off-site desk review of documentation
provided by the program/project; on-site
follow-up assessments at each level of the
IS, including observation, interviews, and
consultations with key informants
Using summary statistics based on
judgment of the audit team. Three-point
Likert scale to each response.
Average scores for per site between
0 and 3 continuous scale
DQA protocol and system
assessment protocol
Implicitly focused. The
scores should be interpreted
within the context of the
interviews, documentation
reviews, data verifications
and observations made
during the assessment.](https://image.slidesharecdn.com/2014reviewofdataqualityassessmentmethods-151014210318-lva1-app6892/75/2014-review-of-data-quality-assessment-methods-36-2048.jpg)
![Int. J. Environ. Res. Public Health 2014, 11 5206
Table A3. Cont.
Authors Year Attributes Major measures Study design Data collection methods Data analysis methods Contribution Limitations
ME PRISM
2010 [40]
Processes
Data collection, transmission, processing,
analysis, display, quality checking,
feedback
Quantitative method by
questionnaire survey including data
transmission, quality check,
processing and analysis and
assessing the respondent’s
perceptions about the use of
registers, data collection forms and
information technology
Non-anonymous interviewing staff with
identified name and title, including asking,
observation and circling “yes or no”
Using a data entry and analysis tool
(DEAT), described in quantitative terms
rather than qualitative. Yes or No
tick checklist
A diagnostic tool.
Quantitative terms help set
control limits and targets
and monitor over time
Indicators are not all
inclusive; tool should be
adapted and pre-test and
make adjustments
Ronveaux et al.
2005 [60]
Quality index (QI)
Recording practices, storing/reporting
practices, monitoring and evaluation,
denominators used at district and
national levels, and system design at
national level
Quantitative and qualitative
methods by external on-site
evaluation after a multi-stage
sampling based on WHO DQA.
Questionnaires and observations. Survey
at national level (53 questions), district
level (38 questions) and health-unit level
(31 questions). Observations to workers
at the health-unit level. They were asked
to complete 20 hypothetical practices.
Descriptive statistics (aggregated scores,
mean scores): 1 point each question or
task observed. Correlational analyses by
zero-order Pearson correlation coefficients
Implicitly focused. The
chosen sample size and the
precision of the results
were dictated by logistical
and financial considerations
Venkatarao et al.
2012 [22]
Accuracy of case detection, data recording,
data compilation, data transmission
Quantitative method by using a 4-
stage sampling method to conduct
field survey (questionnaire) during
May-June 2005 among 178 subjects
Questionnaires of 2 study instruments: the
first focused on the components of disease
surveillance; the second assessed the
ability of the study subject in identifying
cases through a syndromic approach
Descriptive statistics analysis
Assessment from
user’s viewpoint.
Implicitly focused. Lack of
field verification of data
collection process](https://image.slidesharecdn.com/2014reviewofdataqualityassessmentmethods-151014210318-lva1-app6892/75/2014-review-of-data-quality-assessment-methods-37-2048.jpg)
![Int. J. Environ. Res. Public Health 2014, 11 5207
Table A3. Cont.
Authors Year Attributes Major measures Study design Data collection methods Data analysis methods Contribution Limitations
WHO DQA
2003 [42]
Quality questions checklist, quality index
Five components: recording practices,
storing/reporting practices, monitoring
and evaluation, denominators, system
design (the receipt, processing, storage
and tabulation of the reported data)
Quantitative and qualitative method
using questionnaire checklists for
each level (three levels:
national, district, health unit level)
of the system including 45, 38,
31 questions respectively
Questionnaires and discussions.
Observations by walking around the
health unit for field observation to
validate the reported values
Percentage of the items answered yes.
The target is 100% for each component
Describe the quality of data
collection and transmission
Implicitly focused. The
chosen sample size was
dictated by logistical and
financial considerations
WHO HMN
2008 [45]
Data management or metadata
A written set of procedures for data
management including data collection,
storage, cleaning, quality control, analysis
and presentation for users, an integrated
data warehouse, a metadata dictionary,
unique identifier codes available
Mixed methods: quantitative
and qualitative. Use 5 out of
197 questions, at various national
and subnational levels
Use group discussions around 100 major
stakeholders, self-assessment approach,
individual (less than 14) or group
scoring to yield a percentage rating for
each category
An overall score for each question,
quartiles for the overall report
Expert panel discussion,
operational indicators with
quality assessment criteria
Lack of field verification of
data collection process
© 2014 by the authors; licensee MDPI, Basel, Switzerland. This article is an open access article distributed under the terms and conditions of the Creative
Commons Attribution license (http://creativecommons.org/licenses/by/3.0/).](https://image.slidesharecdn.com/2014reviewofdataqualityassessmentmethods-151014210318-lva1-app6892/75/2014-review-of-data-quality-assessment-methods-38-2048.jpg)

The document is a review of data quality assessment methods for public health information systems, highlighting the necessity of high-quality data for effective public health interventions. It identifies key dimensions of data quality, including data, data use, and data collection process, as well as common attributes such as completeness, accuracy, and timeliness. The review also emphasizes the limitations of current studies and the need for further research to streamline data quality definitions and improve assessment methodologies.


