Download to read offline


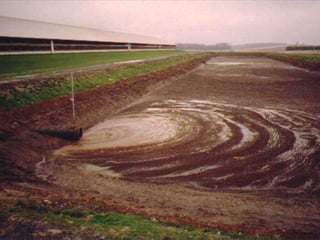
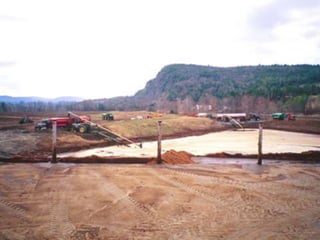
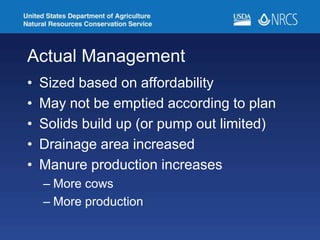
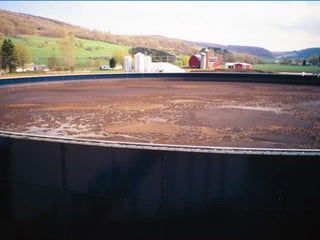
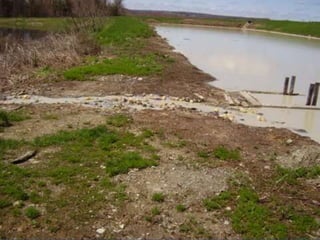
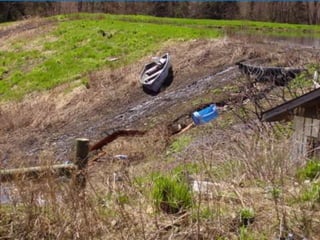
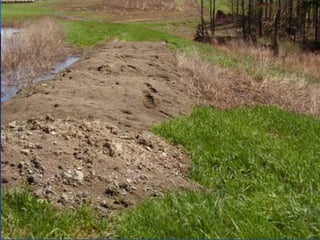
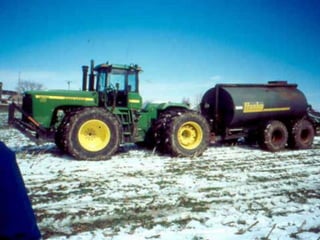
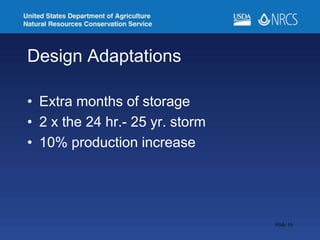
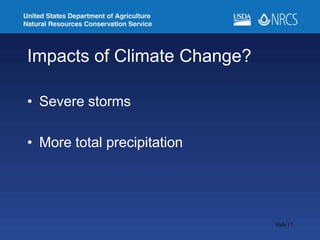
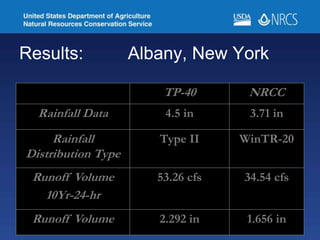
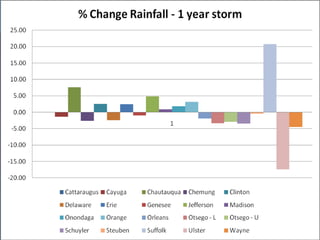
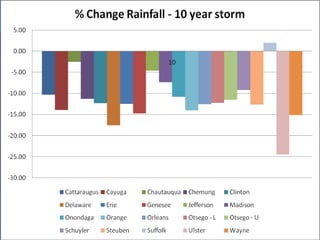
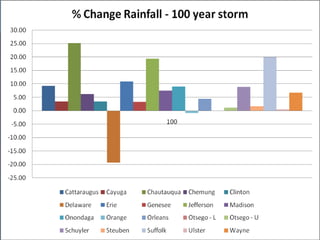
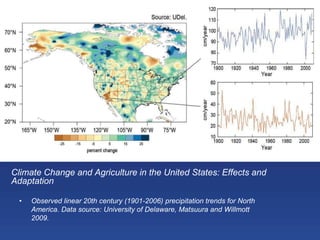
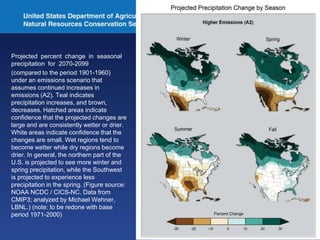
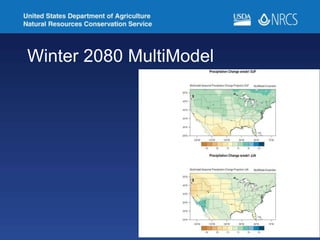
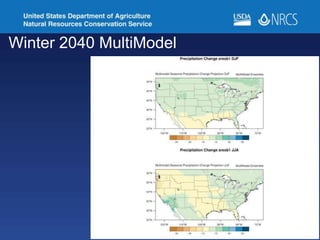
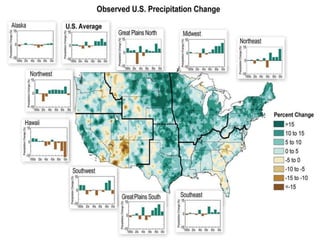
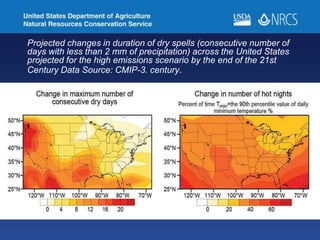

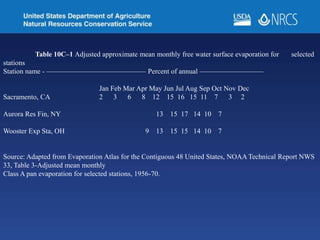
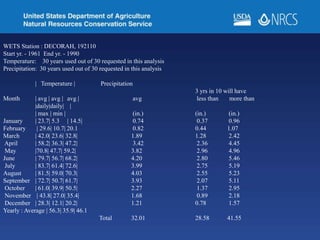
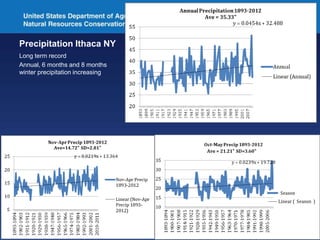
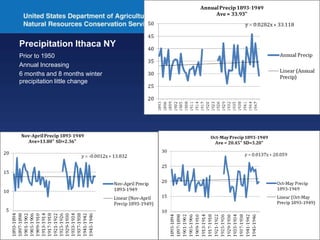
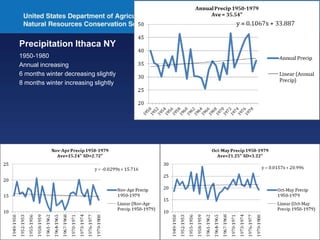
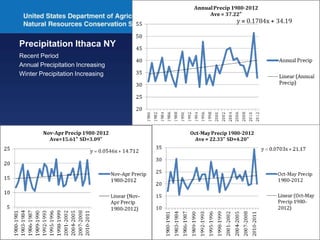
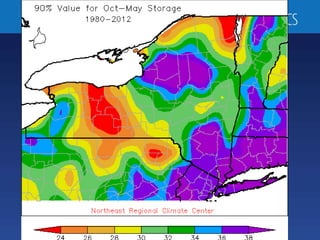
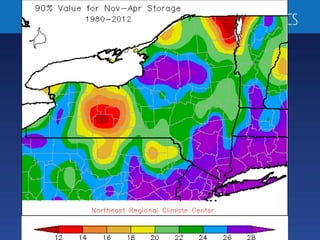

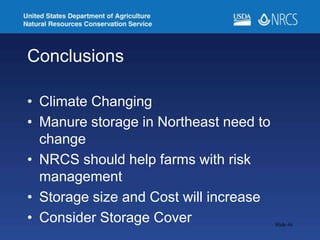

The document discusses the impacts of climate change on manure storage in the Northeast U.S., highlighting the need for updated management practices and storage designs due to increasing precipitation and storm intensity. It presents data on rainfall patterns and projections, emphasizing the necessity for larger storage capacities and adaptations to address the changed climate. Recommendations include assistance from NRCS for risk management and modifications in storage practices to accommodate anticipated changes in manure production and environmental conditions.


![Getting Started with Apache Spark: Big Data Made Simple [Free Meetup]](https://cdn.slidesharecdn.com/ss_thumbnails/apachesparkgettingstarted-260203175547-8361bcc3-thumbnail.jpg?width=640&height=640&fit=bounds)


