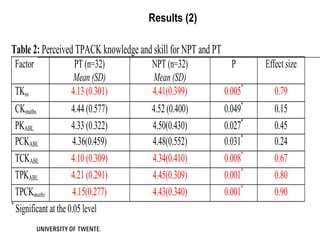
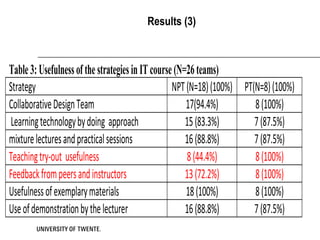
Downloaded 57 times


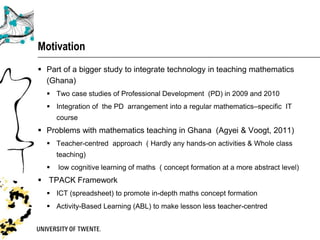
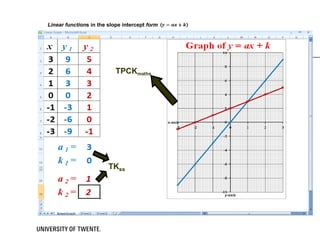
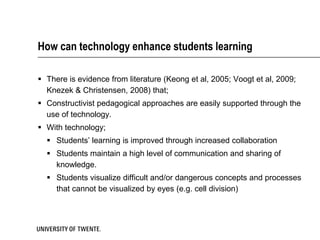
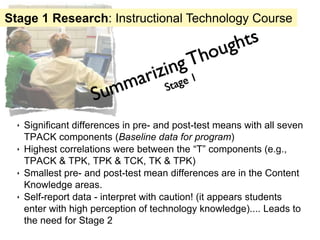
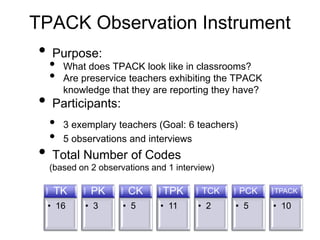
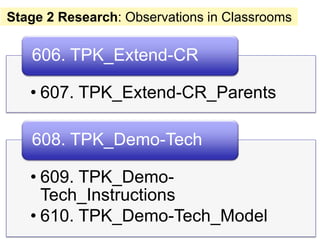
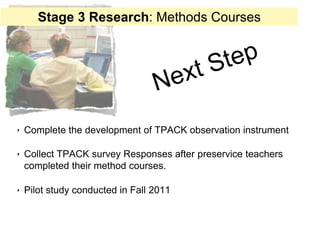
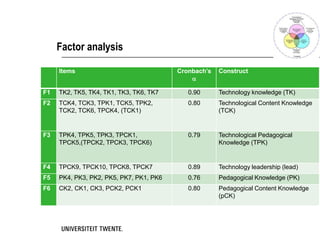
![Categorizing and Coding data
Example of coding lesson document
Codes: [PCKABL]
In this activity, ask students to indicate (by tick (√)) the features of the equations as shown
on the Worksheet ... Ask the students to keep their results for discussion later in the lesson.
Codes: [PKABL]
Prepare students for the following activities (Activities: 1.0 - 3.0) by organizing them in
small groups ... Assign specific roles to members….
Codes: [TKss]
Set the cursor over cell D1 ... You should see: =m*x+k. (NB: The * symbol is used for
multiplication)… and then click on Scatter with Smooth Lines and Markers.](https://image.slidesharecdn.com/2012-03-05sitetpacksymposium-120305161433-phpapp01/85/2012-03-05-SITE-TPACK-Symposium-16-320.jpg)
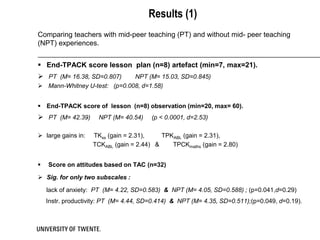


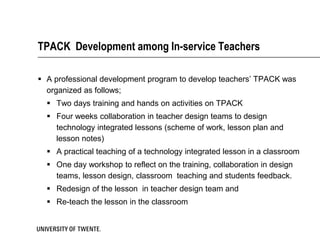


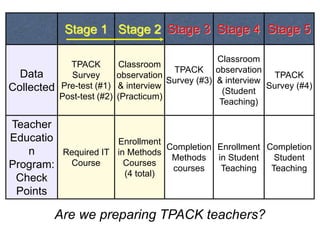
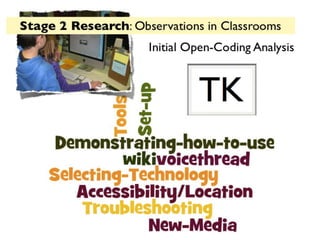
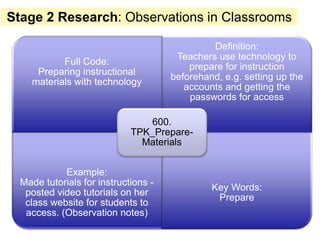
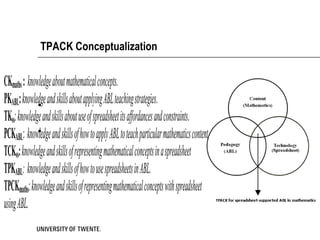
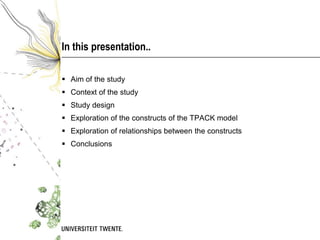
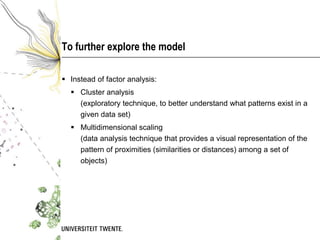
![Stage 2 Research: Observations in Classrooms
Definition:
Full Code:
Teachers integrate technology with
Identifying students’ learning needs
content and pedagogy in mind based
(e.g. content area, technology)
on learners’ needs
701.
TPACK_Learning_Needs
Example:
“It is a lot of work but yet I think they
Key Words: Need
need to be exposed to [emerging
technology].” (Interview)](https://image.slidesharecdn.com/2012-03-05sitetpacksymposium-120305161433-phpapp01/85/2012-03-05-SITE-TPACK-Symposium-82-320.jpg)


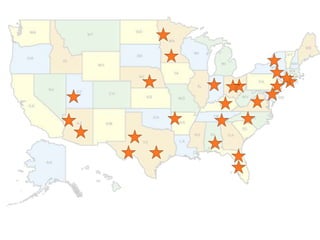
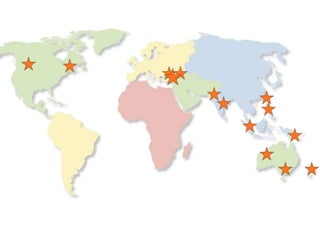
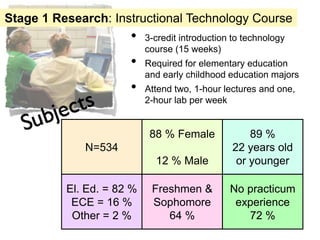
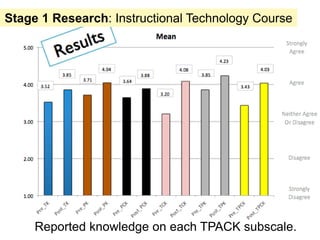
The 2012 TPACK symposium focused on developing strategies for teacher professional development in technology integration across various countries. Presentations explored the assessment of TPACK competencies, highlighting differences between self-reported knowledge and actual outcomes, and emphasized the need for practical, hands-on learning experiences. Insights from studies in Ghana and Tanzania demonstrated the positive impact of technology on teaching practices and student engagement.


