

![Regulatory TriggersRegulatory Triggers
• The use of the Stream Assessment Protocol is triggered by a finding of an
“i d f ll” i h f d i i if O b k Fl d“inadequate outfall” in the context of determining if Overbank Flood
Protection is required due to the impact of a given development site.
• Once such an “inadequate outfall” finding is made, a downstream analysis
iis necessary.
• This method is applied only to a “…clearly defined open channel…”
(Section 7.2.2.D.II; Chapter 7, p. 7.4)
• The assessment reach comprises the channel from “…the outfall(s) from
the site and progress[es] to the Point(s) of Investigation (POI).” (Section
7.2, Chapter 7, p. 7.2)
• See the Procedures and Practices Manual for details on what constitutes an
adequate or inadequate outfall and on how to establish the POI.](https://image.slidesharecdn.com/20110311hbamspscoutfallchannelpresentation-110608210805-phpapp01/85/20110311-hbam-spsc-outfall-channel-presentation-15-320.jpg)


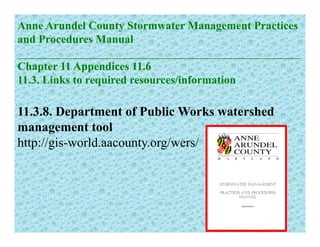
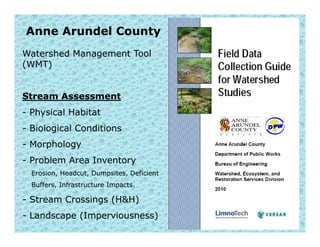
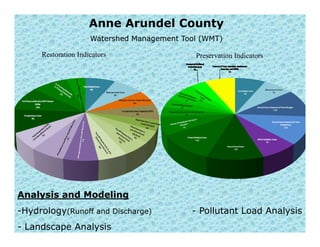
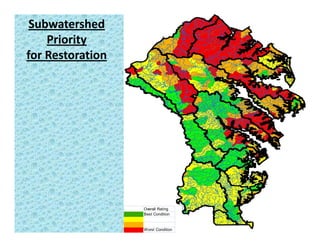
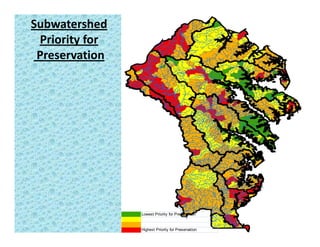
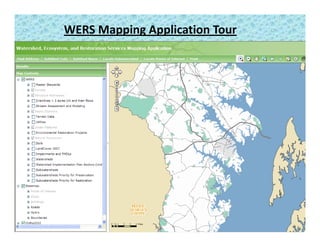
The document provides an overview of watershed assessment and modeling data tools available through Anne Arundel County's Watershed Management Tool. It discusses the tool's capabilities for stream assessment, biological conditions analysis, degraded morphology identification, and subwatershed prioritization. Meeting attendees are introduced to protocols for rapid stream assessment and guidelines for stormwater practices and conveyance structure design.


