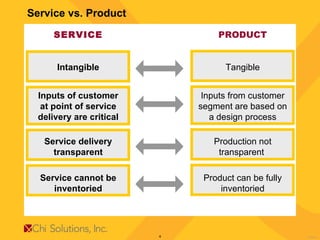
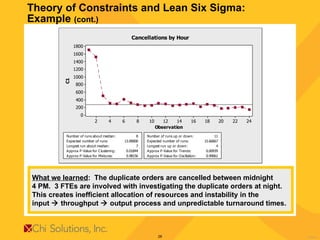
Lessons Learned:  Lean Six Sigma and Balanced Scorecard November 2008 Hans Froehling, DBA/CMBB, Senior Consultant
Intent of this Presentation Learn the key drivers of value satisfaction in the services sectors and how they translate into the laboratory sector. Learn the key differences between products and services and their impact on tools used in Manufacturing vs. Services Lean Six Sigma deployments. Learn how to strategically tie Lean Six Sigma project selection to key value drivers of physicians in the outreach and hospital businesses via Balanced Scorecard or Theory of Constraints. Learn the key lessons learned for an effective deployment of Lean Six Sigma in an organization.  Learn where Lean Six Sigma is heading over the next years.
Lean Six Sigma and  Value of Services
Service vs. Product SERVICE Intangible Inputs of customer at point of service delivery are critical Service delivery transparent Service cannot be inventoried PRODUCT Tangible Inputs from customer segment are based on a design process Production not transparent  Product can be fully inventoried
Key Expectations of Service Two levels of services: Value-added service:  The primary reason for delivering a service is to resolve a key problem of the customer–clinical report of test results to support the diagnosis of a patient. Service failure recovery:  Breakdown of the “value-added service” results in investigations that are handled by “customer service.” Key expectations of value-added services are related to: Effectiveness of  problem resolution  (quality of report, electronic vs. paper report, etc.). Timeliness of resolution  (reporting turnaround time). Additional key expectation for second-level “customer services” are related to: Responsiveness to service breakdown  (Customer Inquiry via Customer Service).
Key Focus of Lean Six Sigma Deployment in Services Focus of Lean Six Sigma Deployments in Services  Value creation through: Effective resolution of problem. Timeliness of solution. Responsiveness to process breakdown.
Strategic Deployment of Lean Six Sigma x Service Aspect Lean Six Sigma for Value Creation Timeliness Effectiveness Responsiveness x Lean Aspect Quality Aspect
Key Drivers of Value Satisfaction in the Outreach Lab Industry Timely Report/Bill Accurate  Report/ Bill Quick Problem Resolution Satisfaction With Value Loyalty Responsiveness Findings Based on Large-Scale Study in the Outreach Business Timeliness Effectiveness
Key Drivers of Value Satisfaction in the  Hospital Lab Industry Findings based on voice of customer Interviews in 14 hospitals Report in Chart When Physician Sees Patient All Test Results in One Chart  and Accurate Quick Access to Lab Effective Patient Care Satisfaction With Value Responsiveness Timeliness Effectiveness
Lean Six Sigma and  Services/Organizational Size
Key Elements of Lean Six Sigma Deployment Key variables that affect Deployment Strategy Manufacturing vs. Service. Size of the organization. Key decisions Overall strategic approach to deployment. Approach to project selection. Criteria for project selection. Roles and responsibilities. Curricula and training. Employee involvement.
Key Factors Affecting the Deployment of  Lean Six Sigma Effective deployments are determined by two key factors: Manufacturing vs. Service Organization Large vs. Mid-sized or Small Organizations Large Organization Small Organization Manufacturing  Services High Structure  Classical Six Sigma and/or classical Lean Challenge to improve cross-functional processes High Structure Hybrid Lean/Six Sigma Challenges to improve cross-functional processes Flexible Structure Classical Six Sigma and/or classical Lean High opportunity to improve cross-functional processes Flexible Structure Hybrid Lean/Six Sigma High opportunity to improve cross-functional processes
Lean Six Sigma and Organization Size Large-Scale Organization Large amount of human and other resources. Challenge of integrating interlocking processes into the scope of one project (PSC and Billing). Very formalized deployment structure: X% of employees to be trained as Black Belts or Green Belts. N amount of projects to be completed by Black Belts or Green Belts. Project selection often driven by “isolated” champions.
Lean Six Sigma and Organization Size  (cont.) Mid-sized/Small Organizations Small amount of human and other resources. Opportunities to integrate interlocking processes into the scope of one project (PSC and Billing). Flexible deployment structure: Limited amount of Black Belts or Green Belts needed. Projects need coordination with other efforts based on resource constraint (non-productive hours). Projects most likely conducted by Green Belts rather than Black Belts. Projects most likely selected based on very specific strategic needs. Potential need to subsume regular project management under the umbrella of “Lean Six Sigma” for a full deployment. Less formalized processes to involve other resources such as IT, Human Resources, etc.
Lean Six Sigma:  Special Challenges for Services Key differences are: Manufacturing :  Supplier, producer, and customer are separated:  (Supplier    Producer    Customer). Services :  Customers are both suppliers and customers  (Customer    Supplier). Physicians are both suppliers (orders) and customers (reports). Integrated standardization of processes and controls need to occur at the supplier (input)    throughput    customer (output) sides. Transparency of the process occurs at a breakdown in the process. Customer Service is a critical element in demonstrating the value of the service in case of a breakdown.  Effective recovery from services enhances the perception of satisfaction with value, which in turn increases loyalty. No process break-down makes the service “invisible” to the customer.
Lean Six Sigma:  Special Challenges for Services (cont.) The basic principles of Lean and Six Sigma are applicable to both manufacturing of products and delivery of services.  However: Engineering specifications are more difficult to establish, particularly in customer contact areas.  Certain Lean tools such as Heijinka or Kanban systems are less complex in service environments. There is no big need to apply complex statistical tools such as design of experiments in a service environment on a regular basis. There are other tools such as ongoing customer feedback, interviews, focus groups, and survey research that are more important in service organizations. Service levels are highly dependent on “capacity”, i.e., FTE availability. Capacity is the “buffer” in services that is equivalent to “inventories” in manufacturing.
Lean Six Sigma:  Special Opportunities for Services in Mid-sized Organizations Cross-functional teams that review the total value-stream from Ordering    PSC draw    Transportation    Accessioning    Resulting    Reporting    Billing are easier to facilitate.  Result :  Quicker and more effective impact on end-customers. With a focused approach based on key tools such as process mapping, value stream mapping, FMEA, and basic root cause analysis, many problems can be solved effectively. Impact :  Training can be rolled out with less intensity of training. The involvement of first-line supervisors and employees is easier to establish because of fewer layers in management. Result :  Buy-in from employees can be more effectively established. Channels of communication to discuss improvement opportunities can be quickly established due to shortened communication chains.  Impact :  Feedback on measurements and analysis can be accomplished faster through immediate feedback from managers/directors.  Impact :  Shorter project cycle time.
Using Balanced Scorecard and Theory of Constraints to Identify Strategically Lean Six Sigma Projects
Approaches to Project Selection:  Overview (1) Opportunistic Approach (Brainstorming leads to project selection): Projects are scattered over the organization. Projects address current problems. Momentum often for several months only. Strategic Approach (Projects are tied to strategic plan): Projects chosen by key process areas. Projects prioritized based on key measurements.  May result in short-lived momentum.  Value Creation Approach (Projects are tied to VOC and Value): Projects are driven by perceived value and customer satisfaction/loyalty. Projects are driven by performance relative to competitors (benchmarking, balanced scorecard, value proposition). Ensures that projects are externally focused on the marketplace. Adapted from Snee & Hoerl (2003).
Approach to Project Selection:  Overview (2) Strategic Plan (External/Internal Voice of Customer Financial Performance Process Performance Value Design/Redesign Projects Lean Projects Error Reduction (Quality) Projects
Balanced Scorecard and Lean Six Sigma:  Making the Scorecard Operational Driver A Driver B Driver C Satisfaction Loyalty Key Drivers of  Value Satisfaction and Loyalty Operational Scorecard for driver Lean Six Sigma project to eliminate waste for driver Reduction in defect rate Lowered costs Employee growth Increased satisfaction Operational Performance Learning and Growth Satisfaction Financial Results
Balanced Scorecard and Lean Six Sigma:  Establish Operational Measurement Step 1:  Identify Key Drivers of Satisfaction  Client wants fast access to representative Client wants issue resolved on the first call Step 2:  Develop Operational Scorecard Outcome Measures Average Speed of Answer Uptime of Voice Respond Unit Rate of Resolution (on first, second, etc., call) Support Measures FTE Available Non-productive Time Turnover Training Hours Financial Measures Cost for Month Budget Variance from Budget Driver A Driver B Driver C Satisfaction Loyalty
Balanced Scorecard and Lean Six Sigma:  Review Variance of Operational Measurement Step 3:  Identify Key Measure that Does Not Meet Goal Example:  Rate of Resolution What we learned :  43% of calls are resolved on the first call (cost = $2.50),  33% require outbound call (cost = $7.50), 24% are solved on weekends at the end of the month requiring overtime (cost = $10).
Balanced Scorecard and Lean Six Sigma:  Identify and Conduct Lean Six Sigma Project Step 4:  Analyze and Review the Current Process High level process map of call transfer What we learned :  The current process creates unnecessary costs.  opening of tickets takes on average two minutes, 2 nd  level rep makes outbound call after the ticket was put in queue.  Process: Results in lost time due to queuing. Results in additional costs due to outbound calls. More tickets are created than 2 nd  level reps can handle. End-of-month overtime to resolve month’s issues. Start 1 st  Level rep takes call   Resolution? Resolve call Open ticket 2 nd  level rep  outbound calls Start
Balanced Scorecard and Lean Six Sigma:  Make Change and Measure Impact  Step 5:  Make Changes and Measure the Impact Reduction in open tickets to less than 500 a month What we learned :  Rather than open tickets, the calls are now  transferred real time.  This resulted in: Decreased costs (estimated at $500,000 per year). Improved satisfaction with resolution. Empowerment and growth of employees.
Theory of Constraints and Lean Six Sigma:  Identify the Right Projects  Challenges Partial roll-outs in organization (lab, radiology, etc. only). Theory of constraints shows us that: The key bottleneck needs to be improved for results to improve throughput. The bottleneck will move once it has been removed. Implications Improvement of key measurements for partial roll-out area may not result in tangible outcomes to the customer.  Projects (multigenerational) need to “follow” the bottleneck. The bottleneck should be pushed out of operations into the market.
Theory of Constraints and Lean Six Sigma:  Example  Bottleneck Problem :  TAT from received to verify is affected by % of duplicate order. In  Project 1 , the duplicate order was be reduced to stabilize the process. In  Project 2 , the lab was leaned out to improve the turnaround associated with actual testing. Phlebotomist Drop Off Specimen in Lab Phlebotomist Draws Dispatch Phlebotomist Verified Results In LIS Match Order to Label Specimen Gets Analyzed Process Area Received Specimen Nurse Generates an Order in LIS OE to LIS Physician Orders Beginning Process End Process
Theory of Constraints and Lean Six Sigma:  Example  (cont.)   What we learned :  The duplicate orders are cancelled between midnight  4 PM.  3 FTEs are involved with investigating the duplicate orders at night.  This creates inefficient allocation of resources and instability in the  input    throughput    output process and unpredictable turnaround times.
Lessons Learned About Key  Elements of a Successful  Lean Six Sigma Deployment
Lessons Learned:  Criteria for Project Selection Tied to a key process of Company value chain. Tied to key metrics such as: Quality:  DPMO, Sigma score (< 3.5  σ ), or high customer impact. Cycle Time (long or highly variable relative to customer expectations). Savings/Revenues ($50K - $250K annually). New Products/Services. Critical infrastructure (IT/New Offerings). Completed within four to six months (if not Multigenerational Plan). Focus on Value creation and Operations Excellence. Viewed as critical by the Champion and the Leadership Team. Process owner clearly exists or established through the project. Prioritized based on impact to the total organization. High probability of feasibility and success.
Lessons Learned:  Roles and Responsibilities Develop a Lean Six Sigma Council: Deployment strategy. Project selection criteria. Ongoing monitoring of progress. Develop a Belt Infrastructure: Adapt roles and number of trained Belts to the resources and needs of the organization. Adapt training to the resources and needs of the organization. Emphasize coaching and mentoring by experienced Black Belts or Master Black Belts. Work closely with HR to develop transition plans into Six Sigma and back into operations. Balance analytical skills with change management skills.
Lessons Learned:  Employee Involvement Video/DVD production: What is Lean/Six Sigma? (10-15 minutes). How do we deploy Lean/Six Sigma at Company? (10-15 minutes). Communication of annual strategy at Staff Meetings and regular updates. Articles in “Newsletters.” Message on “Message Board.” Key Metrics displayed when project in progress or in control phase. Ongoing communication to all employees:  Tell ’em, tell ’em, tell ’em. Involvement through Yellow Belt training. High visibility of project success. Emphasize team building. Get operations employees involved in the first year of the program!
Lessons Learned:  Curricula and Training Systems (1) Fewer opportunities to run experiments:  Transactional exchanges are less conducive to controlled manipulation than processing of unanimated products.  Less emphasis on design of experiments or complex hypothesis testing techniques. Critical-to-qualities are more complex to establish: Services are individualized.   More opportunities for rigorous voice of customer research including interviewing and data mining techniques.
Lessons Learned:  Curricula and Training Systems (2) More opportunities for simpler statistical tools and logic-based approaches to problem solving and process improvement:  Implementation of key  L ean principles  (FIFO, cell design, 5S, etc.) to improve process flow and ensure  timeliness  of service delivery. Basic root cause analysis  to improve quality and ensure  consistent problem resolution . Standardization of processes  to maintain process stability to ensure  consistent problem resolution . Risk analysis  of customer inputs and process inputs (FMEA) to ensure ongoing control of existing processes and  consistent problem resolution . Training of employees  and effective interaction of employees with clients/employees to ensure  avoidance of and quick responsiveness to process breakdowns .
Where is  Lean Six Sigma Going?
Current Trends (1) Lean Six Sigma is in a maturity phase. Stronger integration of various methodologies including Lean, Six Sigma, Theory of Constraints, Balanced Scorecards, Relationship Management, Service Quality. Lean Six Sigma means different things to different organizations. Every organization has to find its way to incorporate Lean Six Sigma into its cultural fabric. Lean Six Sigma is more and more deployed in mid-sized to small organizations. The rule of thumb approach in large organizations (1% of the population are Black Belts, project savings require > $250K, etc.) often do not hold in smaller organizations. Multiple priorities (Employee Training, Lean Six Sigma, Quality, etc.) need to be taken into consideration for an organization to sustain a full-scale implementation.
Current Trends (2) Lean Six Sigma moves from being a quality program to becoming an integrated part of strategic decision making: Lean Six Sigma is integrating more and more elements from classical marketing into its “toolkits” (Voice of Customer Research, Quality Function Deployment, etc.). Marketing and other functions are discovering the advantages of a process view of their activities. Healthcare is becoming the new frontier for Lean Six Sigma.  Key challenge:  Adapt the methodology to the needs, opportunities, and constraints of healthcare organizations.  Get physicians involved as stakeholders, process suppliers, and customers of the process outputs.
Current Trends (3) Functional Approach  Marketing Strategy Operations Value-added Approach Value Marketing Strategy Operations Excellence
Follow-up Any questions or comments regarding this presentation can be forwarded to:  Hans Froehling, DBA/CMBB Senior Consultant [email_address]

2008 Nov Lessons Learned Lean Six Sigma Balanced Scorecard

  • 1.
    Lessons Learned: Lean Six Sigma and Balanced Scorecard November 2008 Hans Froehling, DBA/CMBB, Senior Consultant
  • 2.
    Intent of thisPresentation Learn the key drivers of value satisfaction in the services sectors and how they translate into the laboratory sector. Learn the key differences between products and services and their impact on tools used in Manufacturing vs. Services Lean Six Sigma deployments. Learn how to strategically tie Lean Six Sigma project selection to key value drivers of physicians in the outreach and hospital businesses via Balanced Scorecard or Theory of Constraints. Learn the key lessons learned for an effective deployment of Lean Six Sigma in an organization. Learn where Lean Six Sigma is heading over the next years.
  • 3.
    Lean Six Sigmaand Value of Services
  • 4.
    Service vs. ProductSERVICE Intangible Inputs of customer at point of service delivery are critical Service delivery transparent Service cannot be inventoried PRODUCT Tangible Inputs from customer segment are based on a design process Production not transparent Product can be fully inventoried
  • 5.
    Key Expectations ofService Two levels of services: Value-added service: The primary reason for delivering a service is to resolve a key problem of the customer–clinical report of test results to support the diagnosis of a patient. Service failure recovery: Breakdown of the “value-added service” results in investigations that are handled by “customer service.” Key expectations of value-added services are related to: Effectiveness of problem resolution (quality of report, electronic vs. paper report, etc.). Timeliness of resolution (reporting turnaround time). Additional key expectation for second-level “customer services” are related to: Responsiveness to service breakdown (Customer Inquiry via Customer Service).
  • 6.
    Key Focus ofLean Six Sigma Deployment in Services Focus of Lean Six Sigma Deployments in Services Value creation through: Effective resolution of problem. Timeliness of solution. Responsiveness to process breakdown.
  • 7.
    Strategic Deployment ofLean Six Sigma x Service Aspect Lean Six Sigma for Value Creation Timeliness Effectiveness Responsiveness x Lean Aspect Quality Aspect
  • 8.
    Key Drivers ofValue Satisfaction in the Outreach Lab Industry Timely Report/Bill Accurate Report/ Bill Quick Problem Resolution Satisfaction With Value Loyalty Responsiveness Findings Based on Large-Scale Study in the Outreach Business Timeliness Effectiveness
  • 9.
    Key Drivers ofValue Satisfaction in the Hospital Lab Industry Findings based on voice of customer Interviews in 14 hospitals Report in Chart When Physician Sees Patient All Test Results in One Chart and Accurate Quick Access to Lab Effective Patient Care Satisfaction With Value Responsiveness Timeliness Effectiveness
  • 10.
    Lean Six Sigmaand Services/Organizational Size
  • 11.
    Key Elements ofLean Six Sigma Deployment Key variables that affect Deployment Strategy Manufacturing vs. Service. Size of the organization. Key decisions Overall strategic approach to deployment. Approach to project selection. Criteria for project selection. Roles and responsibilities. Curricula and training. Employee involvement.
  • 12.
    Key Factors Affectingthe Deployment of Lean Six Sigma Effective deployments are determined by two key factors: Manufacturing vs. Service Organization Large vs. Mid-sized or Small Organizations Large Organization Small Organization Manufacturing Services High Structure Classical Six Sigma and/or classical Lean Challenge to improve cross-functional processes High Structure Hybrid Lean/Six Sigma Challenges to improve cross-functional processes Flexible Structure Classical Six Sigma and/or classical Lean High opportunity to improve cross-functional processes Flexible Structure Hybrid Lean/Six Sigma High opportunity to improve cross-functional processes
  • 13.
    Lean Six Sigmaand Organization Size Large-Scale Organization Large amount of human and other resources. Challenge of integrating interlocking processes into the scope of one project (PSC and Billing). Very formalized deployment structure: X% of employees to be trained as Black Belts or Green Belts. N amount of projects to be completed by Black Belts or Green Belts. Project selection often driven by “isolated” champions.
  • 14.
    Lean Six Sigmaand Organization Size (cont.) Mid-sized/Small Organizations Small amount of human and other resources. Opportunities to integrate interlocking processes into the scope of one project (PSC and Billing). Flexible deployment structure: Limited amount of Black Belts or Green Belts needed. Projects need coordination with other efforts based on resource constraint (non-productive hours). Projects most likely conducted by Green Belts rather than Black Belts. Projects most likely selected based on very specific strategic needs. Potential need to subsume regular project management under the umbrella of “Lean Six Sigma” for a full deployment. Less formalized processes to involve other resources such as IT, Human Resources, etc.
  • 15.
    Lean Six Sigma: Special Challenges for Services Key differences are: Manufacturing : Supplier, producer, and customer are separated: (Supplier  Producer  Customer). Services : Customers are both suppliers and customers (Customer  Supplier). Physicians are both suppliers (orders) and customers (reports). Integrated standardization of processes and controls need to occur at the supplier (input)  throughput  customer (output) sides. Transparency of the process occurs at a breakdown in the process. Customer Service is a critical element in demonstrating the value of the service in case of a breakdown. Effective recovery from services enhances the perception of satisfaction with value, which in turn increases loyalty. No process break-down makes the service “invisible” to the customer.
  • 16.
    Lean Six Sigma: Special Challenges for Services (cont.) The basic principles of Lean and Six Sigma are applicable to both manufacturing of products and delivery of services. However: Engineering specifications are more difficult to establish, particularly in customer contact areas. Certain Lean tools such as Heijinka or Kanban systems are less complex in service environments. There is no big need to apply complex statistical tools such as design of experiments in a service environment on a regular basis. There are other tools such as ongoing customer feedback, interviews, focus groups, and survey research that are more important in service organizations. Service levels are highly dependent on “capacity”, i.e., FTE availability. Capacity is the “buffer” in services that is equivalent to “inventories” in manufacturing.
  • 17.
    Lean Six Sigma: Special Opportunities for Services in Mid-sized Organizations Cross-functional teams that review the total value-stream from Ordering  PSC draw  Transportation  Accessioning  Resulting  Reporting  Billing are easier to facilitate. Result : Quicker and more effective impact on end-customers. With a focused approach based on key tools such as process mapping, value stream mapping, FMEA, and basic root cause analysis, many problems can be solved effectively. Impact : Training can be rolled out with less intensity of training. The involvement of first-line supervisors and employees is easier to establish because of fewer layers in management. Result : Buy-in from employees can be more effectively established. Channels of communication to discuss improvement opportunities can be quickly established due to shortened communication chains. Impact : Feedback on measurements and analysis can be accomplished faster through immediate feedback from managers/directors. Impact : Shorter project cycle time.
  • 18.
    Using Balanced Scorecardand Theory of Constraints to Identify Strategically Lean Six Sigma Projects
  • 19.
    Approaches to ProjectSelection: Overview (1) Opportunistic Approach (Brainstorming leads to project selection): Projects are scattered over the organization. Projects address current problems. Momentum often for several months only. Strategic Approach (Projects are tied to strategic plan): Projects chosen by key process areas. Projects prioritized based on key measurements. May result in short-lived momentum. Value Creation Approach (Projects are tied to VOC and Value): Projects are driven by perceived value and customer satisfaction/loyalty. Projects are driven by performance relative to competitors (benchmarking, balanced scorecard, value proposition). Ensures that projects are externally focused on the marketplace. Adapted from Snee & Hoerl (2003).
  • 20.
    Approach to ProjectSelection: Overview (2) Strategic Plan (External/Internal Voice of Customer Financial Performance Process Performance Value Design/Redesign Projects Lean Projects Error Reduction (Quality) Projects
  • 21.
    Balanced Scorecard andLean Six Sigma: Making the Scorecard Operational Driver A Driver B Driver C Satisfaction Loyalty Key Drivers of Value Satisfaction and Loyalty Operational Scorecard for driver Lean Six Sigma project to eliminate waste for driver Reduction in defect rate Lowered costs Employee growth Increased satisfaction Operational Performance Learning and Growth Satisfaction Financial Results
  • 22.
    Balanced Scorecard andLean Six Sigma: Establish Operational Measurement Step 1: Identify Key Drivers of Satisfaction Client wants fast access to representative Client wants issue resolved on the first call Step 2: Develop Operational Scorecard Outcome Measures Average Speed of Answer Uptime of Voice Respond Unit Rate of Resolution (on first, second, etc., call) Support Measures FTE Available Non-productive Time Turnover Training Hours Financial Measures Cost for Month Budget Variance from Budget Driver A Driver B Driver C Satisfaction Loyalty
  • 23.
    Balanced Scorecard andLean Six Sigma: Review Variance of Operational Measurement Step 3: Identify Key Measure that Does Not Meet Goal Example: Rate of Resolution What we learned : 43% of calls are resolved on the first call (cost = $2.50), 33% require outbound call (cost = $7.50), 24% are solved on weekends at the end of the month requiring overtime (cost = $10).
  • 24.
    Balanced Scorecard andLean Six Sigma: Identify and Conduct Lean Six Sigma Project Step 4: Analyze and Review the Current Process High level process map of call transfer What we learned : The current process creates unnecessary costs. opening of tickets takes on average two minutes, 2 nd level rep makes outbound call after the ticket was put in queue. Process: Results in lost time due to queuing. Results in additional costs due to outbound calls. More tickets are created than 2 nd level reps can handle. End-of-month overtime to resolve month’s issues. Start 1 st Level rep takes call Resolution? Resolve call Open ticket 2 nd level rep outbound calls Start
  • 25.
    Balanced Scorecard andLean Six Sigma: Make Change and Measure Impact Step 5: Make Changes and Measure the Impact Reduction in open tickets to less than 500 a month What we learned : Rather than open tickets, the calls are now transferred real time. This resulted in: Decreased costs (estimated at $500,000 per year). Improved satisfaction with resolution. Empowerment and growth of employees.
  • 26.
    Theory of Constraintsand Lean Six Sigma: Identify the Right Projects Challenges Partial roll-outs in organization (lab, radiology, etc. only). Theory of constraints shows us that: The key bottleneck needs to be improved for results to improve throughput. The bottleneck will move once it has been removed. Implications Improvement of key measurements for partial roll-out area may not result in tangible outcomes to the customer. Projects (multigenerational) need to “follow” the bottleneck. The bottleneck should be pushed out of operations into the market.
  • 27.
    Theory of Constraintsand Lean Six Sigma: Example Bottleneck Problem : TAT from received to verify is affected by % of duplicate order. In Project 1 , the duplicate order was be reduced to stabilize the process. In Project 2 , the lab was leaned out to improve the turnaround associated with actual testing. Phlebotomist Drop Off Specimen in Lab Phlebotomist Draws Dispatch Phlebotomist Verified Results In LIS Match Order to Label Specimen Gets Analyzed Process Area Received Specimen Nurse Generates an Order in LIS OE to LIS Physician Orders Beginning Process End Process
  • 28.
    Theory of Constraintsand Lean Six Sigma: Example (cont.) What we learned : The duplicate orders are cancelled between midnight 4 PM. 3 FTEs are involved with investigating the duplicate orders at night. This creates inefficient allocation of resources and instability in the input  throughput  output process and unpredictable turnaround times.
  • 29.
    Lessons Learned AboutKey Elements of a Successful Lean Six Sigma Deployment
  • 30.
    Lessons Learned: Criteria for Project Selection Tied to a key process of Company value chain. Tied to key metrics such as: Quality: DPMO, Sigma score (< 3.5 σ ), or high customer impact. Cycle Time (long or highly variable relative to customer expectations). Savings/Revenues ($50K - $250K annually). New Products/Services. Critical infrastructure (IT/New Offerings). Completed within four to six months (if not Multigenerational Plan). Focus on Value creation and Operations Excellence. Viewed as critical by the Champion and the Leadership Team. Process owner clearly exists or established through the project. Prioritized based on impact to the total organization. High probability of feasibility and success.
  • 31.
    Lessons Learned: Roles and Responsibilities Develop a Lean Six Sigma Council: Deployment strategy. Project selection criteria. Ongoing monitoring of progress. Develop a Belt Infrastructure: Adapt roles and number of trained Belts to the resources and needs of the organization. Adapt training to the resources and needs of the organization. Emphasize coaching and mentoring by experienced Black Belts or Master Black Belts. Work closely with HR to develop transition plans into Six Sigma and back into operations. Balance analytical skills with change management skills.
  • 32.
    Lessons Learned: Employee Involvement Video/DVD production: What is Lean/Six Sigma? (10-15 minutes). How do we deploy Lean/Six Sigma at Company? (10-15 minutes). Communication of annual strategy at Staff Meetings and regular updates. Articles in “Newsletters.” Message on “Message Board.” Key Metrics displayed when project in progress or in control phase. Ongoing communication to all employees: Tell ’em, tell ’em, tell ’em. Involvement through Yellow Belt training. High visibility of project success. Emphasize team building. Get operations employees involved in the first year of the program!
  • 33.
    Lessons Learned: Curricula and Training Systems (1) Fewer opportunities to run experiments: Transactional exchanges are less conducive to controlled manipulation than processing of unanimated products.  Less emphasis on design of experiments or complex hypothesis testing techniques. Critical-to-qualities are more complex to establish: Services are individualized.  More opportunities for rigorous voice of customer research including interviewing and data mining techniques.
  • 34.
    Lessons Learned: Curricula and Training Systems (2) More opportunities for simpler statistical tools and logic-based approaches to problem solving and process improvement: Implementation of key L ean principles (FIFO, cell design, 5S, etc.) to improve process flow and ensure timeliness of service delivery. Basic root cause analysis to improve quality and ensure consistent problem resolution . Standardization of processes to maintain process stability to ensure consistent problem resolution . Risk analysis of customer inputs and process inputs (FMEA) to ensure ongoing control of existing processes and consistent problem resolution . Training of employees and effective interaction of employees with clients/employees to ensure avoidance of and quick responsiveness to process breakdowns .
  • 35.
    Where is Lean Six Sigma Going?
  • 36.
    Current Trends (1)Lean Six Sigma is in a maturity phase. Stronger integration of various methodologies including Lean, Six Sigma, Theory of Constraints, Balanced Scorecards, Relationship Management, Service Quality. Lean Six Sigma means different things to different organizations. Every organization has to find its way to incorporate Lean Six Sigma into its cultural fabric. Lean Six Sigma is more and more deployed in mid-sized to small organizations. The rule of thumb approach in large organizations (1% of the population are Black Belts, project savings require > $250K, etc.) often do not hold in smaller organizations. Multiple priorities (Employee Training, Lean Six Sigma, Quality, etc.) need to be taken into consideration for an organization to sustain a full-scale implementation.
  • 37.
    Current Trends (2)Lean Six Sigma moves from being a quality program to becoming an integrated part of strategic decision making: Lean Six Sigma is integrating more and more elements from classical marketing into its “toolkits” (Voice of Customer Research, Quality Function Deployment, etc.). Marketing and other functions are discovering the advantages of a process view of their activities. Healthcare is becoming the new frontier for Lean Six Sigma. Key challenge: Adapt the methodology to the needs, opportunities, and constraints of healthcare organizations. Get physicians involved as stakeholders, process suppliers, and customers of the process outputs.
  • 38.
    Current Trends (3)Functional Approach Marketing Strategy Operations Value-added Approach Value Marketing Strategy Operations Excellence
  • 39.
    Follow-up Any questionsor comments regarding this presentation can be forwarded to: Hans Froehling, DBA/CMBB Senior Consultant [email_address]