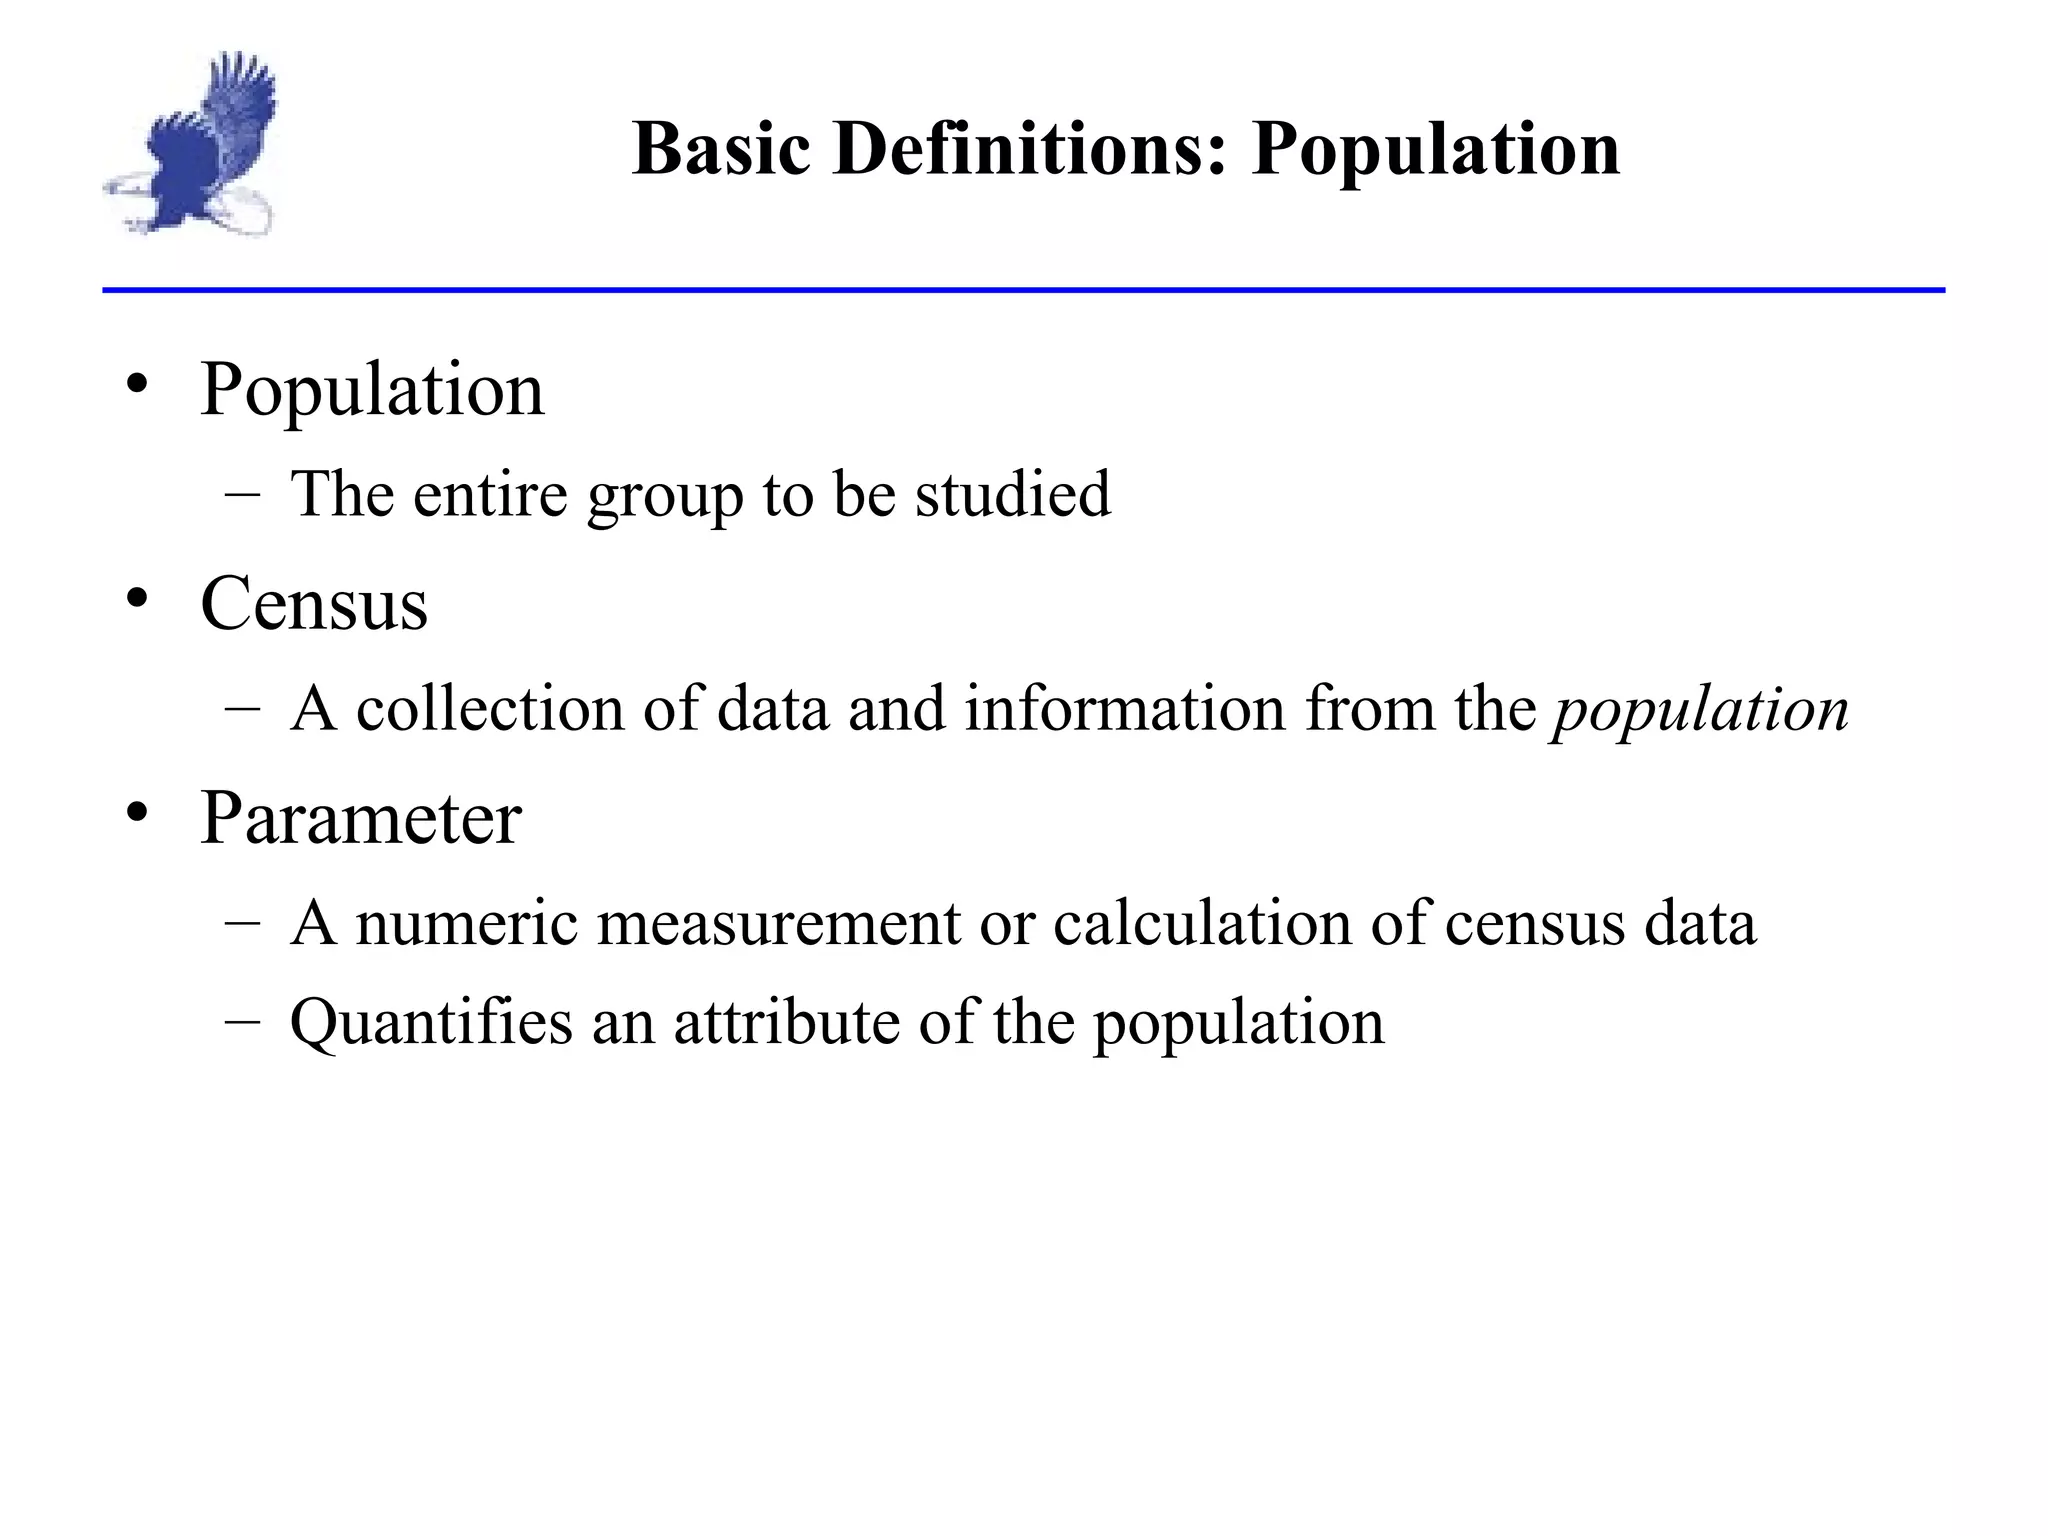
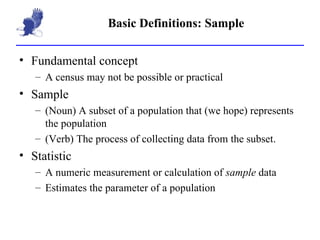
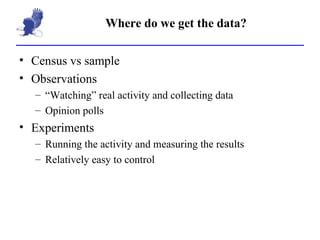
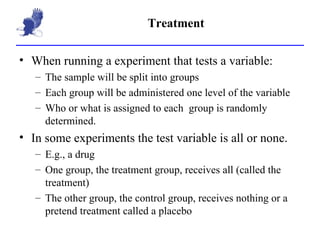
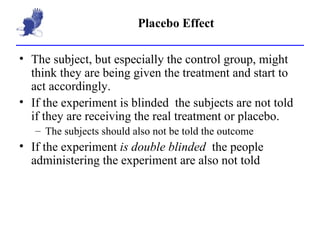
1. The document discusses key concepts in sampling and experiments including populations, parameters, statistics, variables, treatment and control groups, placebos, and bias.
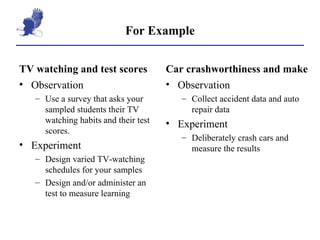
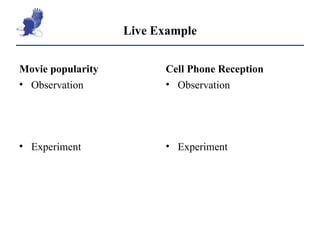
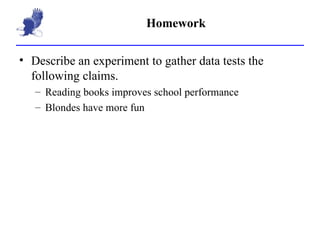
2. It provides examples of experiments that could be conducted to test claims about reading improving school performance and characteristics affecting hair color and fun.
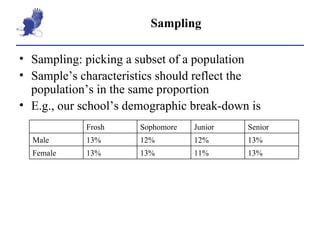
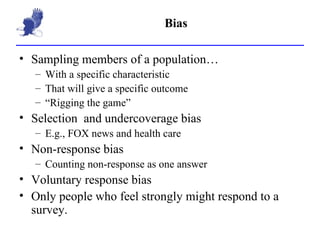
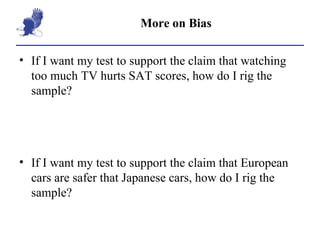
3. Types of sampling discussed include random, stratified, clustered, as well as self-selected and convenience sampling which are more prone to bias. Sources of bias are also outlined.