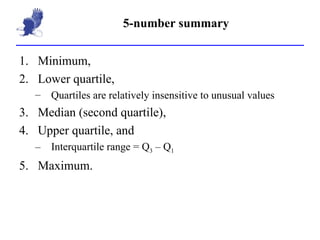
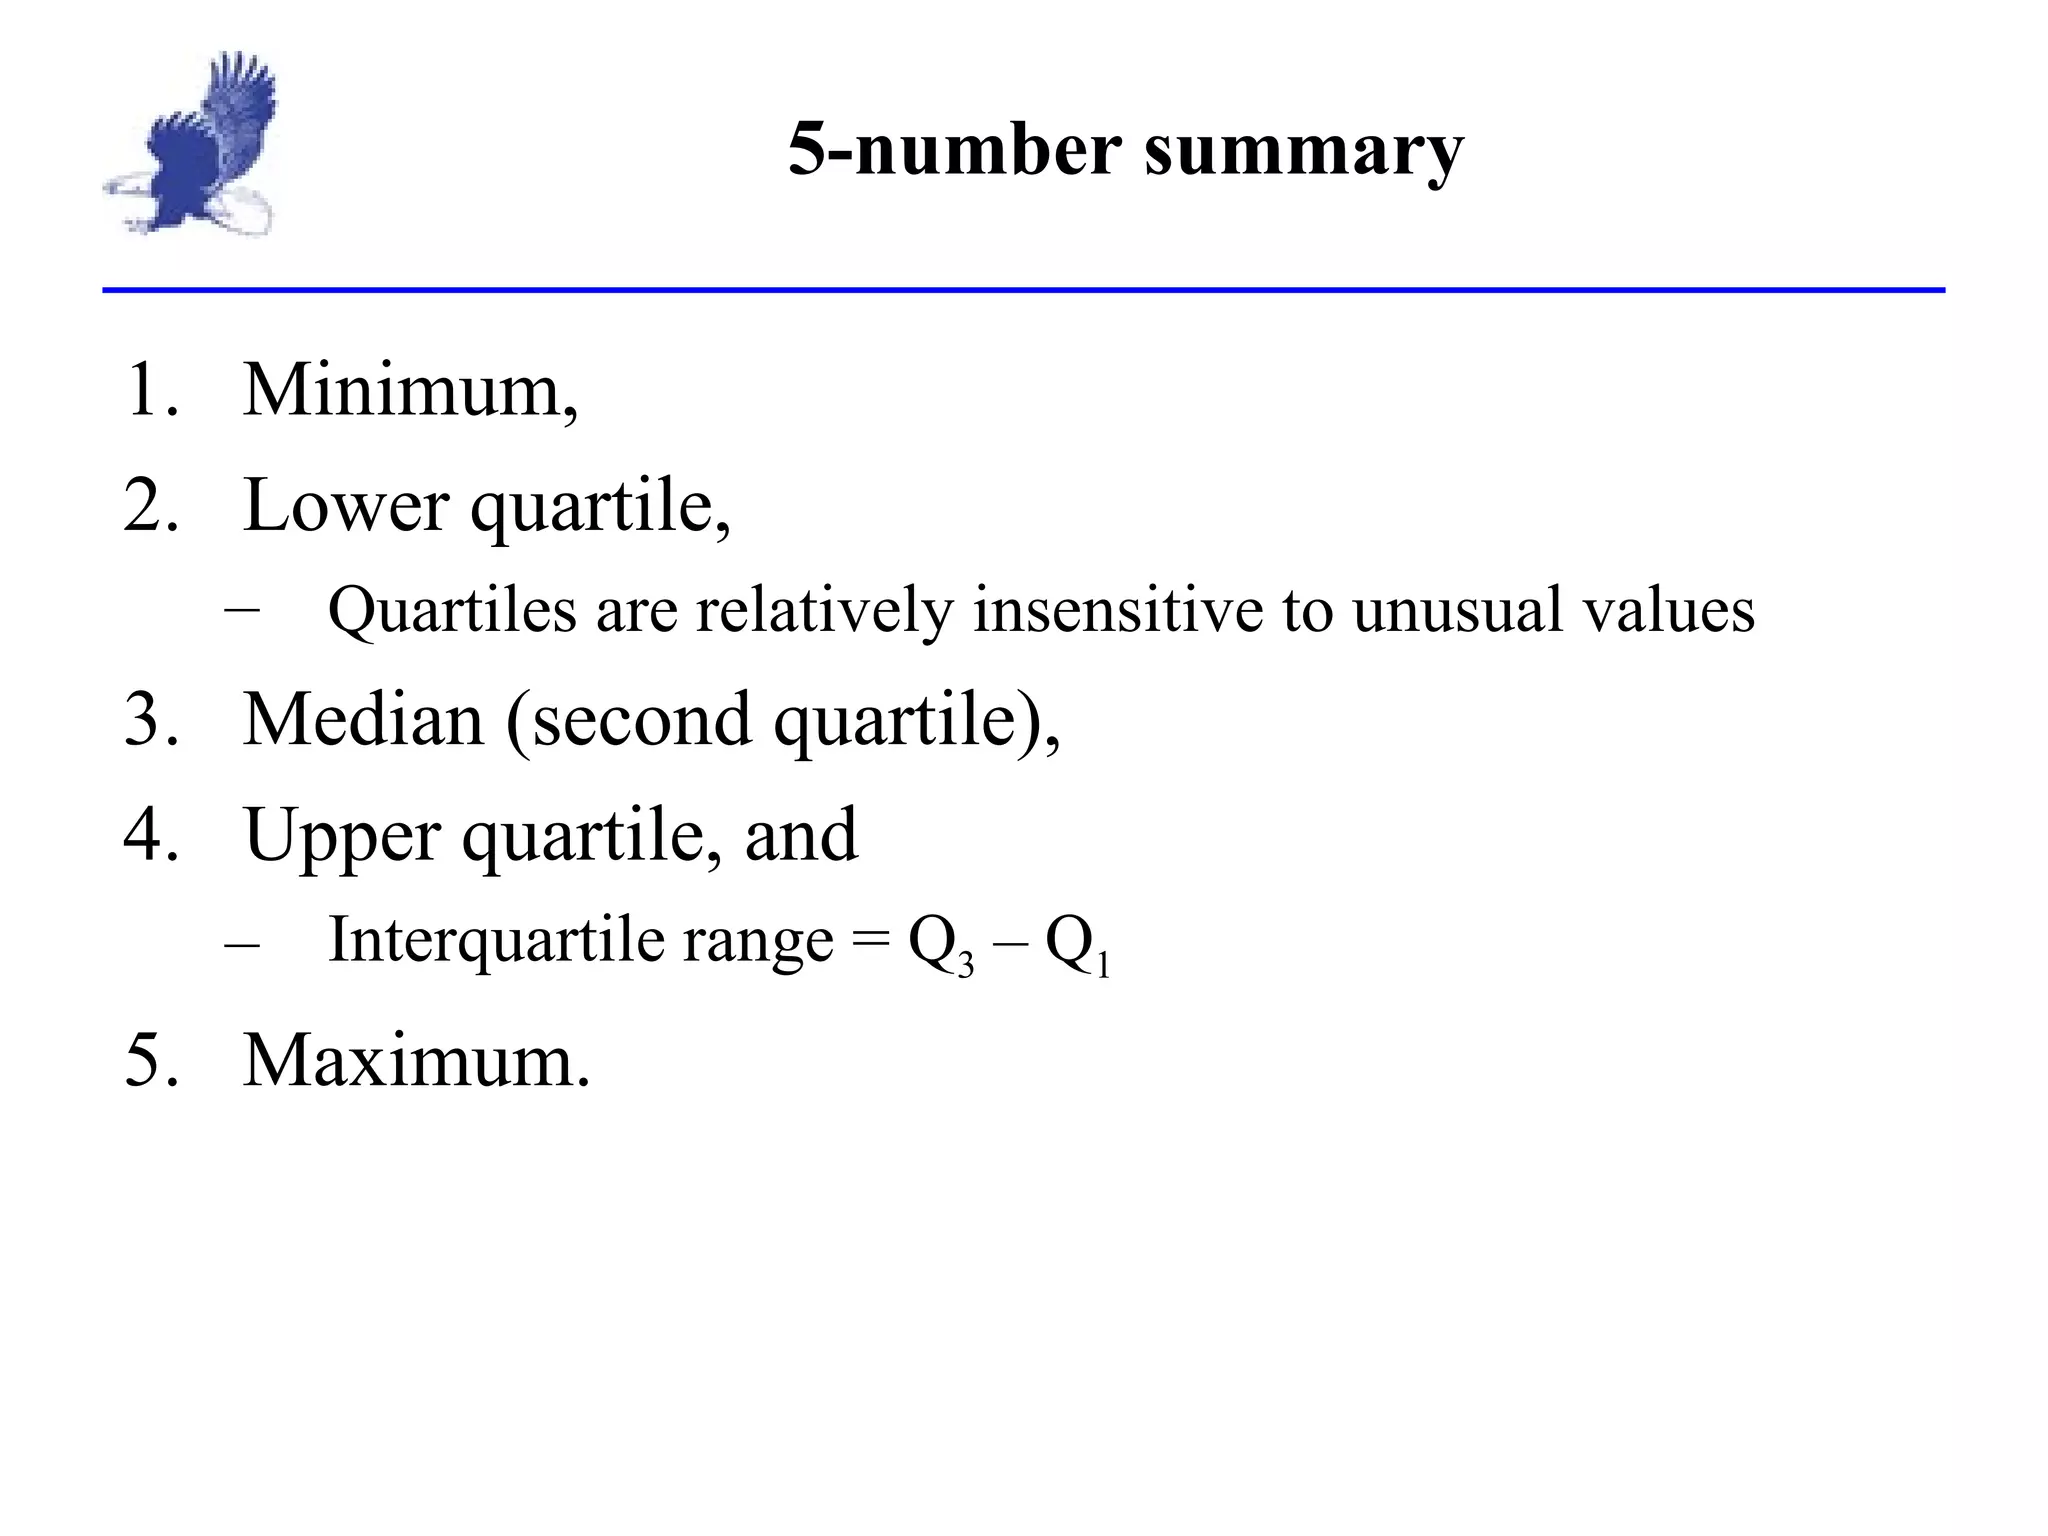
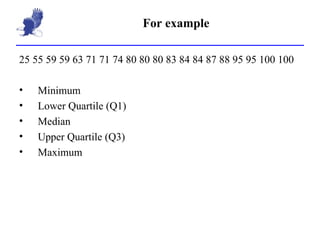
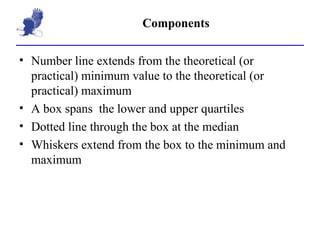
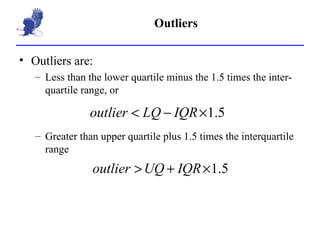
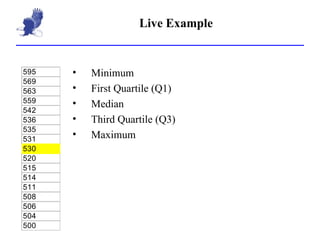
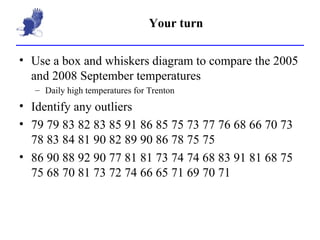
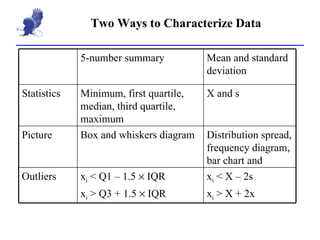
SlideShare a Scribd company logo
5-number summary ,[object Object],[object Object],[object Object],[object Object],[object Object],[object Object],[object Object]
For example ,[object Object],[object Object],[object Object],[object Object],[object Object],[object Object]
Boxplot (box and whiskers diagram) ,[object Object],[object Object]
Components ,[object Object],[object Object],[object Object],[object Object]
Outliers ,[object Object],[object Object],[object Object]
Live Example ,[object Object],[object Object],[object Object],[object Object],[object Object]
Your turn ,[object Object],[object Object],[object Object],[object Object],[object Object]
Two Ways to Characterize Data x i  < X – 2s x i  > X + 2x x i  < Q1 – 1.5    IQR x i  > Q3 + 1.5    IQR Outliers Distribution spread, frequency diagram, bar chart and  Box and whiskers diagram Picture X and s Minimum, first quartile, median, third quartile, maximum Statistics Mean and standard deviation 5-number summary

More Related Content

Viewers also liked

Malimu variance and standard deviation
Malimu variance and standard deviationMalimu variance and standard deviation
Malimu variance and standard deviation
Miharbi Ignasm
 
The Interpretation Of Quartiles And Percentiles July 2009
The Interpretation Of Quartiles And Percentiles   July 2009The Interpretation Of Quartiles And Percentiles   July 2009
The Interpretation Of Quartiles And Percentiles July 2009
Maggie Verster
 
Variance And Standard Deviation
Variance And Standard DeviationVariance And Standard Deviation
Variance And Standard Deviation
Learning Made Simple
 
Grouped Mean Median Mode
Grouped Mean Median ModeGrouped Mean Median Mode
Grouped Mean Median Mode
Passy World
 
Mean, Median, Mode: Measures of Central Tendency
Mean, Median, Mode: Measures of Central Tendency Mean, Median, Mode: Measures of Central Tendency
Mean, Median, Mode: Measures of Central Tendency
Jan Nah
 
Measures of central tendency
Measures of central tendencyMeasures of central tendency
Measures of central tendency
Chie Pegollo
 
Standard Deviation and Variance
Standard Deviation and VarianceStandard Deviation and Variance
Standard Deviation and Variance
Jufil Hombria
 

Viewers also liked (7)

Malimu variance and standard deviation
Malimu variance and standard deviationMalimu variance and standard deviation
Malimu variance and standard deviation
 
The Interpretation Of Quartiles And Percentiles July 2009
The Interpretation Of Quartiles And Percentiles   July 2009The Interpretation Of Quartiles And Percentiles   July 2009
The Interpretation Of Quartiles And Percentiles July 2009
 
Variance And Standard Deviation
Variance And Standard DeviationVariance And Standard Deviation
Variance And Standard Deviation
 
Grouped Mean Median Mode
Grouped Mean Median ModeGrouped Mean Median Mode
Grouped Mean Median Mode
 
Mean, Median, Mode: Measures of Central Tendency
Mean, Median, Mode: Measures of Central Tendency Mean, Median, Mode: Measures of Central Tendency
Mean, Median, Mode: Measures of Central Tendency
 
Measures of central tendency
Measures of central tendencyMeasures of central tendency
Measures of central tendency
 
Standard Deviation and Variance
Standard Deviation and VarianceStandard Deviation and Variance
Standard Deviation and Variance
 

Similar to 2 7 exploratory data analysis

Overview Of Quartile.pptx
Overview Of Quartile.pptxOverview Of Quartile.pptx
Overview Of Quartile.pptx
CHIRANTANMONDAL2
 
TSTD 6251  Fall 2014SPSS Exercise and Assignment 120 PointsI.docx
TSTD 6251  Fall 2014SPSS Exercise and Assignment 120 PointsI.docxTSTD 6251  Fall 2014SPSS Exercise and Assignment 120 PointsI.docx
TSTD 6251  Fall 2014SPSS Exercise and Assignment 120 PointsI.docx
nanamonkton
 
3.3 percentiles and boxandwhisker plot
3.3 percentiles and boxandwhisker plot3.3 percentiles and boxandwhisker plot
3.3 percentiles and boxandwhisker plot
leblance
 
Ejercicio resuelto-de-estadc3adstica-descriptiva1
Ejercicio resuelto-de-estadc3adstica-descriptiva1Ejercicio resuelto-de-estadc3adstica-descriptiva1
Ejercicio resuelto-de-estadc3adstica-descriptiva1
Sandra Hernández Cely
 
Statistic and probability 2
Statistic and probability 2Statistic and probability 2
Statistic and probability 2
Irfan Yaqoob
 
Lecture-2 Descriptive Statistics-Box Plot Descriptive Measures.pdf
Lecture-2 Descriptive Statistics-Box Plot  Descriptive Measures.pdfLecture-2 Descriptive Statistics-Box Plot  Descriptive Measures.pdf
Lecture-2 Descriptive Statistics-Box Plot Descriptive Measures.pdf
AzanHaider1
 
Statistics (Measures of Dispersion)
Statistics (Measures of Dispersion)Statistics (Measures of Dispersion)
Statistics (Measures of Dispersion)
Ron_Eick
 
Chapter 1 descriptive_stats_2_rev_2009
Chapter 1 descriptive_stats_2_rev_2009Chapter 1 descriptive_stats_2_rev_2009
Chapter 1 descriptive_stats_2_rev_2009
ayimsevenfold
 
Summarizing Data : Listing and Grouping pdf
Summarizing Data : Listing and Grouping pdfSummarizing Data : Listing and Grouping pdf
Summarizing Data : Listing and Grouping pdf
JustynOwen
 
The Frequency distribution table.pptx
The Frequency distribution table.pptxThe Frequency distribution table.pptx
The Frequency distribution table.pptx
mariadanielapereyra
 
Stats chapter 1
Stats chapter 1Stats chapter 1
Stats chapter 1
Richard Ferreria
 
Penggambaran Data Secara Numerik
Penggambaran Data Secara NumerikPenggambaran Data Secara Numerik
Penggambaran Data Secara Numerik
anom1392
 
C2 st lecture 13 revision for test b handout
C2 st lecture 13   revision for test b handoutC2 st lecture 13   revision for test b handout
C2 st lecture 13 revision for test b handout
fatima d
 
Measures of Relative Standing and Boxplots
Measures of Relative Standing and BoxplotsMeasures of Relative Standing and Boxplots
Measures of Relative Standing and Boxplots
Long Beach City College
 
Box and-whisker-plots
Box and-whisker-plotsBox and-whisker-plots
Box and-whisker-plots
Ajay Gupta
 
Biostat_Chapter6_Part3.pdf Bio Statistics
Biostat_Chapter6_Part3.pdf Bio StatisticsBiostat_Chapter6_Part3.pdf Bio Statistics
Biostat_Chapter6_Part3.pdf Bio Statistics
ArwaAbdelHamid1
 
Freq & Histo
Freq & HistoFreq & Histo
Freq & Histo
kliegey524
 
lecture8.ppt
lecture8.pptlecture8.ppt
lecture8.ppt
AlokKumar969617
 
Lecture8
Lecture8Lecture8
Lecture8
giftcertificate
 
Measures of Variation (Ungrouped Data)
Measures of Variation (Ungrouped Data)Measures of Variation (Ungrouped Data)
Measures of Variation (Ungrouped Data)
Zaira Mae
 

Similar to 2 7 exploratory data analysis (20)

Overview Of Quartile.pptx
Overview Of Quartile.pptxOverview Of Quartile.pptx
Overview Of Quartile.pptx
 
TSTD 6251  Fall 2014SPSS Exercise and Assignment 120 PointsI.docx
TSTD 6251  Fall 2014SPSS Exercise and Assignment 120 PointsI.docxTSTD 6251  Fall 2014SPSS Exercise and Assignment 120 PointsI.docx
TSTD 6251  Fall 2014SPSS Exercise and Assignment 120 PointsI.docx
 
3.3 percentiles and boxandwhisker plot
3.3 percentiles and boxandwhisker plot3.3 percentiles and boxandwhisker plot
3.3 percentiles and boxandwhisker plot
 
Ejercicio resuelto-de-estadc3adstica-descriptiva1
Ejercicio resuelto-de-estadc3adstica-descriptiva1Ejercicio resuelto-de-estadc3adstica-descriptiva1
Ejercicio resuelto-de-estadc3adstica-descriptiva1
 
Statistic and probability 2
Statistic and probability 2Statistic and probability 2
Statistic and probability 2
 
Lecture-2 Descriptive Statistics-Box Plot Descriptive Measures.pdf
Lecture-2 Descriptive Statistics-Box Plot  Descriptive Measures.pdfLecture-2 Descriptive Statistics-Box Plot  Descriptive Measures.pdf
Lecture-2 Descriptive Statistics-Box Plot Descriptive Measures.pdf
 
Statistics (Measures of Dispersion)
Statistics (Measures of Dispersion)Statistics (Measures of Dispersion)
Statistics (Measures of Dispersion)
 
Chapter 1 descriptive_stats_2_rev_2009
Chapter 1 descriptive_stats_2_rev_2009Chapter 1 descriptive_stats_2_rev_2009
Chapter 1 descriptive_stats_2_rev_2009
 
Summarizing Data : Listing and Grouping pdf
Summarizing Data : Listing and Grouping pdfSummarizing Data : Listing and Grouping pdf
Summarizing Data : Listing and Grouping pdf
 
The Frequency distribution table.pptx
The Frequency distribution table.pptxThe Frequency distribution table.pptx
The Frequency distribution table.pptx
 
Stats chapter 1
Stats chapter 1Stats chapter 1
Stats chapter 1
 
Penggambaran Data Secara Numerik
Penggambaran Data Secara NumerikPenggambaran Data Secara Numerik
Penggambaran Data Secara Numerik
 
C2 st lecture 13 revision for test b handout
C2 st lecture 13   revision for test b handoutC2 st lecture 13   revision for test b handout
C2 st lecture 13 revision for test b handout
 
Measures of Relative Standing and Boxplots
Measures of Relative Standing and BoxplotsMeasures of Relative Standing and Boxplots
Measures of Relative Standing and Boxplots
 
Box and-whisker-plots
Box and-whisker-plotsBox and-whisker-plots
Box and-whisker-plots
 
Biostat_Chapter6_Part3.pdf Bio Statistics
Biostat_Chapter6_Part3.pdf Bio StatisticsBiostat_Chapter6_Part3.pdf Bio Statistics
Biostat_Chapter6_Part3.pdf Bio Statistics
 
Freq & Histo
Freq & HistoFreq & Histo
Freq & Histo
 
lecture8.ppt
lecture8.pptlecture8.ppt
lecture8.ppt
 
Lecture8
Lecture8Lecture8
Lecture8
 
Measures of Variation (Ungrouped Data)
Measures of Variation (Ungrouped Data)Measures of Variation (Ungrouped Data)
Measures of Variation (Ungrouped Data)
 

More from Ken Kretsch

Classical probability
Classical probabilityClassical probability
Classical probability
Ken Kretsch
 
2 4 measures of center
2 4 measures of center2 4 measures of center
2 4 measures of center
Ken Kretsch
 
2 6 measure of position
2 6 measure of position2 6 measure of position
2 6 measure of position
Ken Kretsch
 
2 5 standard deviation
2 5 standard deviation2 5 standard deviation
2 5 standard deviation
Ken Kretsch
 
2 1 frequency table
2 1 frequency table2 1 frequency table
2 1 frequency table
Ken Kretsch
 
2 3 depicting frequency tables
2 3 depicting frequency tables2 3 depicting frequency tables
2 3 depicting frequency tables
Ken Kretsch
 
2 1 data
2 1  data2 1  data
2 1 data
Ken Kretsch
 
2 1 expressions
2 1  expressions2 1  expressions
2 1 expressions
Ken Kretsch
 
\\Dc hss2\staff\kretsch k\prob and stat\class materials\chapter 1\1-4 where d...
\\Dc hss2\staff\kretsch k\prob and stat\class materials\chapter 1\1-4 where d...\\Dc hss2\staff\kretsch k\prob and stat\class materials\chapter 1\1-4 where d...
\\Dc hss2\staff\kretsch k\prob and stat\class materials\chapter 1\1-4 where d...
Ken Kretsch
 
R:\ap java\class slides\chapter 1\1 2 java development
R:\ap java\class slides\chapter 1\1 2 java developmentR:\ap java\class slides\chapter 1\1 2 java development
R:\ap java\class slides\chapter 1\1 2 java development
Ken Kretsch
 
1 2 java development
1 2 java development1 2 java development
1 2 java development
Ken Kretsch
 
Science, invention, and engineering
Science, invention, and engineeringScience, invention, and engineering
Science, invention, and engineering
Ken Kretsch
 
1 4 where do we get the data
1 4 where do we get the data1 4 where do we get the data
1 4 where do we get the data
Ken Kretsch
 
1 1 data
1 1 data1 1 data
1 1 data
Ken Kretsch
 
Programming model
Programming modelProgramming model
Programming model
Ken Kretsch
 

More from Ken Kretsch (15)

Classical probability
Classical probabilityClassical probability
Classical probability
 
2 4 measures of center
2 4 measures of center2 4 measures of center
2 4 measures of center
 
2 6 measure of position
2 6 measure of position2 6 measure of position
2 6 measure of position
 
2 5 standard deviation
2 5 standard deviation2 5 standard deviation
2 5 standard deviation
 
2 1 frequency table
2 1 frequency table2 1 frequency table
2 1 frequency table
 
2 3 depicting frequency tables
2 3 depicting frequency tables2 3 depicting frequency tables
2 3 depicting frequency tables
 
2 1 data
2 1  data2 1  data
2 1 data
 
2 1 expressions
2 1  expressions2 1  expressions
2 1 expressions
 
\\Dc hss2\staff\kretsch k\prob and stat\class materials\chapter 1\1-4 where d...
\\Dc hss2\staff\kretsch k\prob and stat\class materials\chapter 1\1-4 where d...\\Dc hss2\staff\kretsch k\prob and stat\class materials\chapter 1\1-4 where d...
\\Dc hss2\staff\kretsch k\prob and stat\class materials\chapter 1\1-4 where d...
 
R:\ap java\class slides\chapter 1\1 2 java development
R:\ap java\class slides\chapter 1\1 2 java developmentR:\ap java\class slides\chapter 1\1 2 java development
R:\ap java\class slides\chapter 1\1 2 java development
 
1 2 java development
1 2 java development1 2 java development
1 2 java development
 
Science, invention, and engineering
Science, invention, and engineeringScience, invention, and engineering
Science, invention, and engineering
 
1 4 where do we get the data
1 4 where do we get the data1 4 where do we get the data
1 4 where do we get the data
 
1 1 data
1 1 data1 1 data
1 1 data
 
Programming model
Programming modelProgramming model
Programming model
 

2 7 exploratory data analysis

  • 1.
  • 2.
  • 3.
  • 4.
  • 5.
  • 6.
  • 7.
  • 8. Two Ways to Characterize Data x i < X – 2s x i > X + 2x x i < Q1 – 1.5  IQR x i > Q3 + 1.5  IQR Outliers Distribution spread, frequency diagram, bar chart and Box and whiskers diagram Picture X and s Minimum, first quartile, median, third quartile, maximum Statistics Mean and standard deviation 5-number summary