Download as PDF, PPTX

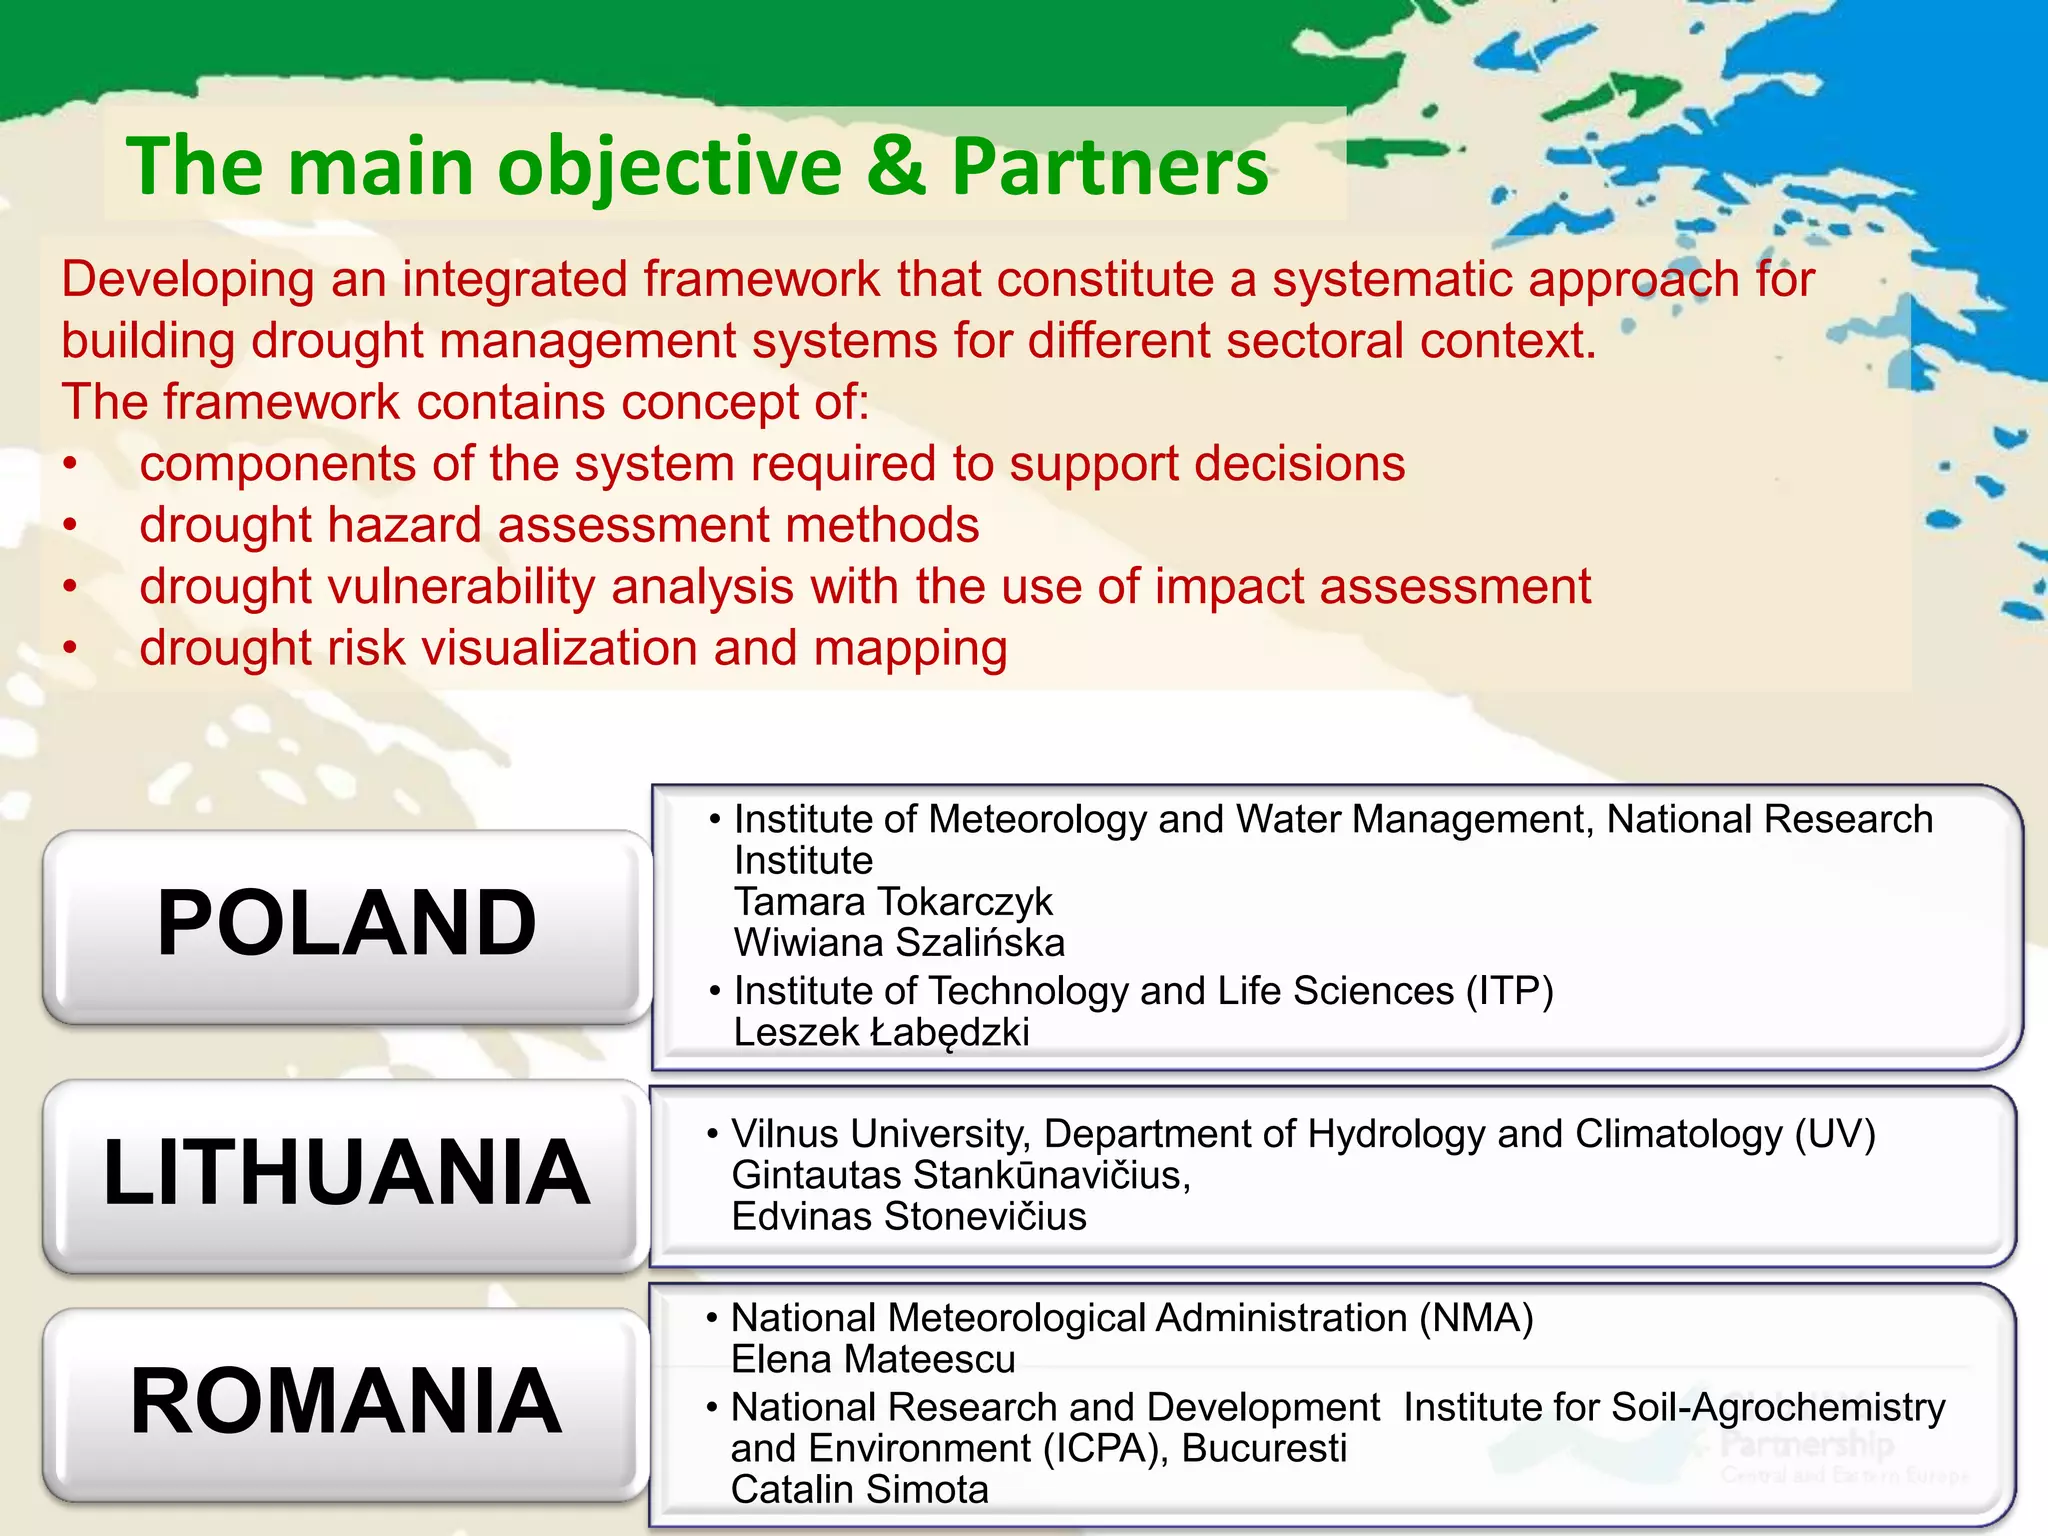

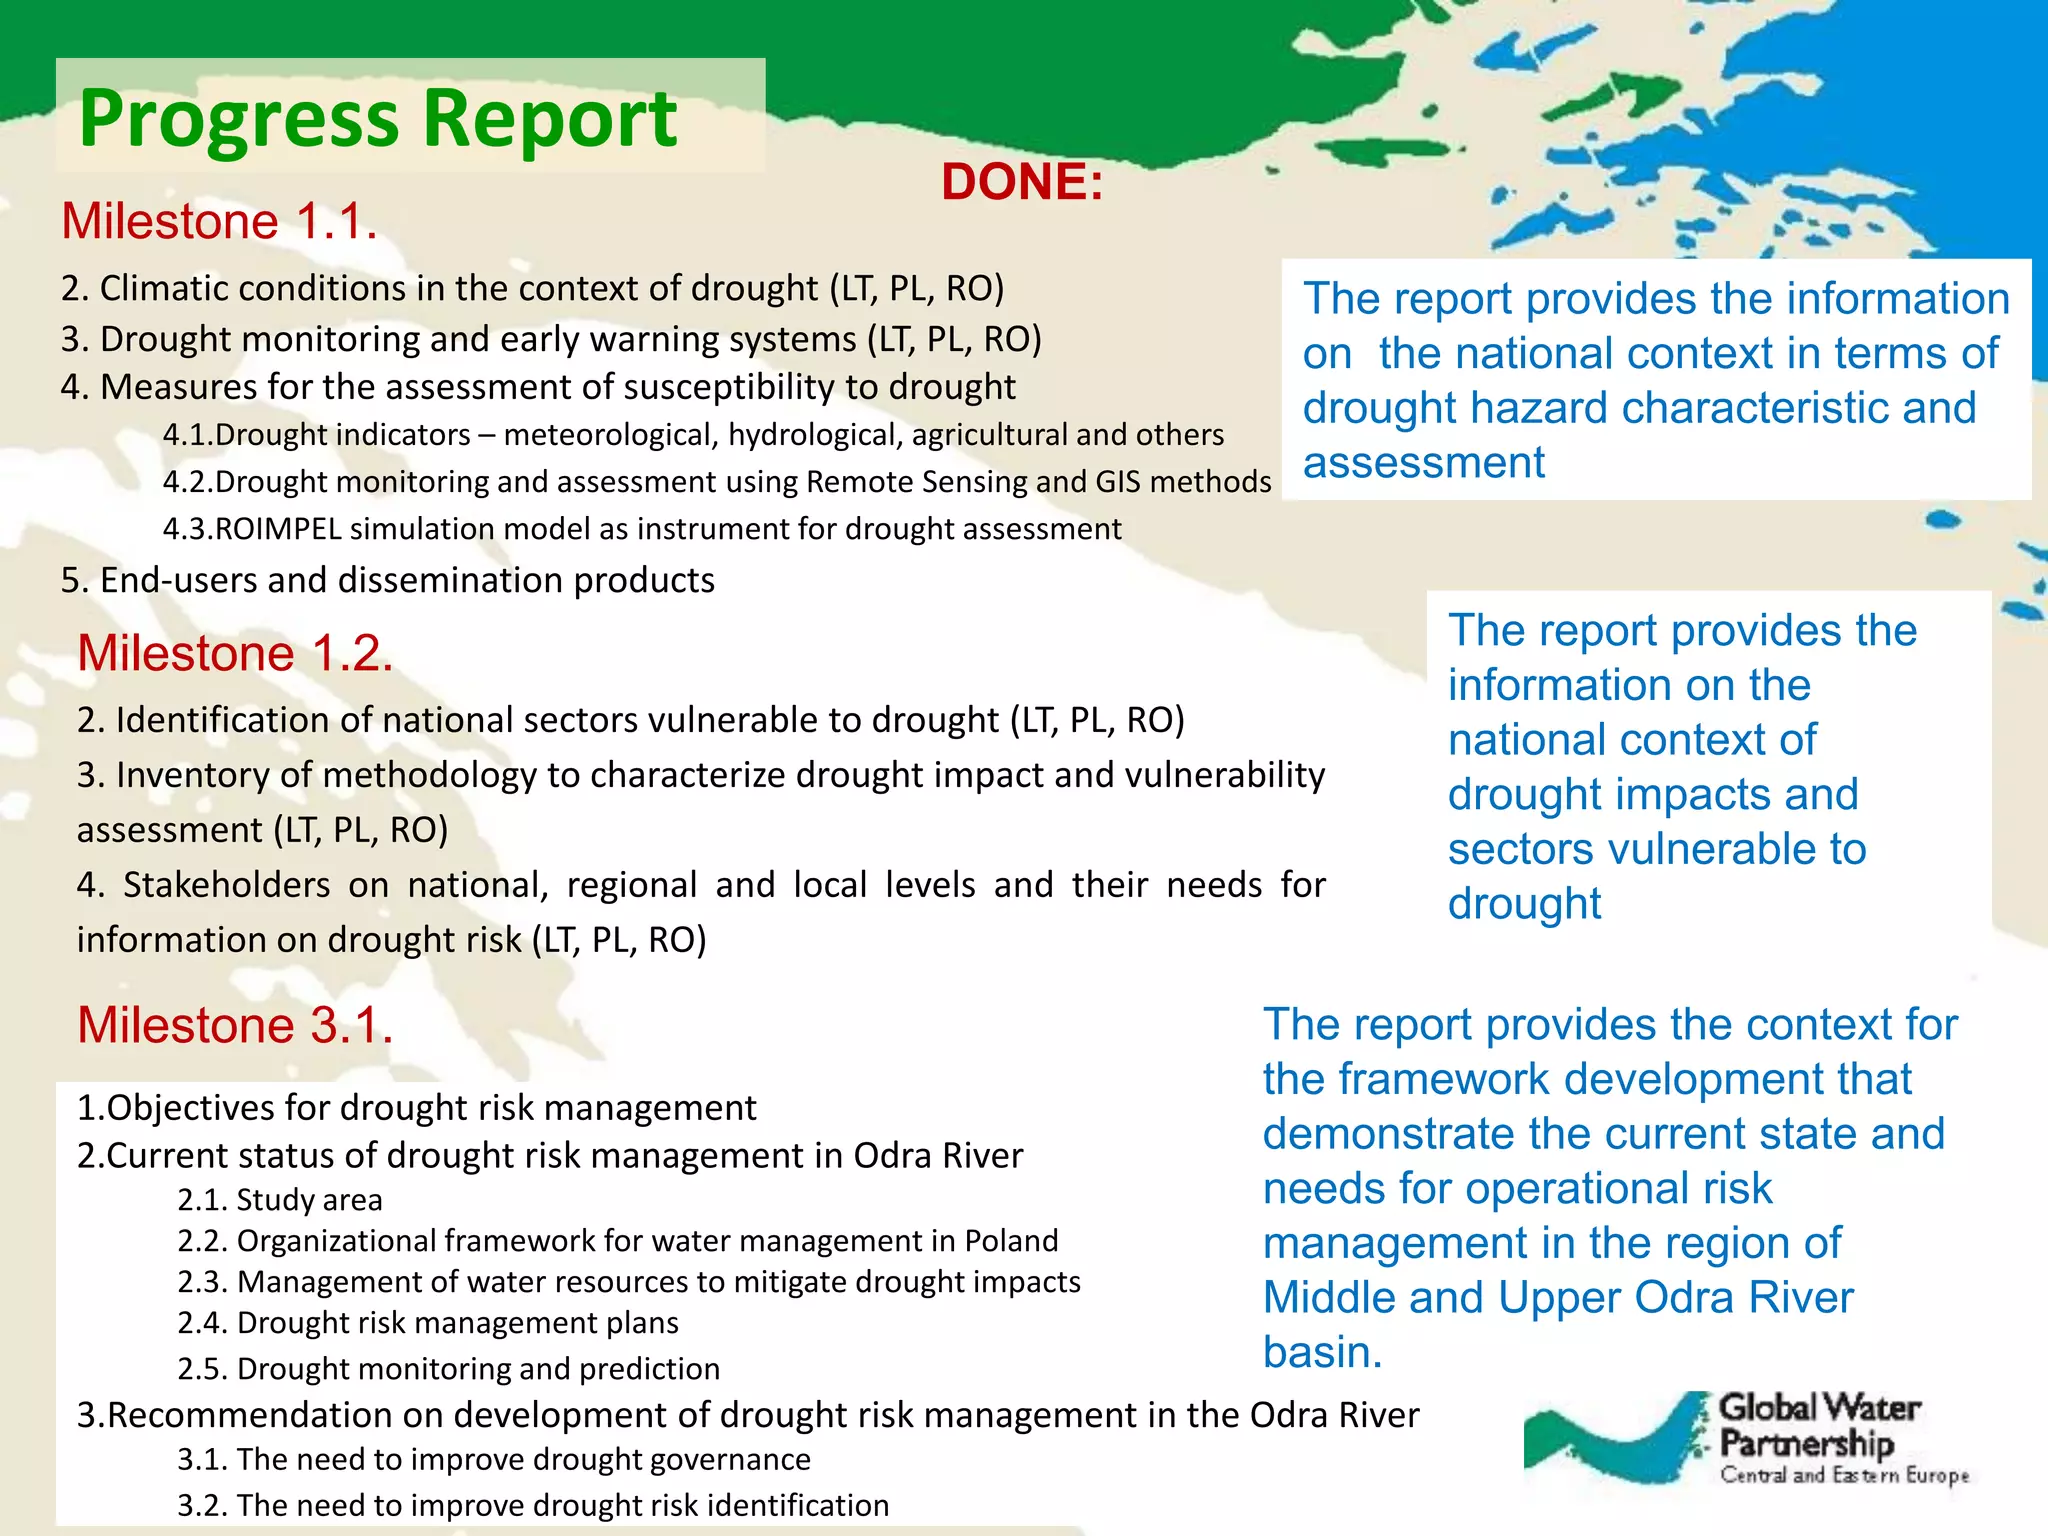
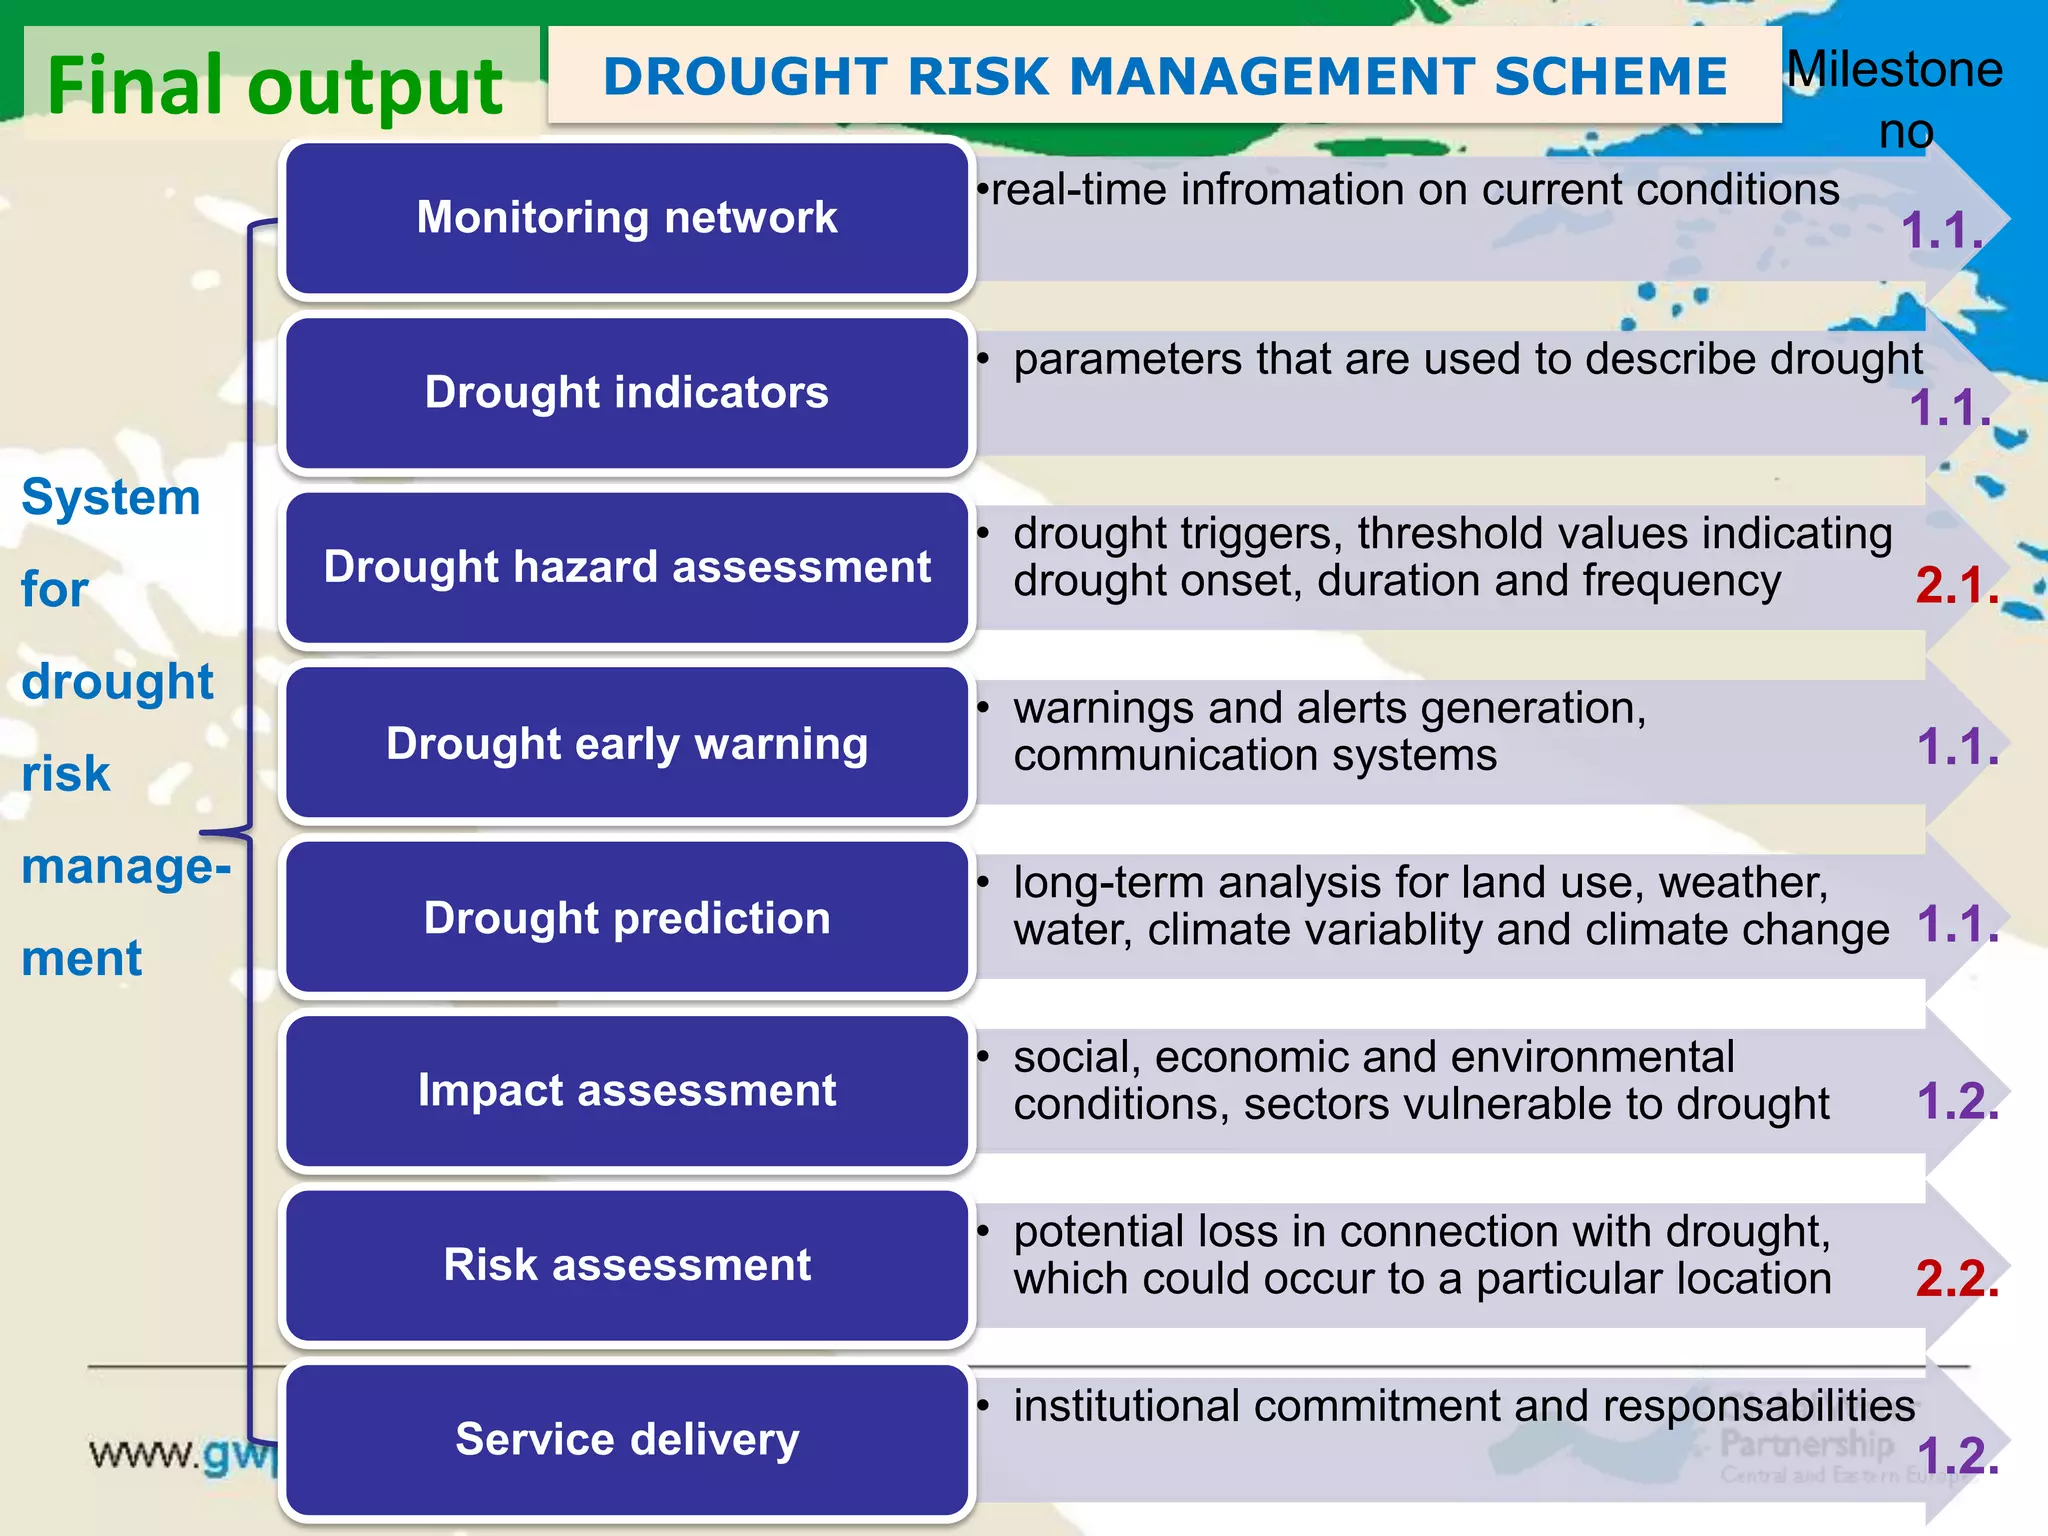
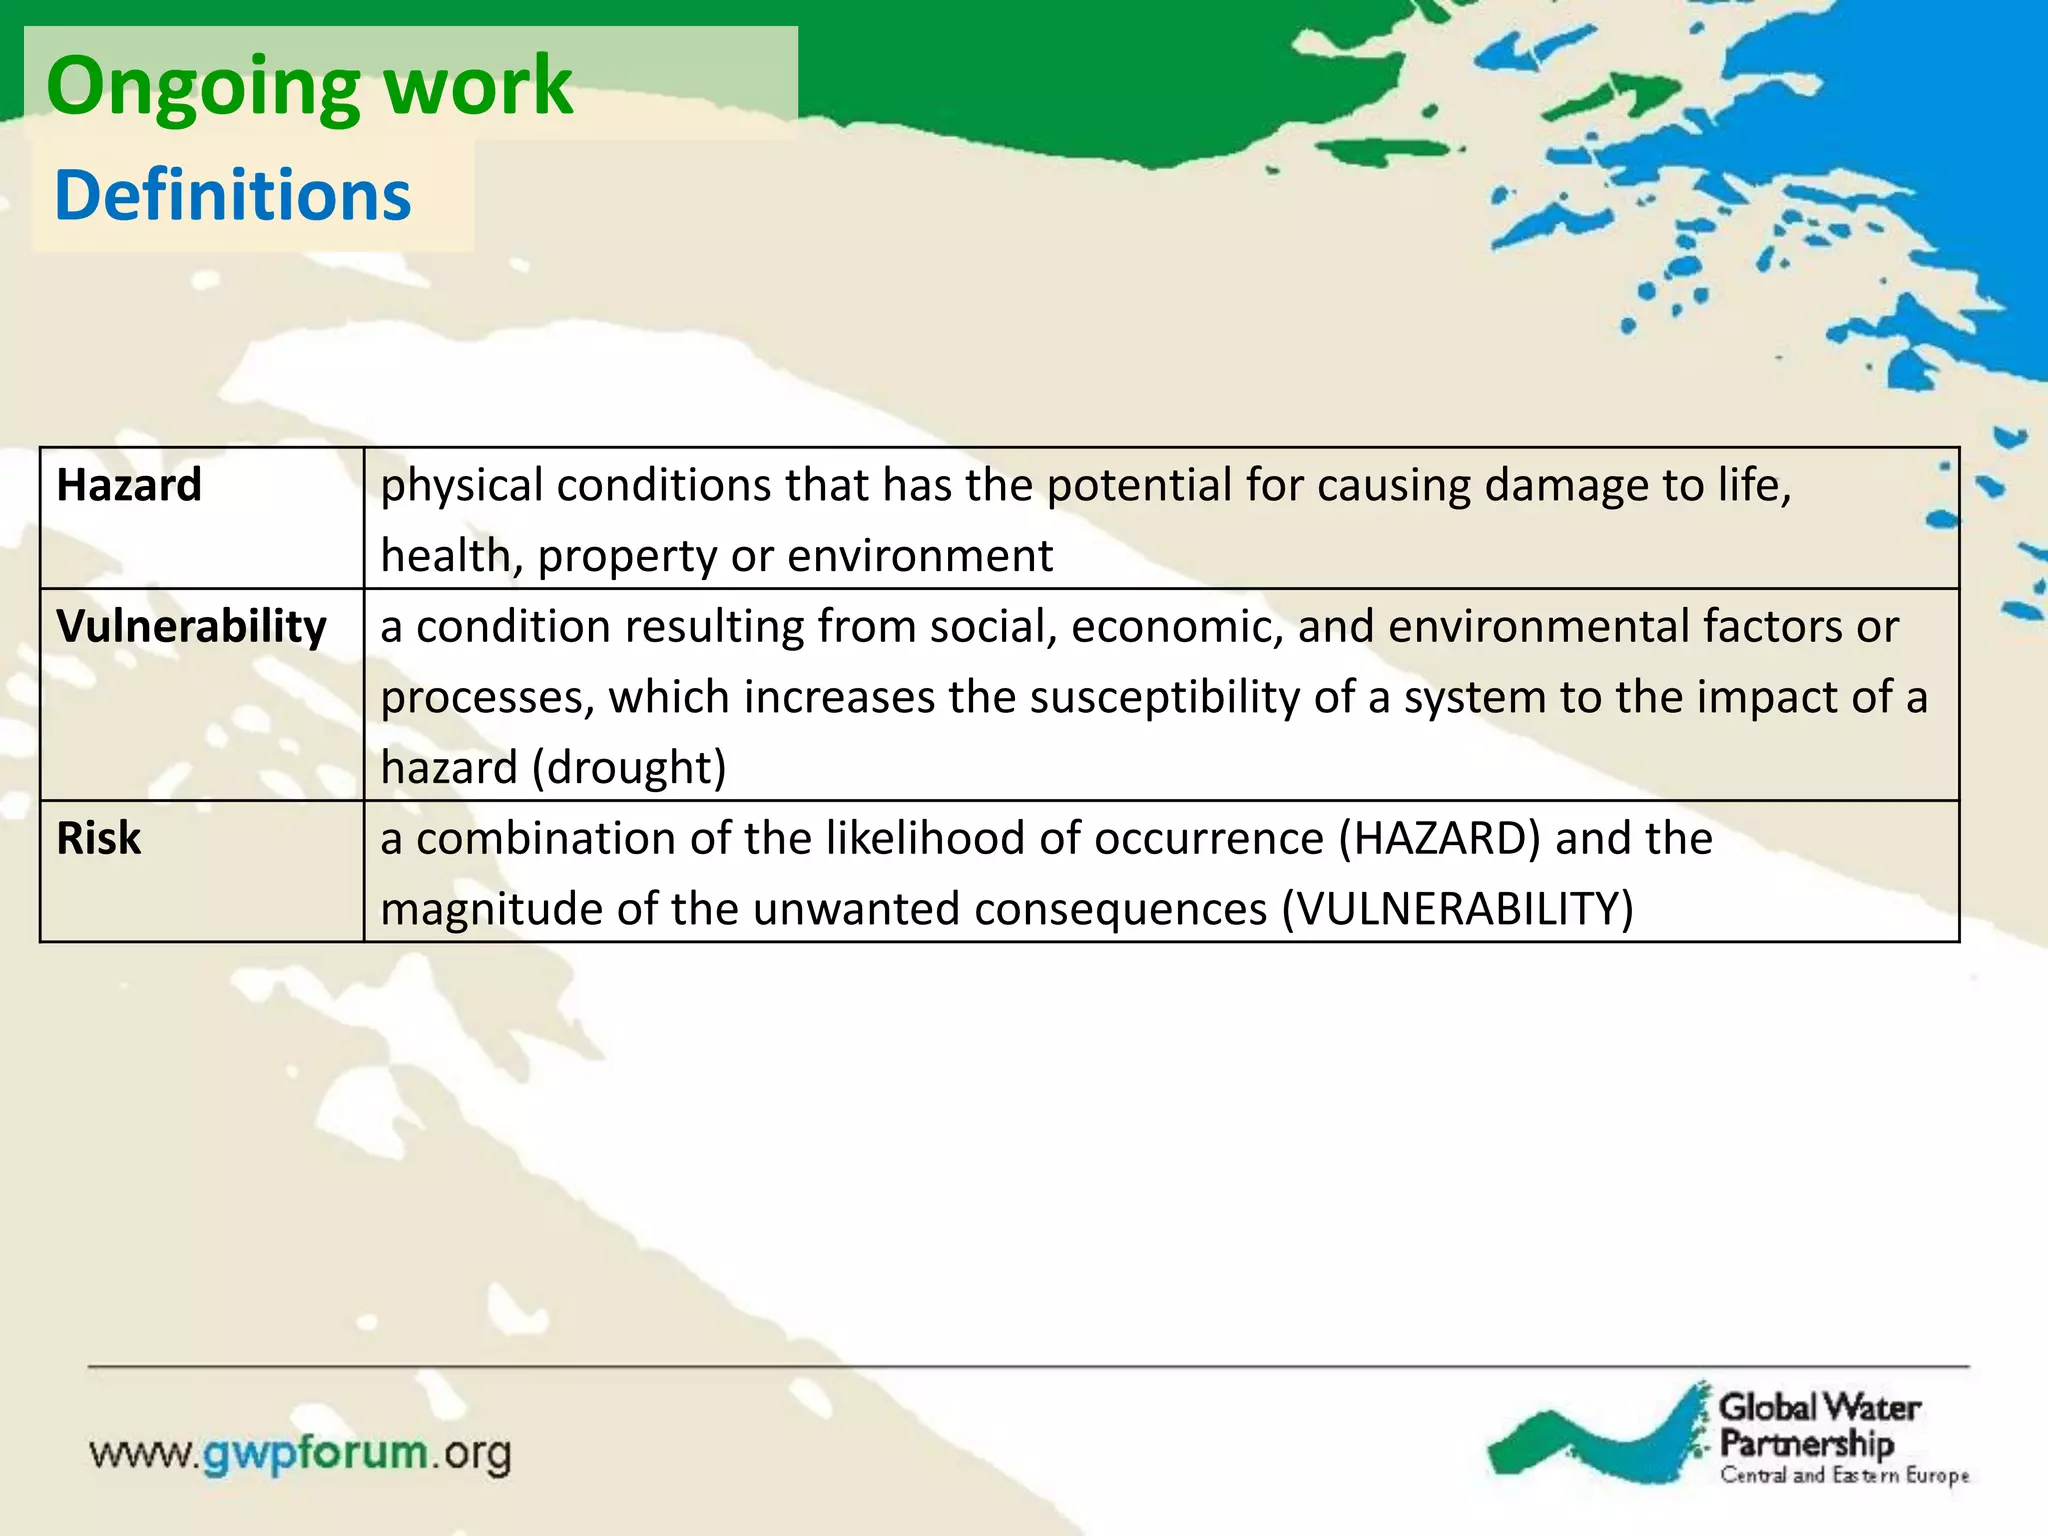
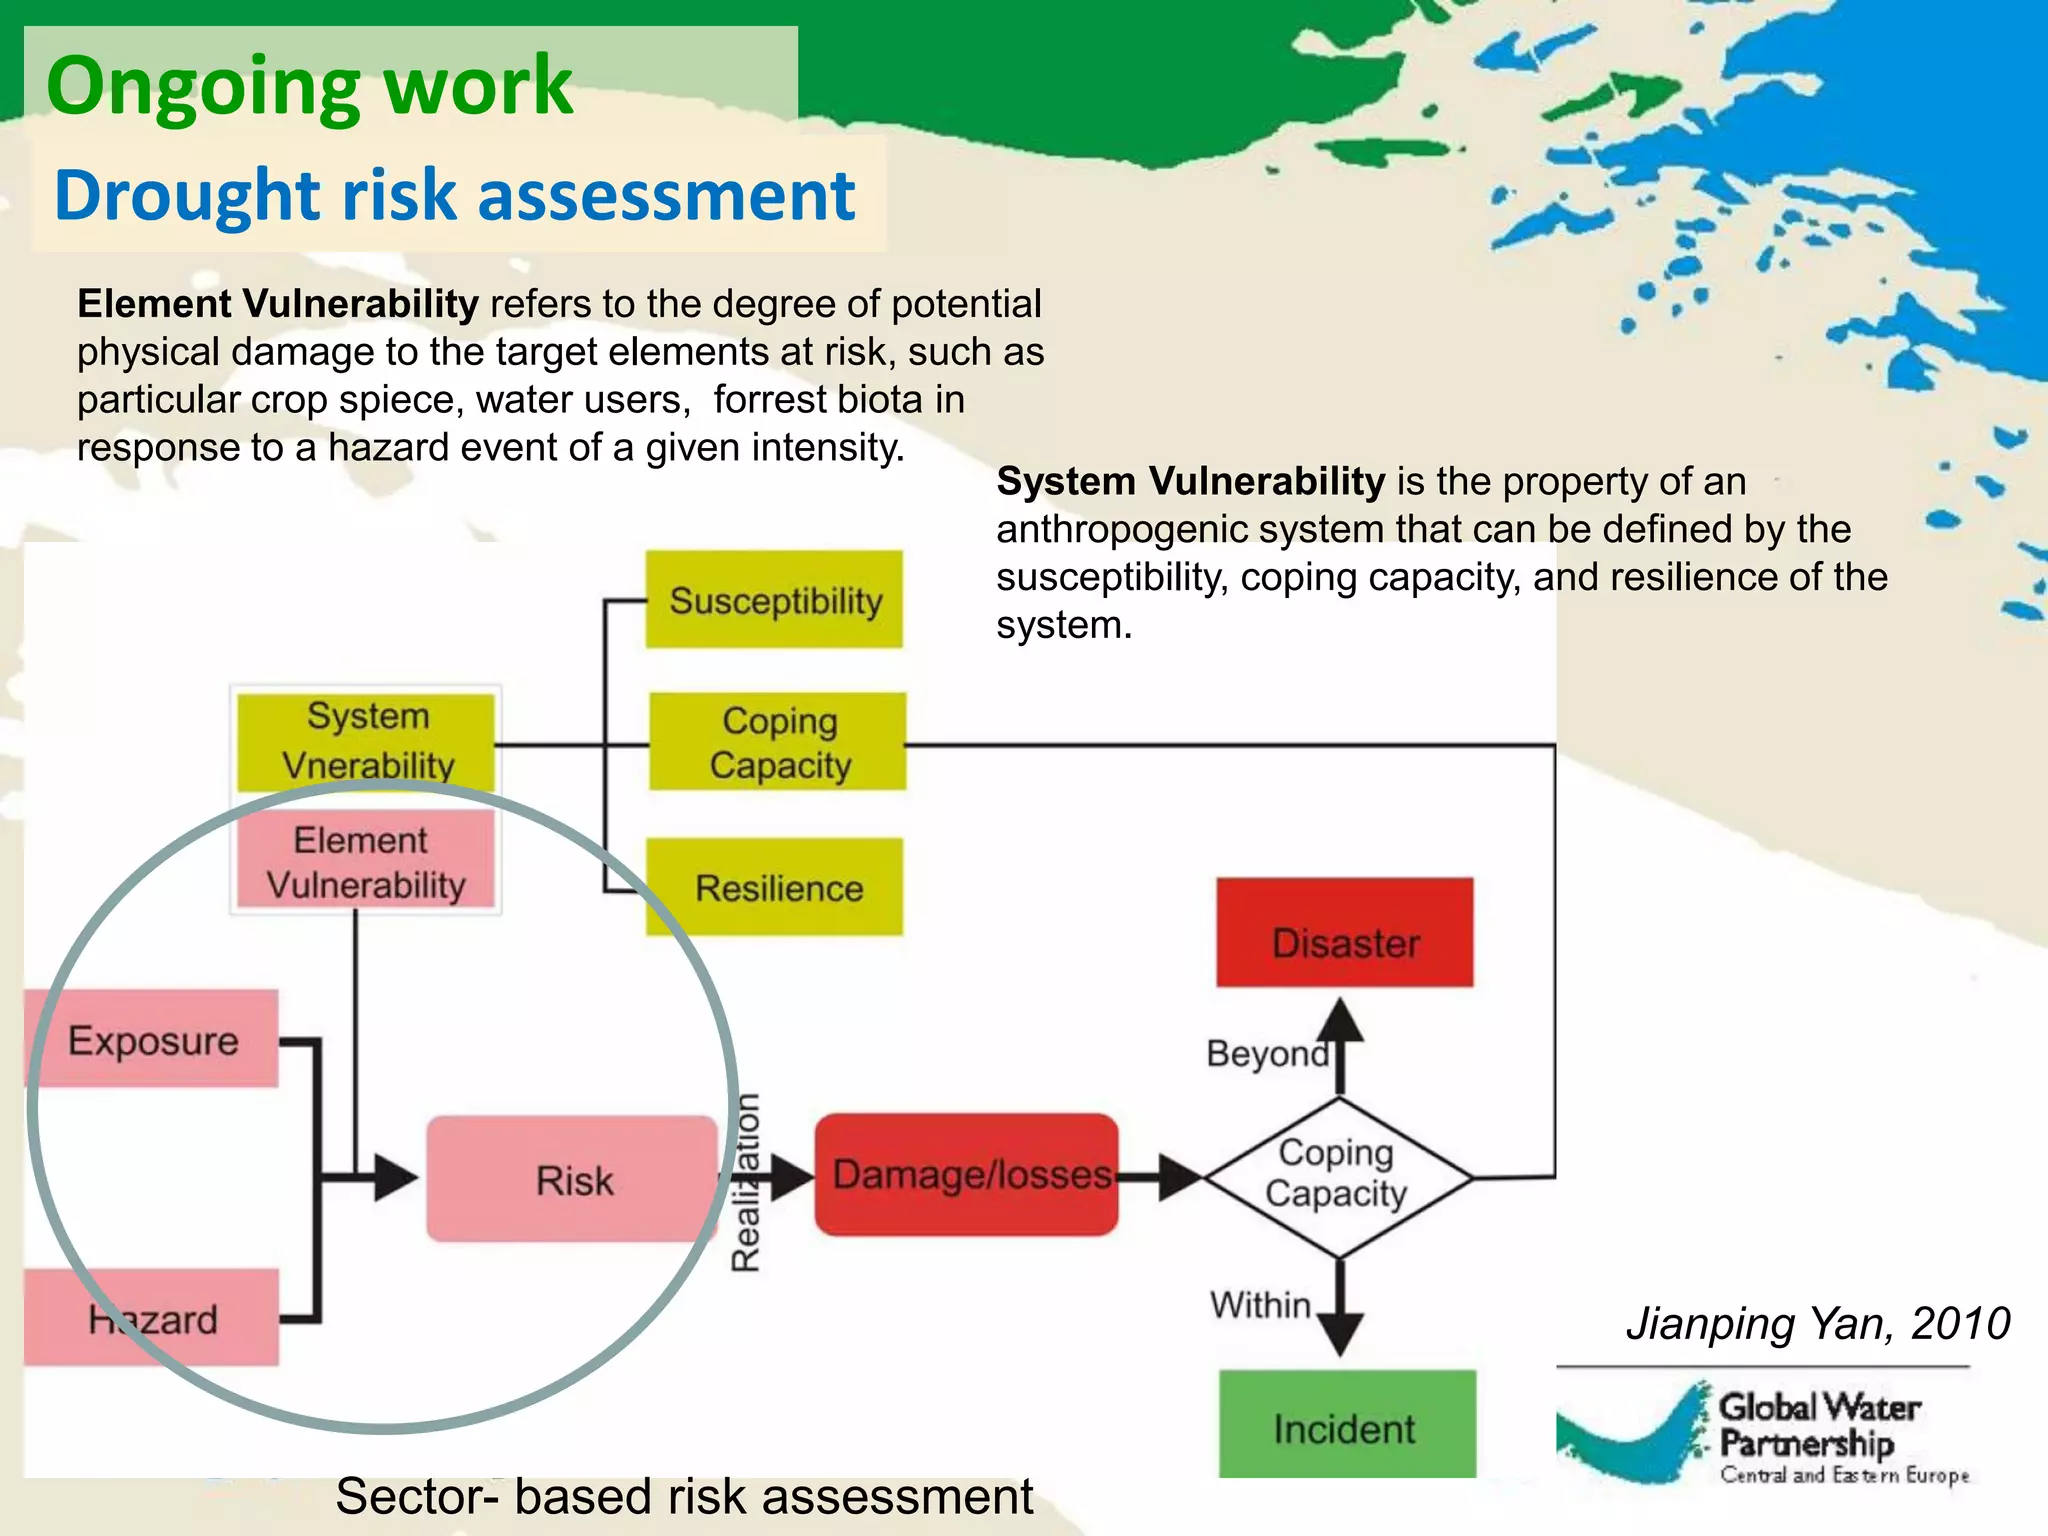
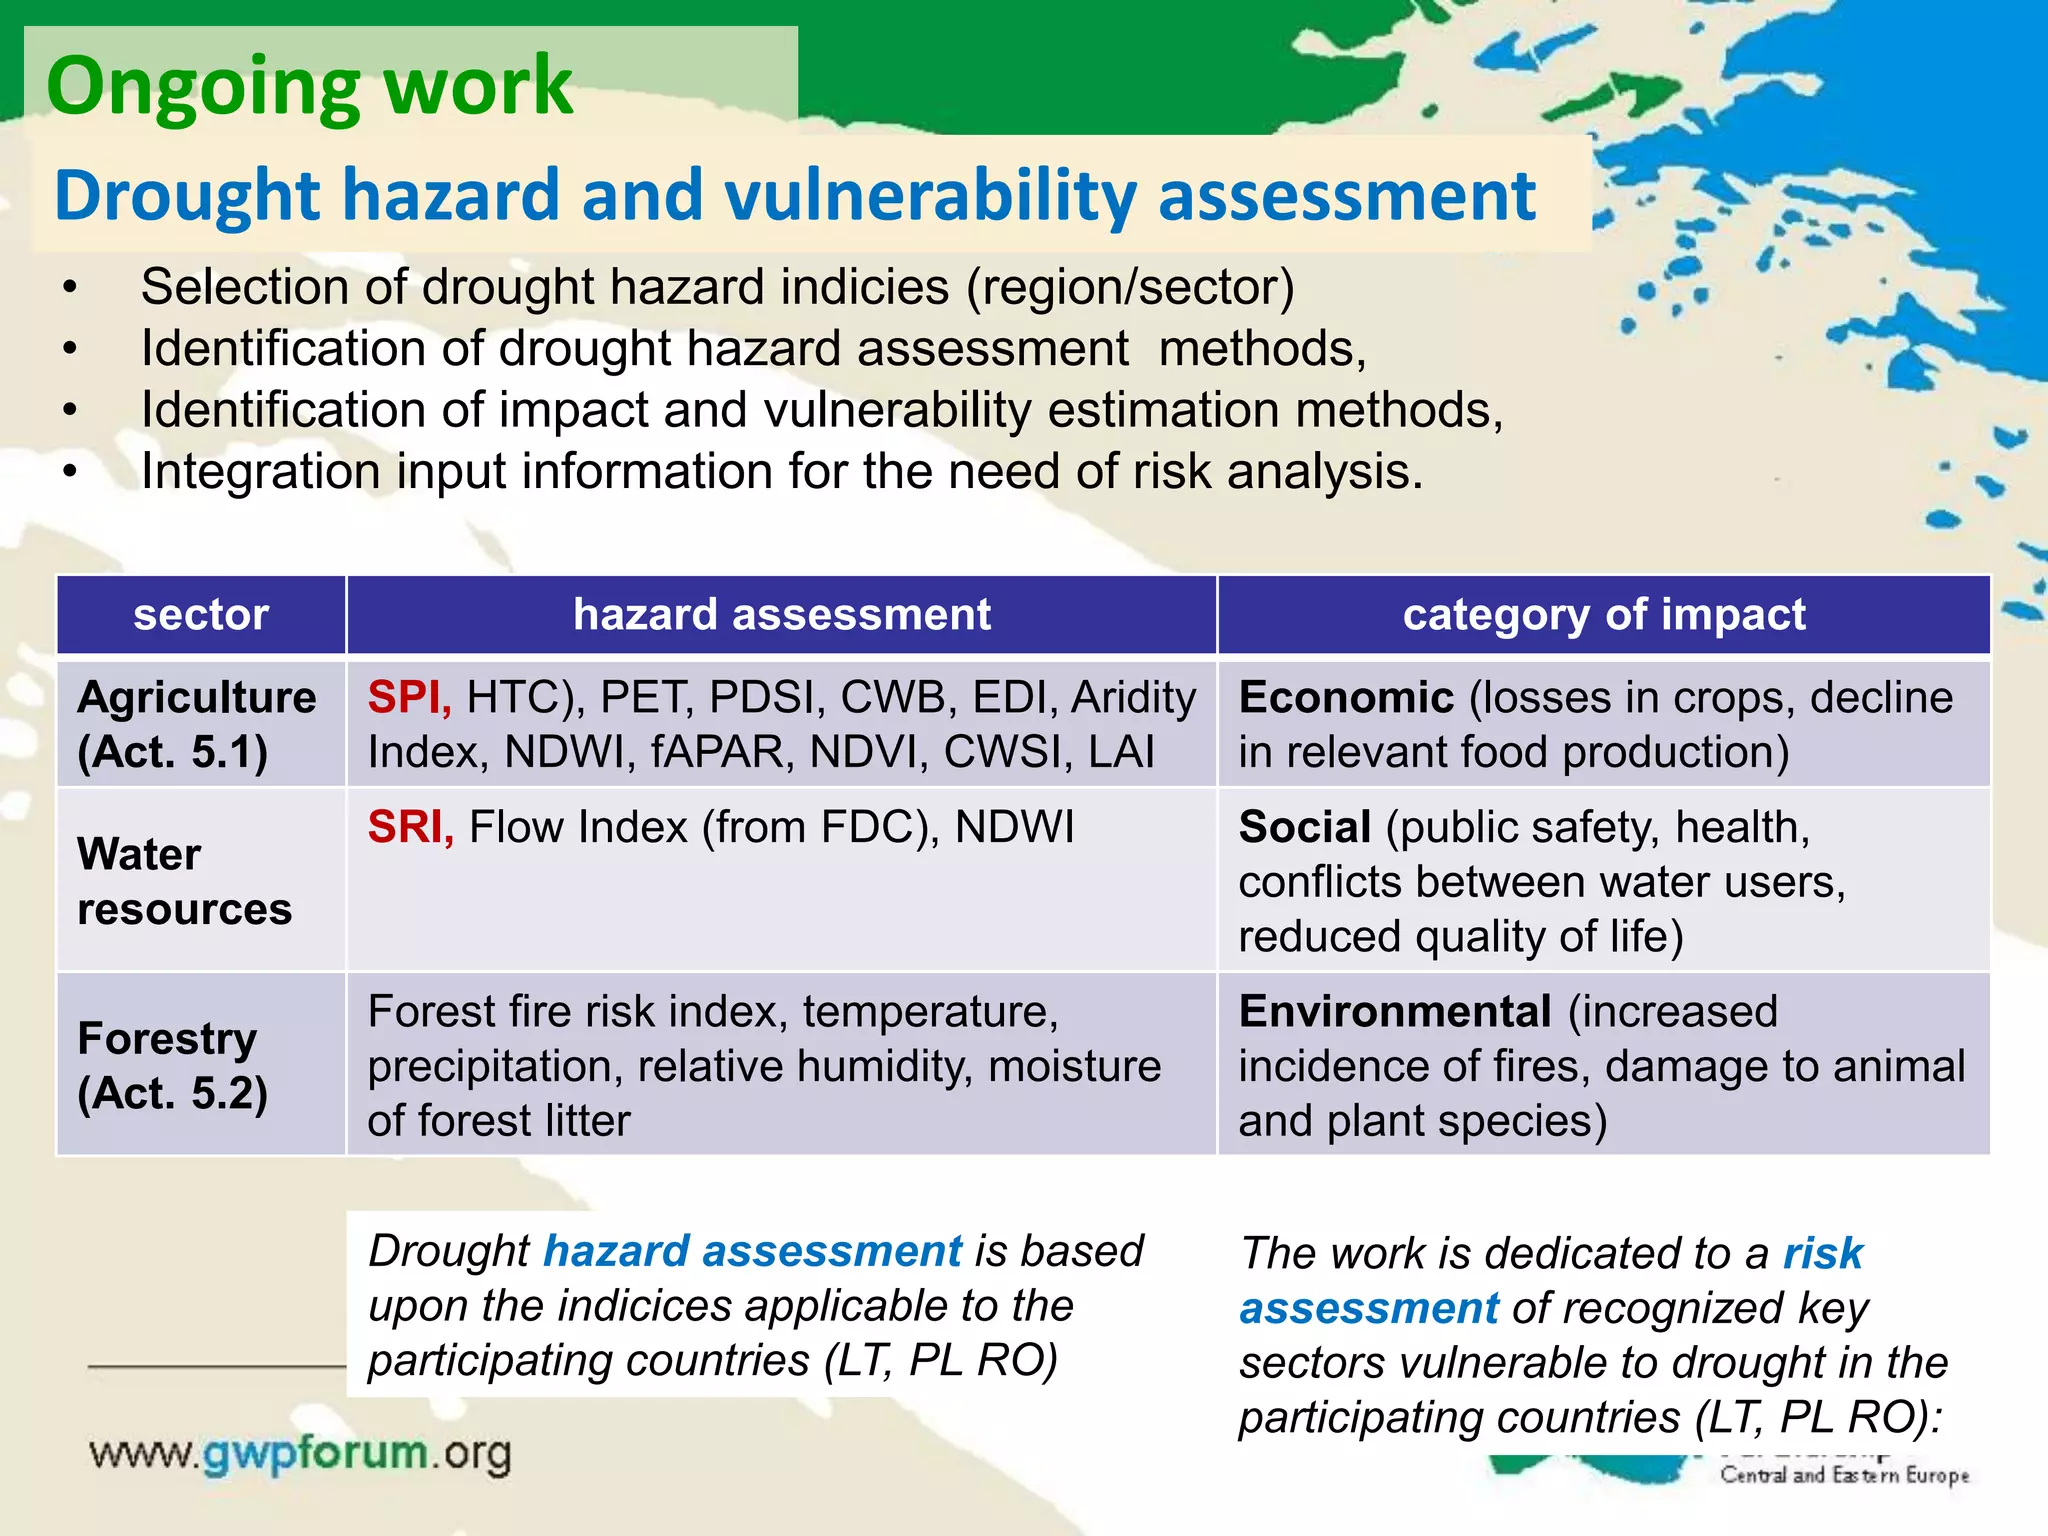
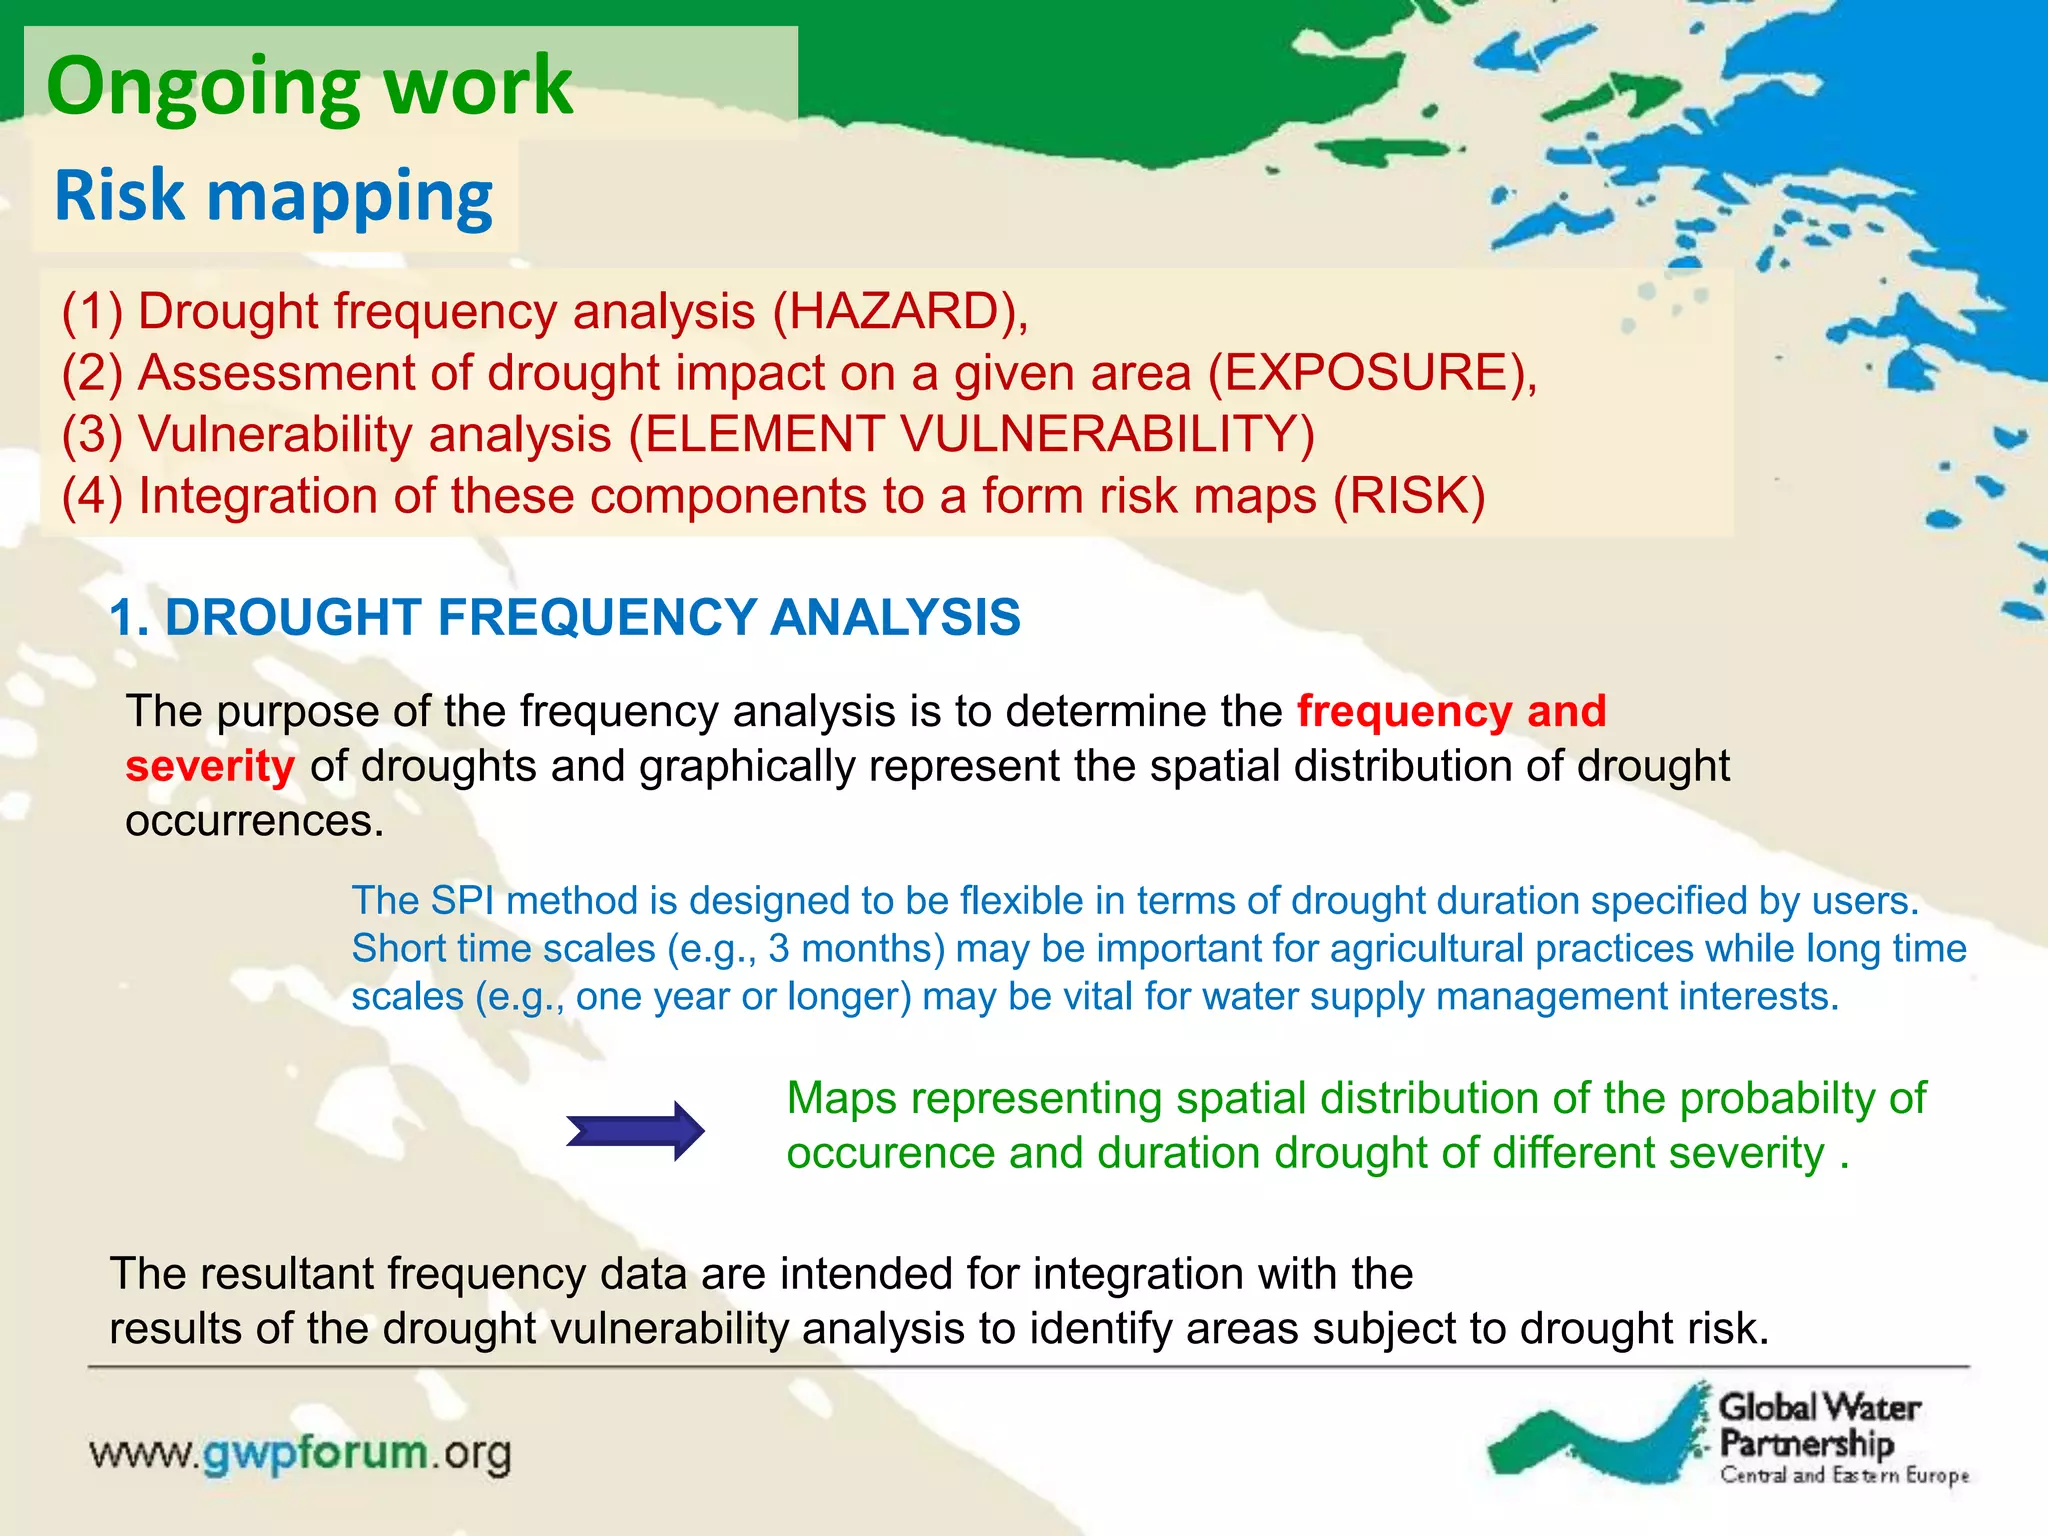
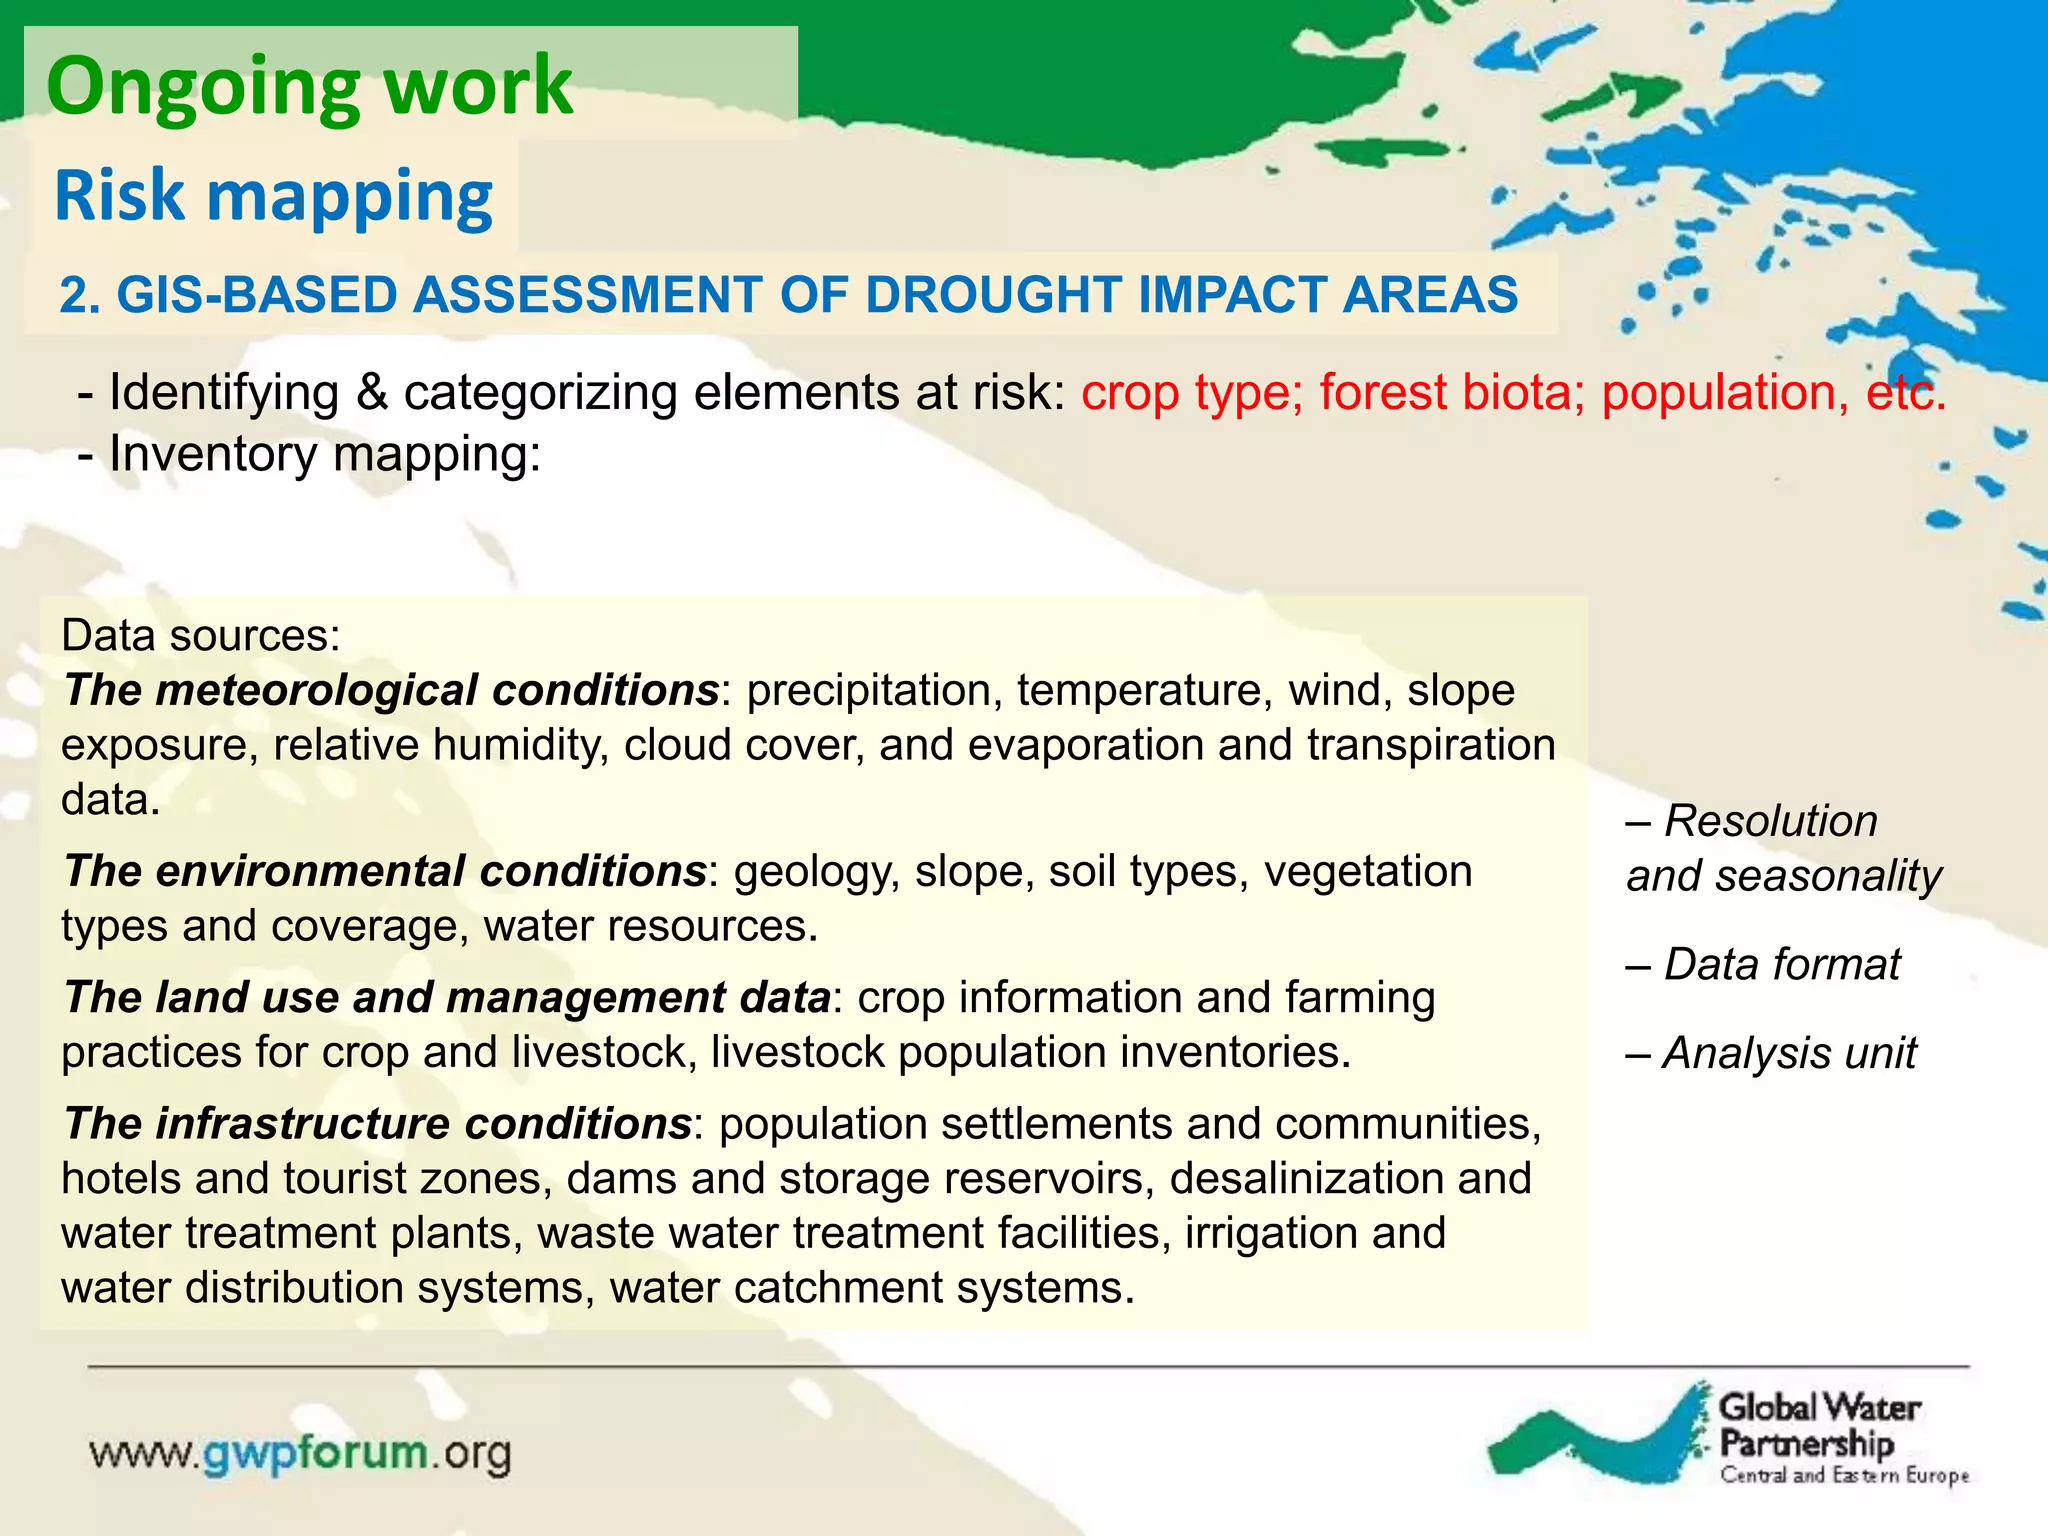
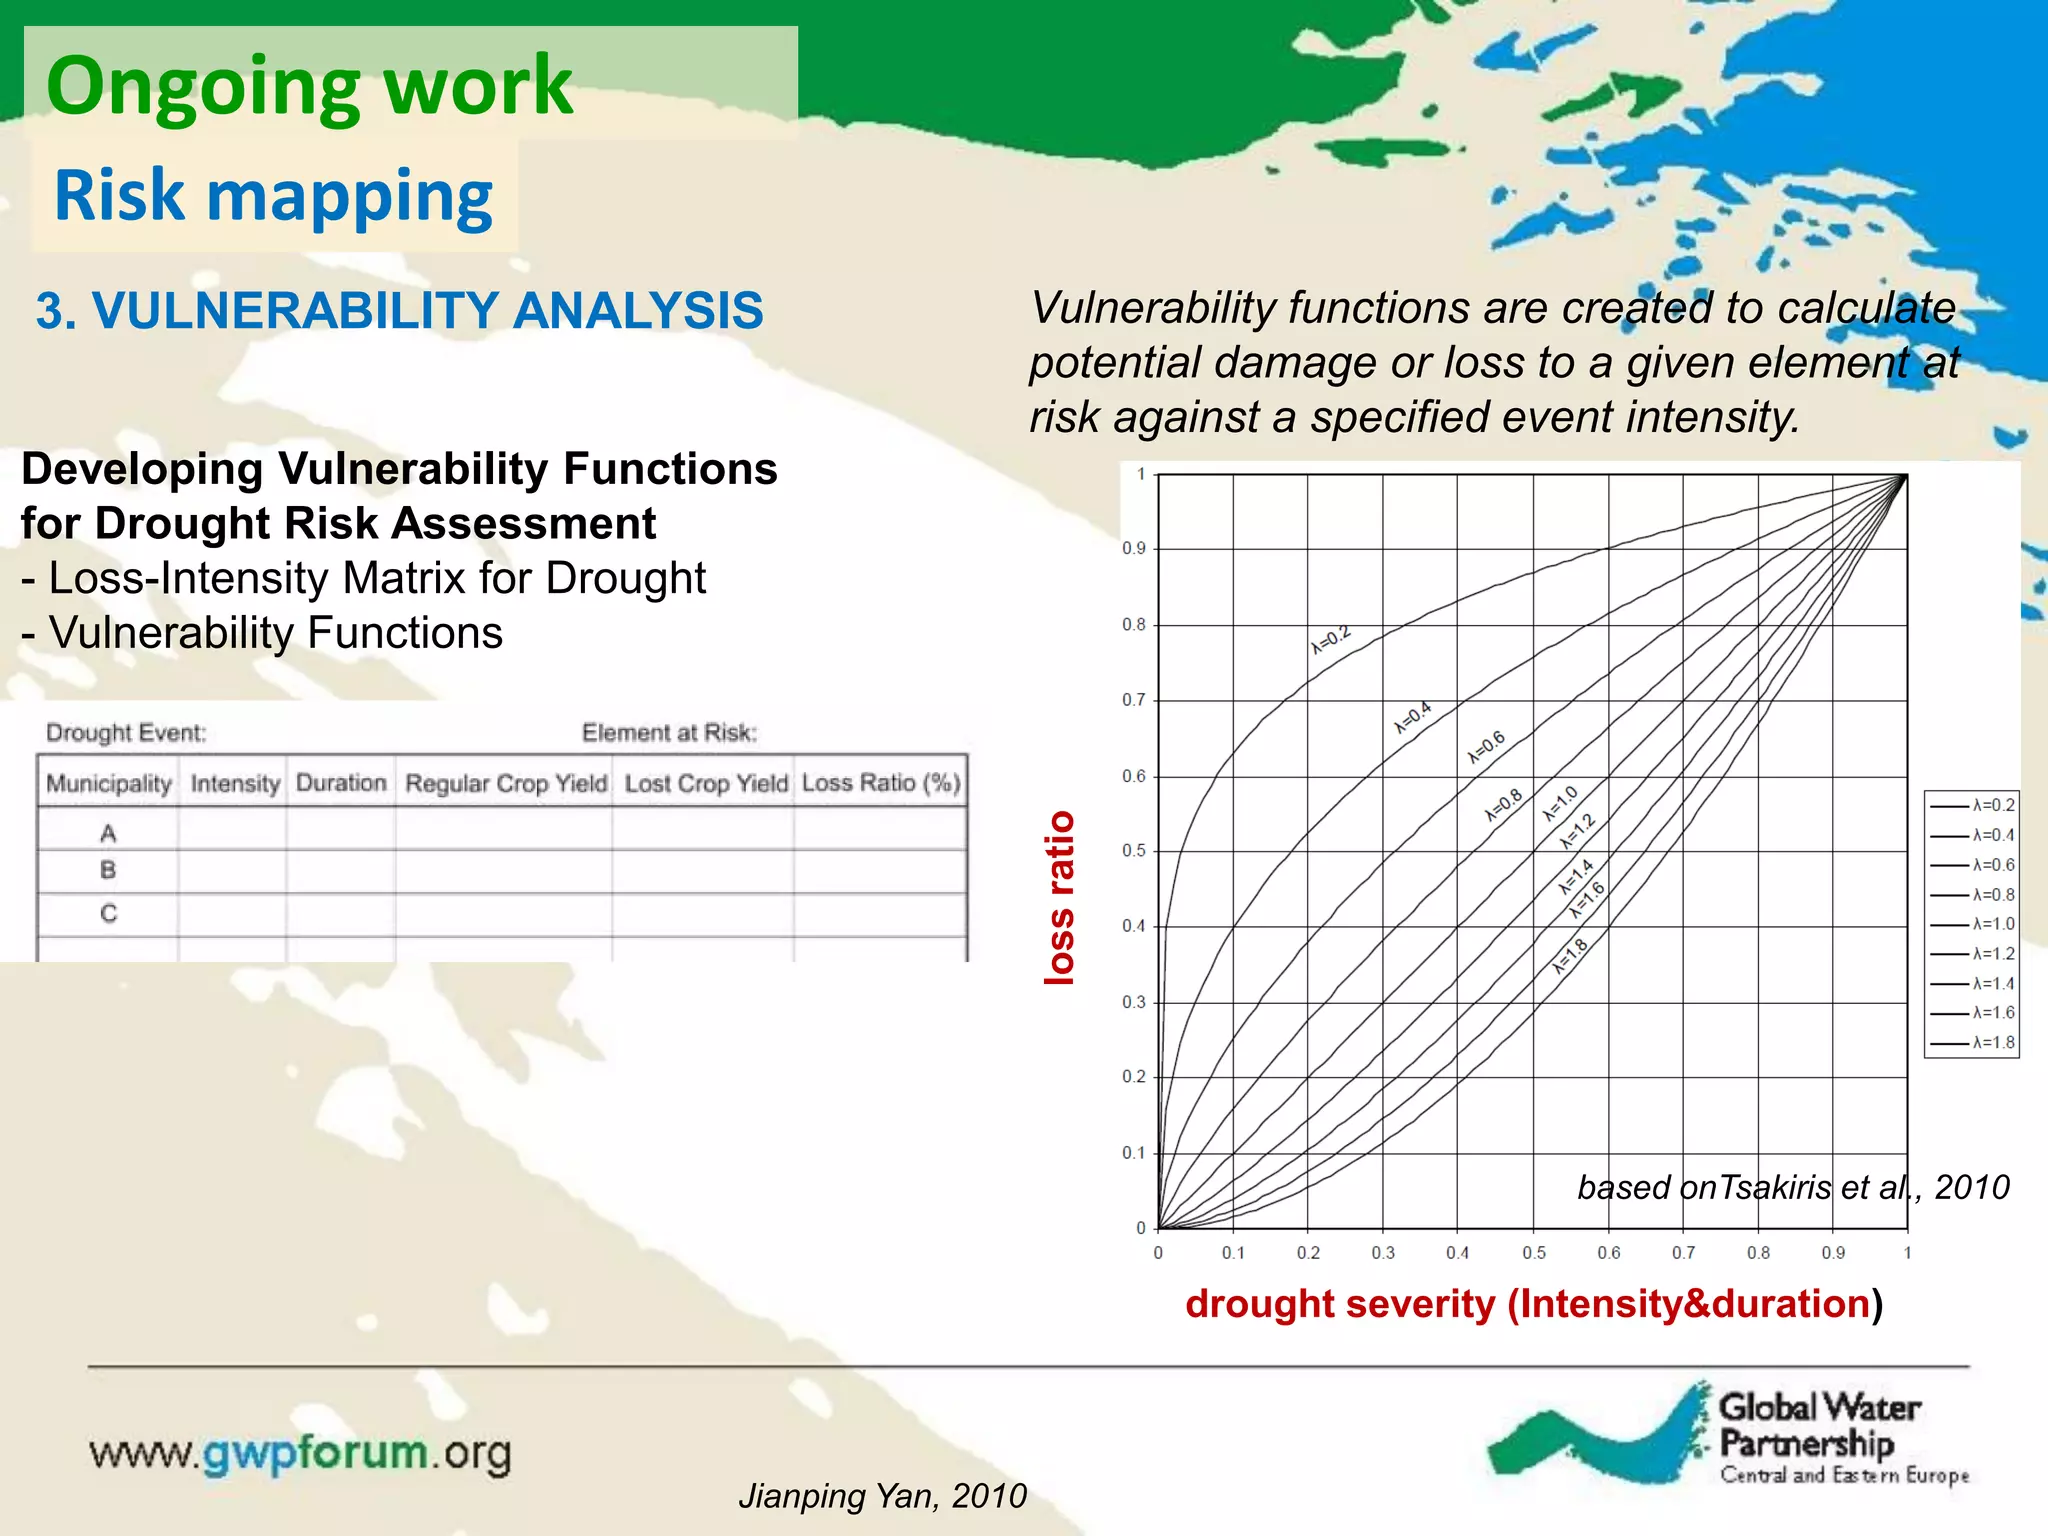
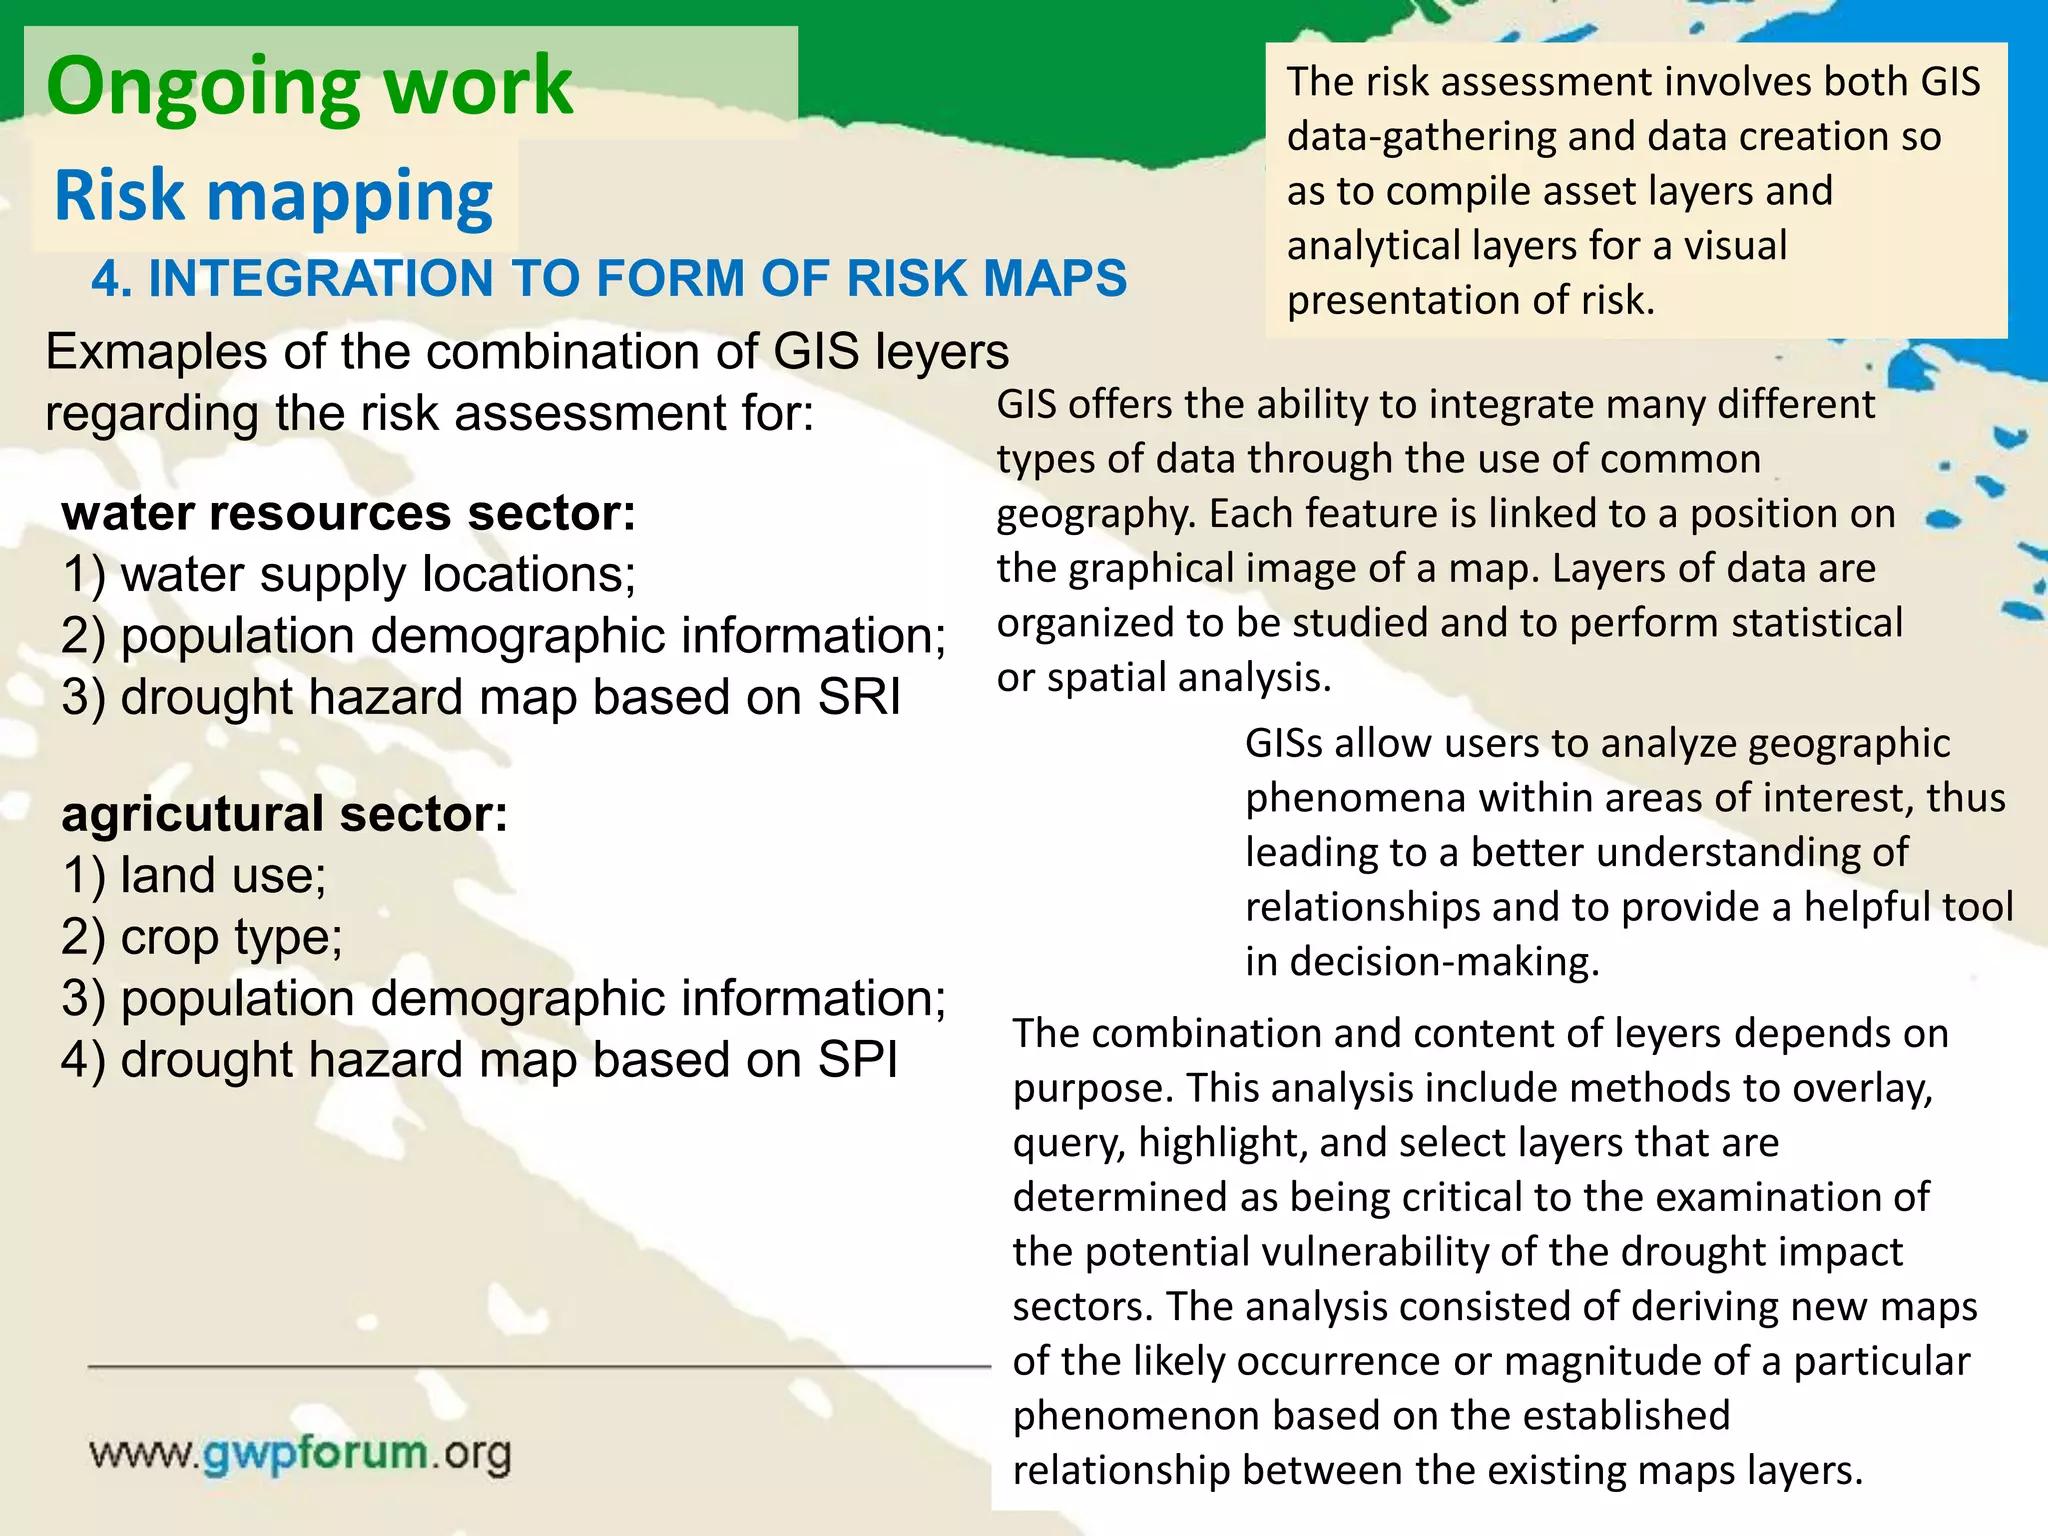
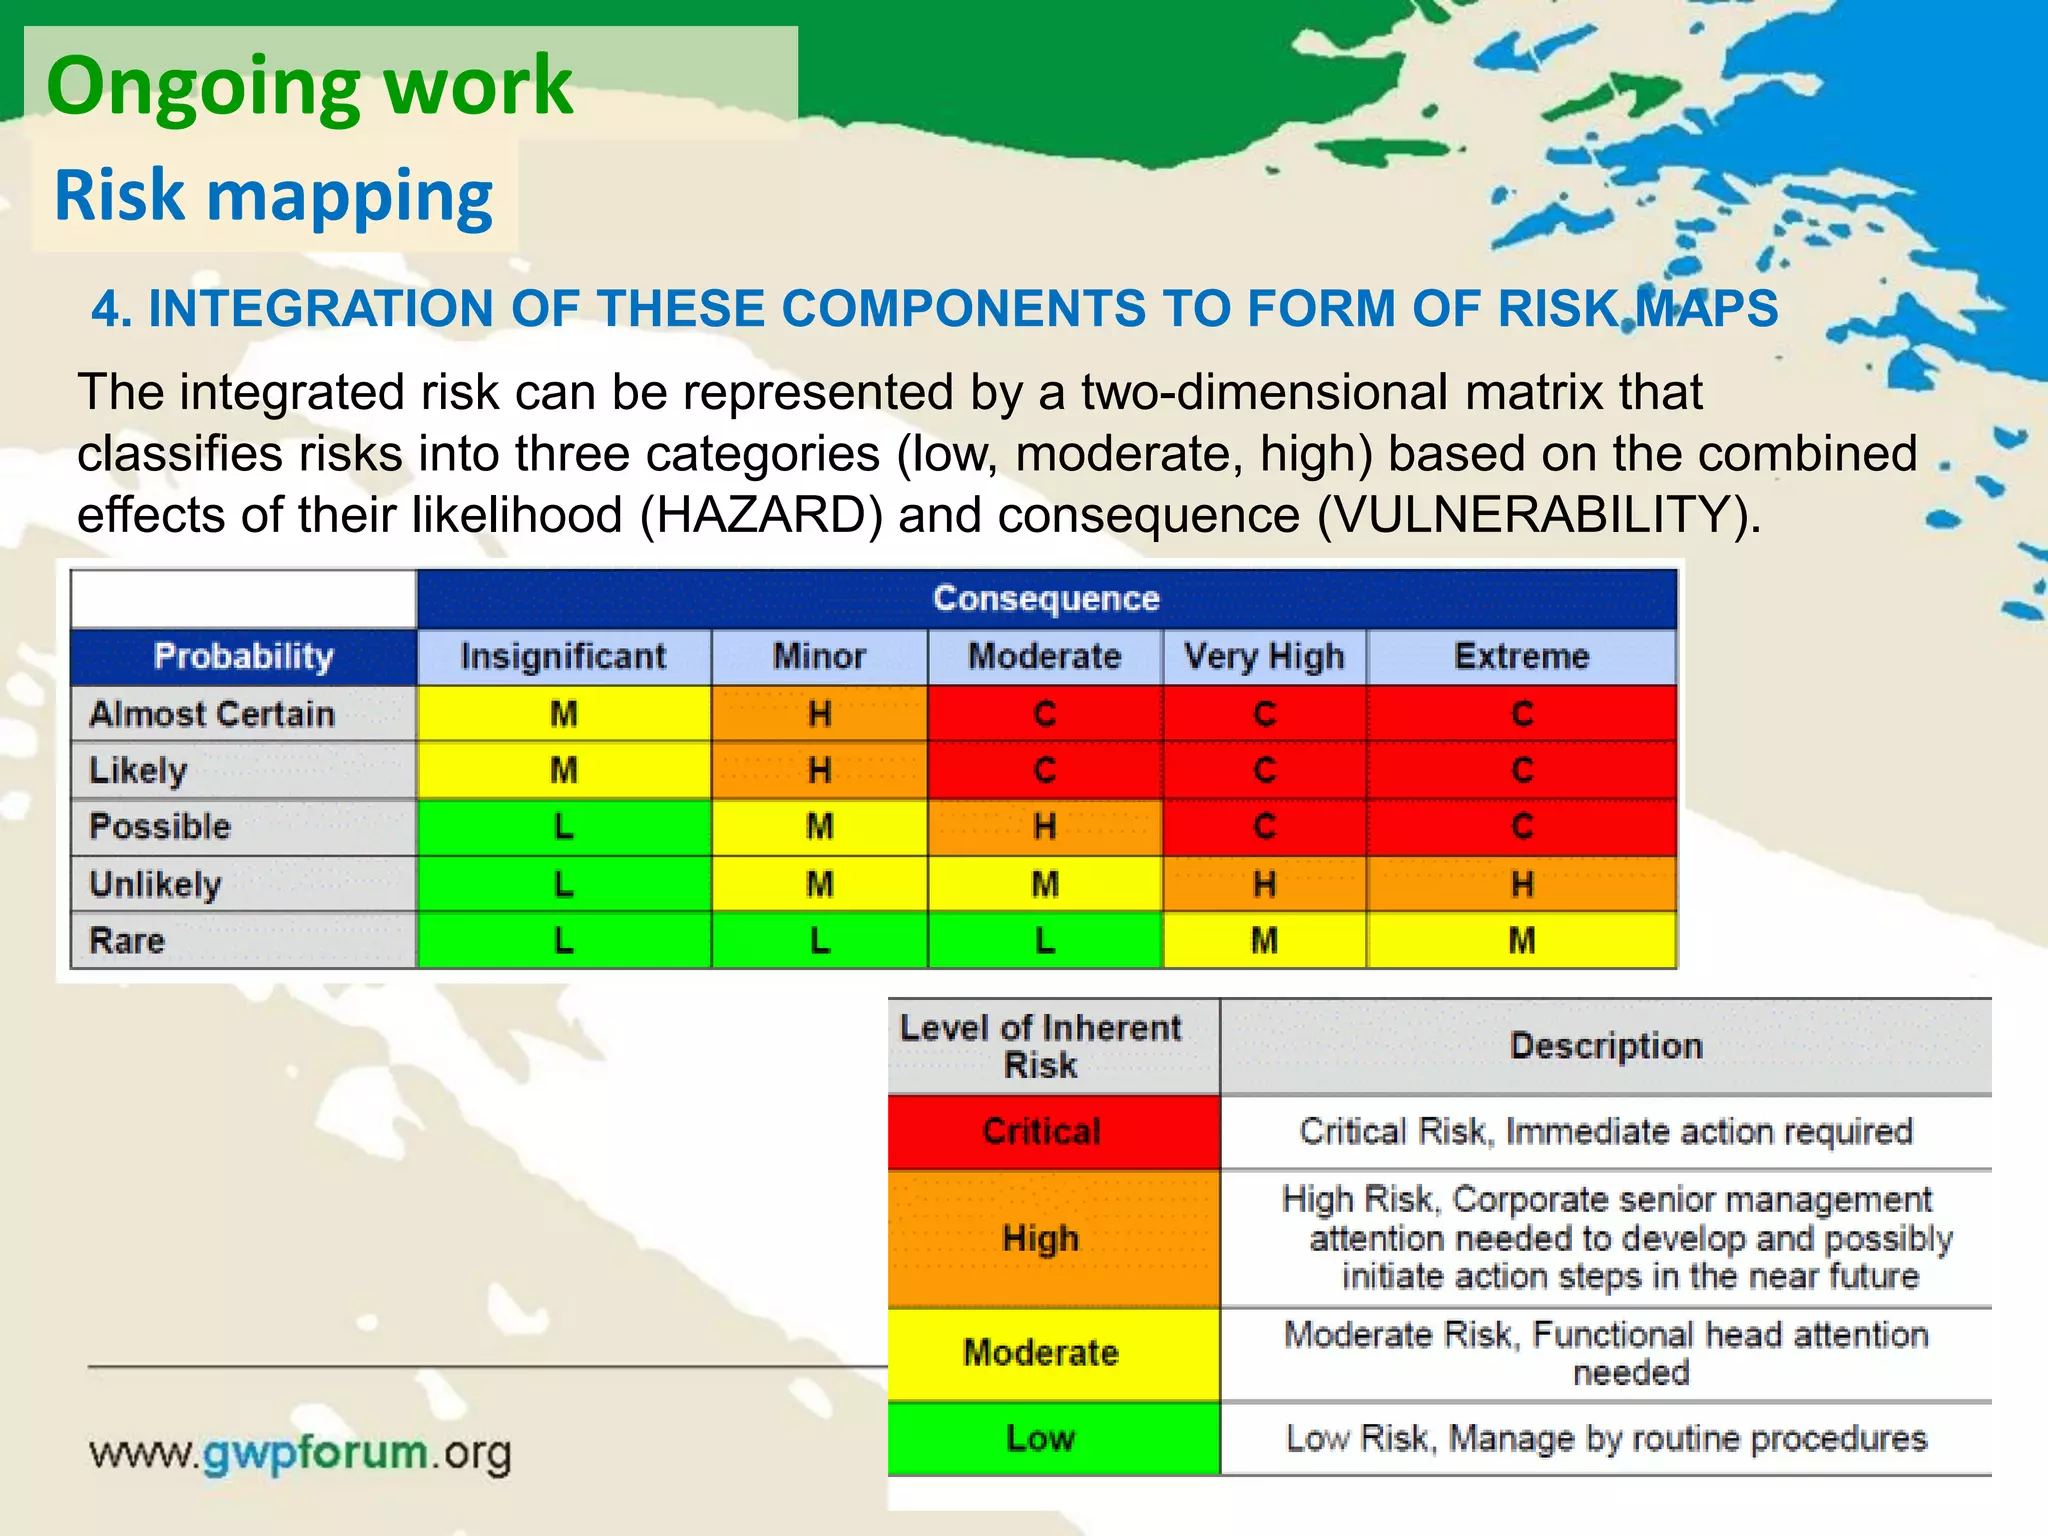
The document summarizes the ongoing work of developing an integrated framework for drought risk management in Poland, Lithuania, and Romania. The framework includes components for drought hazard assessment, vulnerability analysis, risk visualization and mapping. It will provide a systematic approach and generic concepts that can be detailed and adjusted for specific regional contexts. The ongoing work involves identifying national measures for drought assessment, developing methods for hazard and vulnerability mapping, conducting sector-based risk assessments, and integrating the components to form drought risk maps. The goal is to provide recommendations for an operational decision support system to improve drought governance and risk identification in the region of the Middle and Upper Odra River basin.