Download as PDF, PPTX

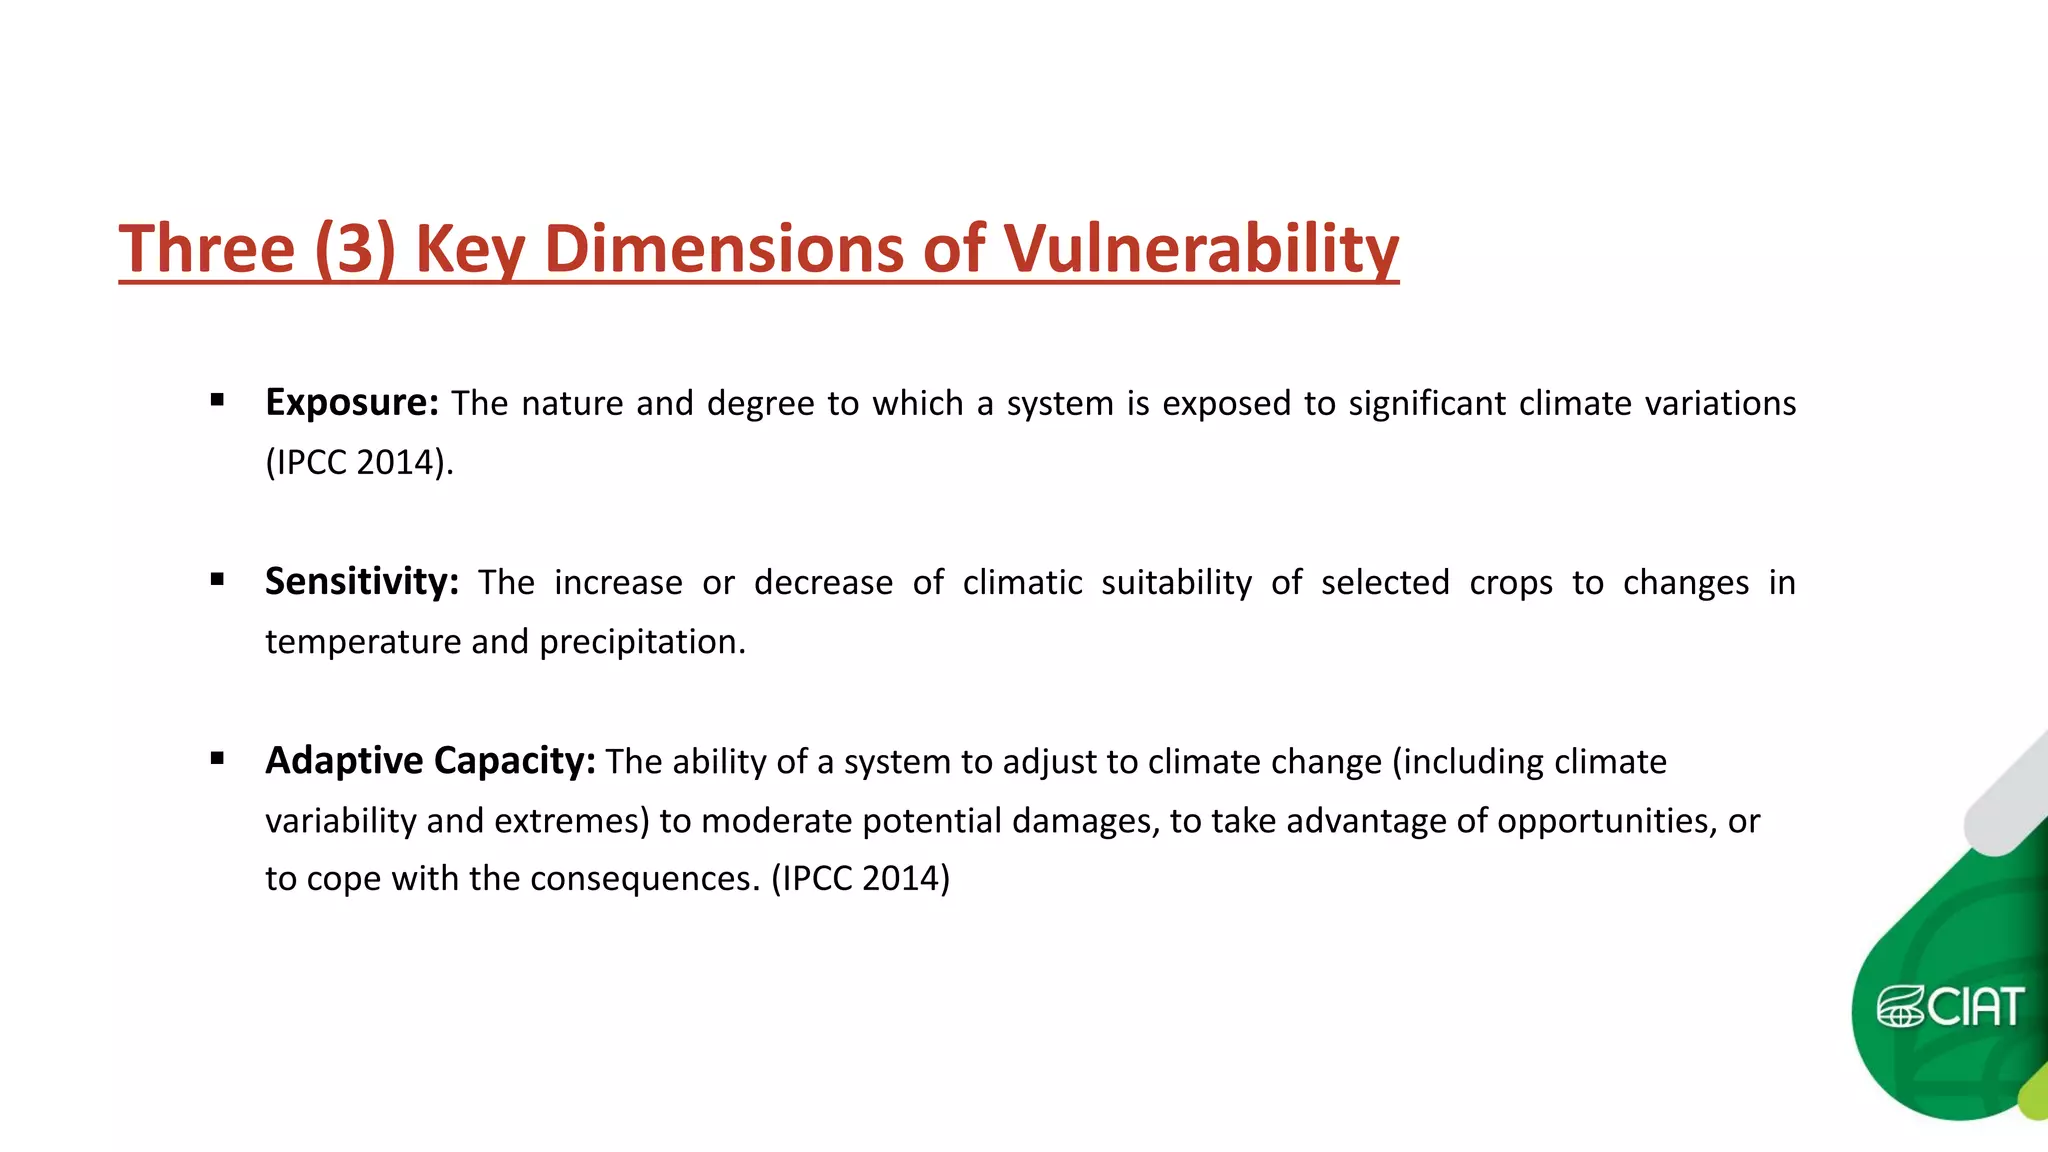

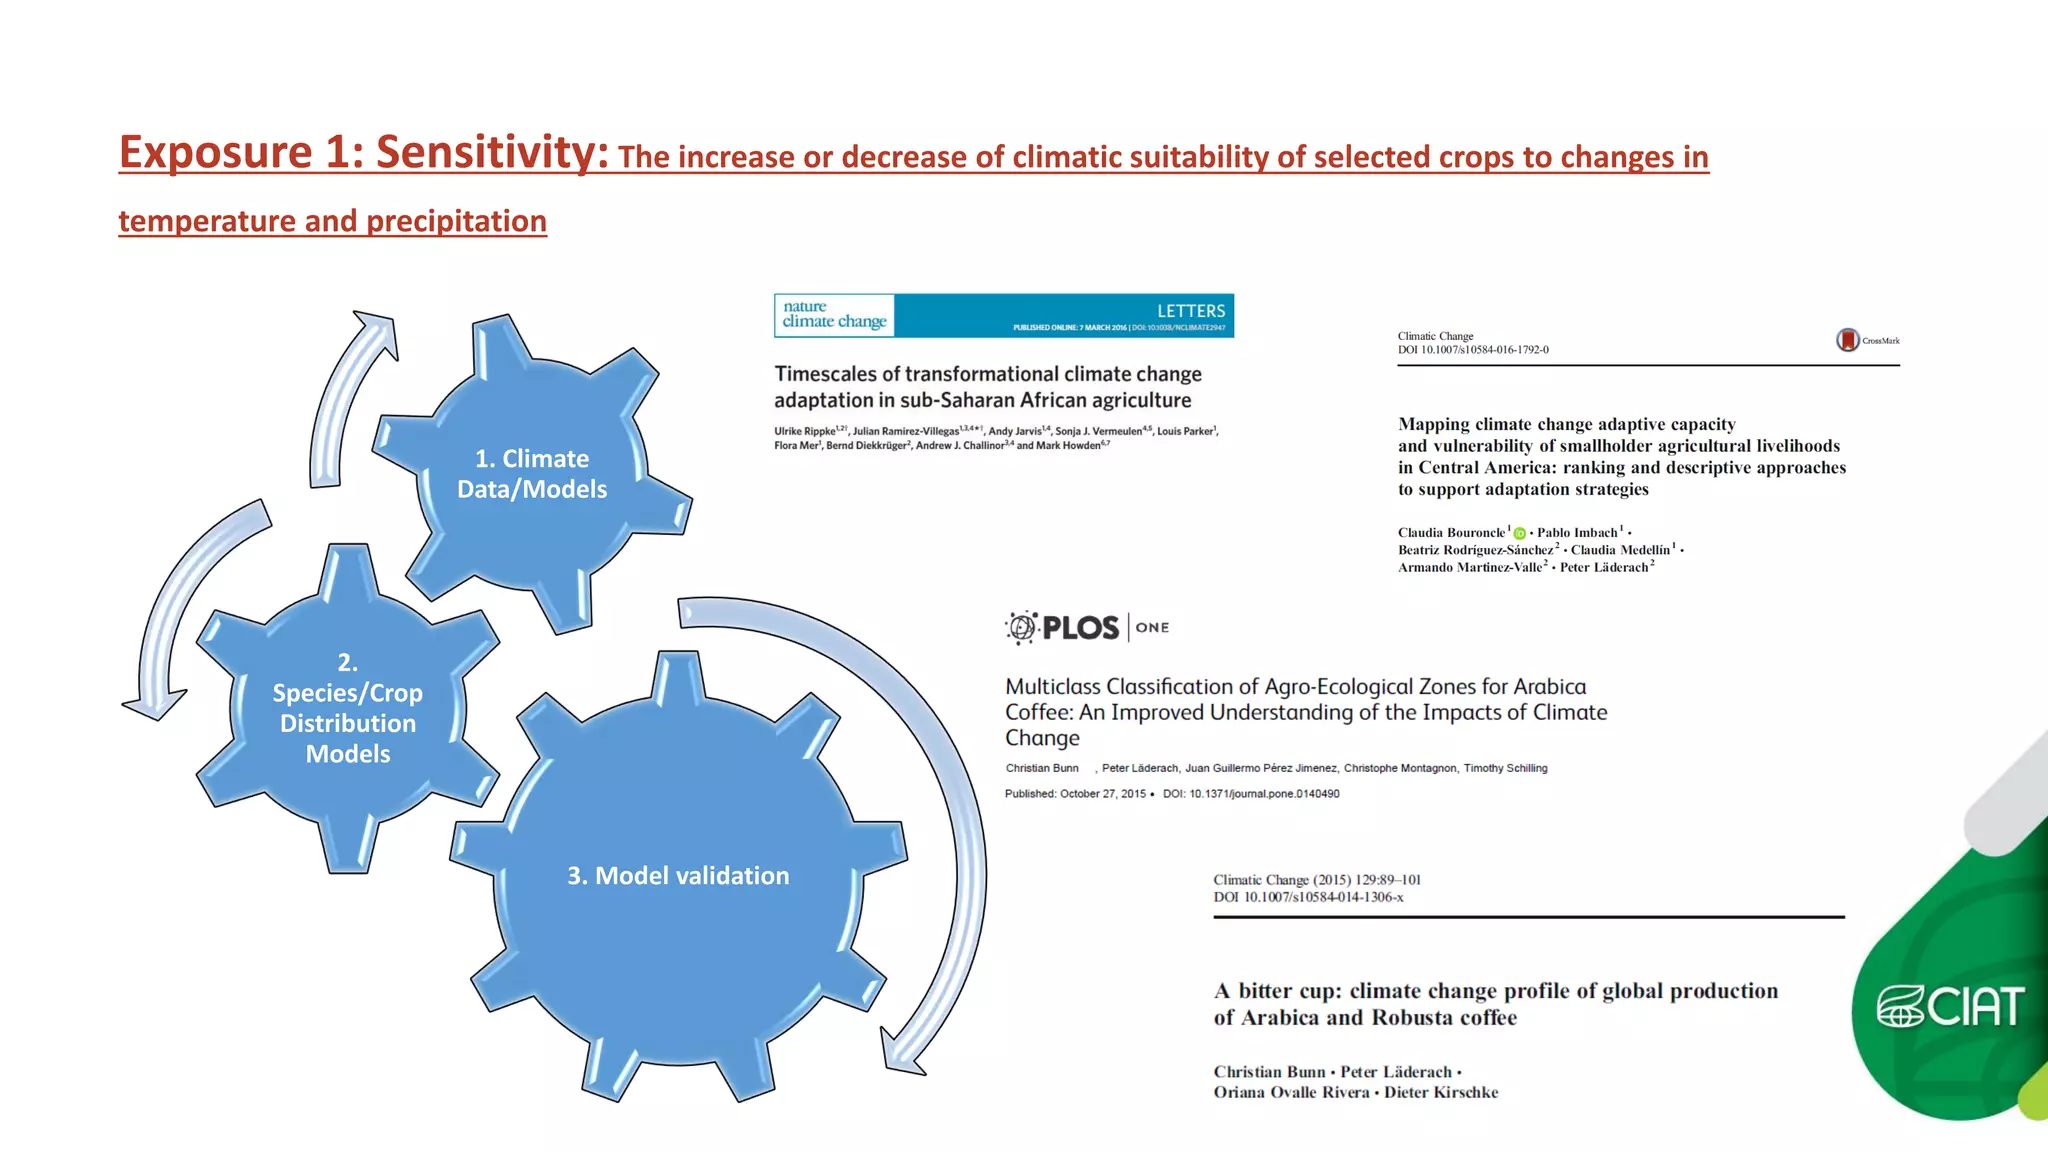


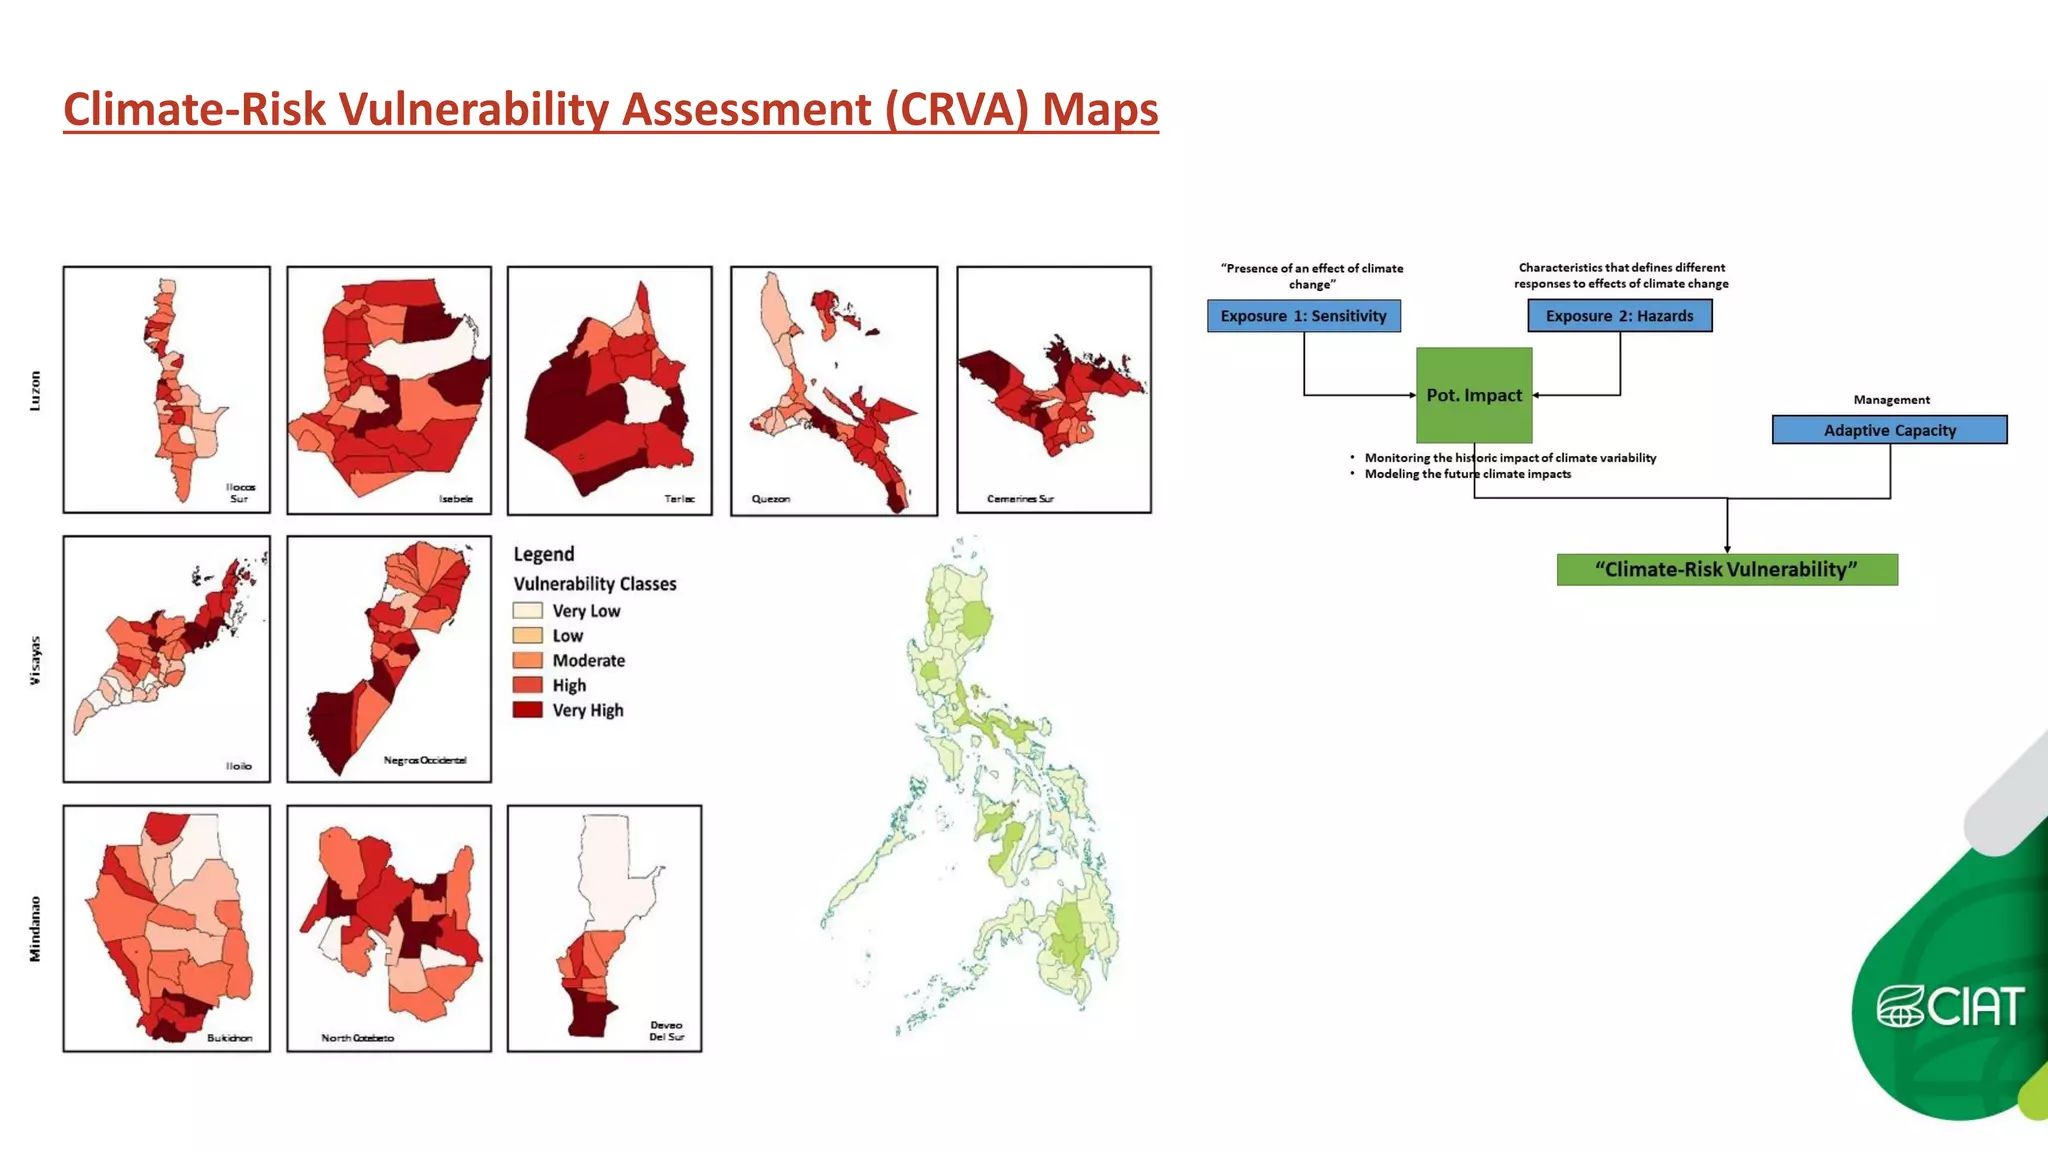
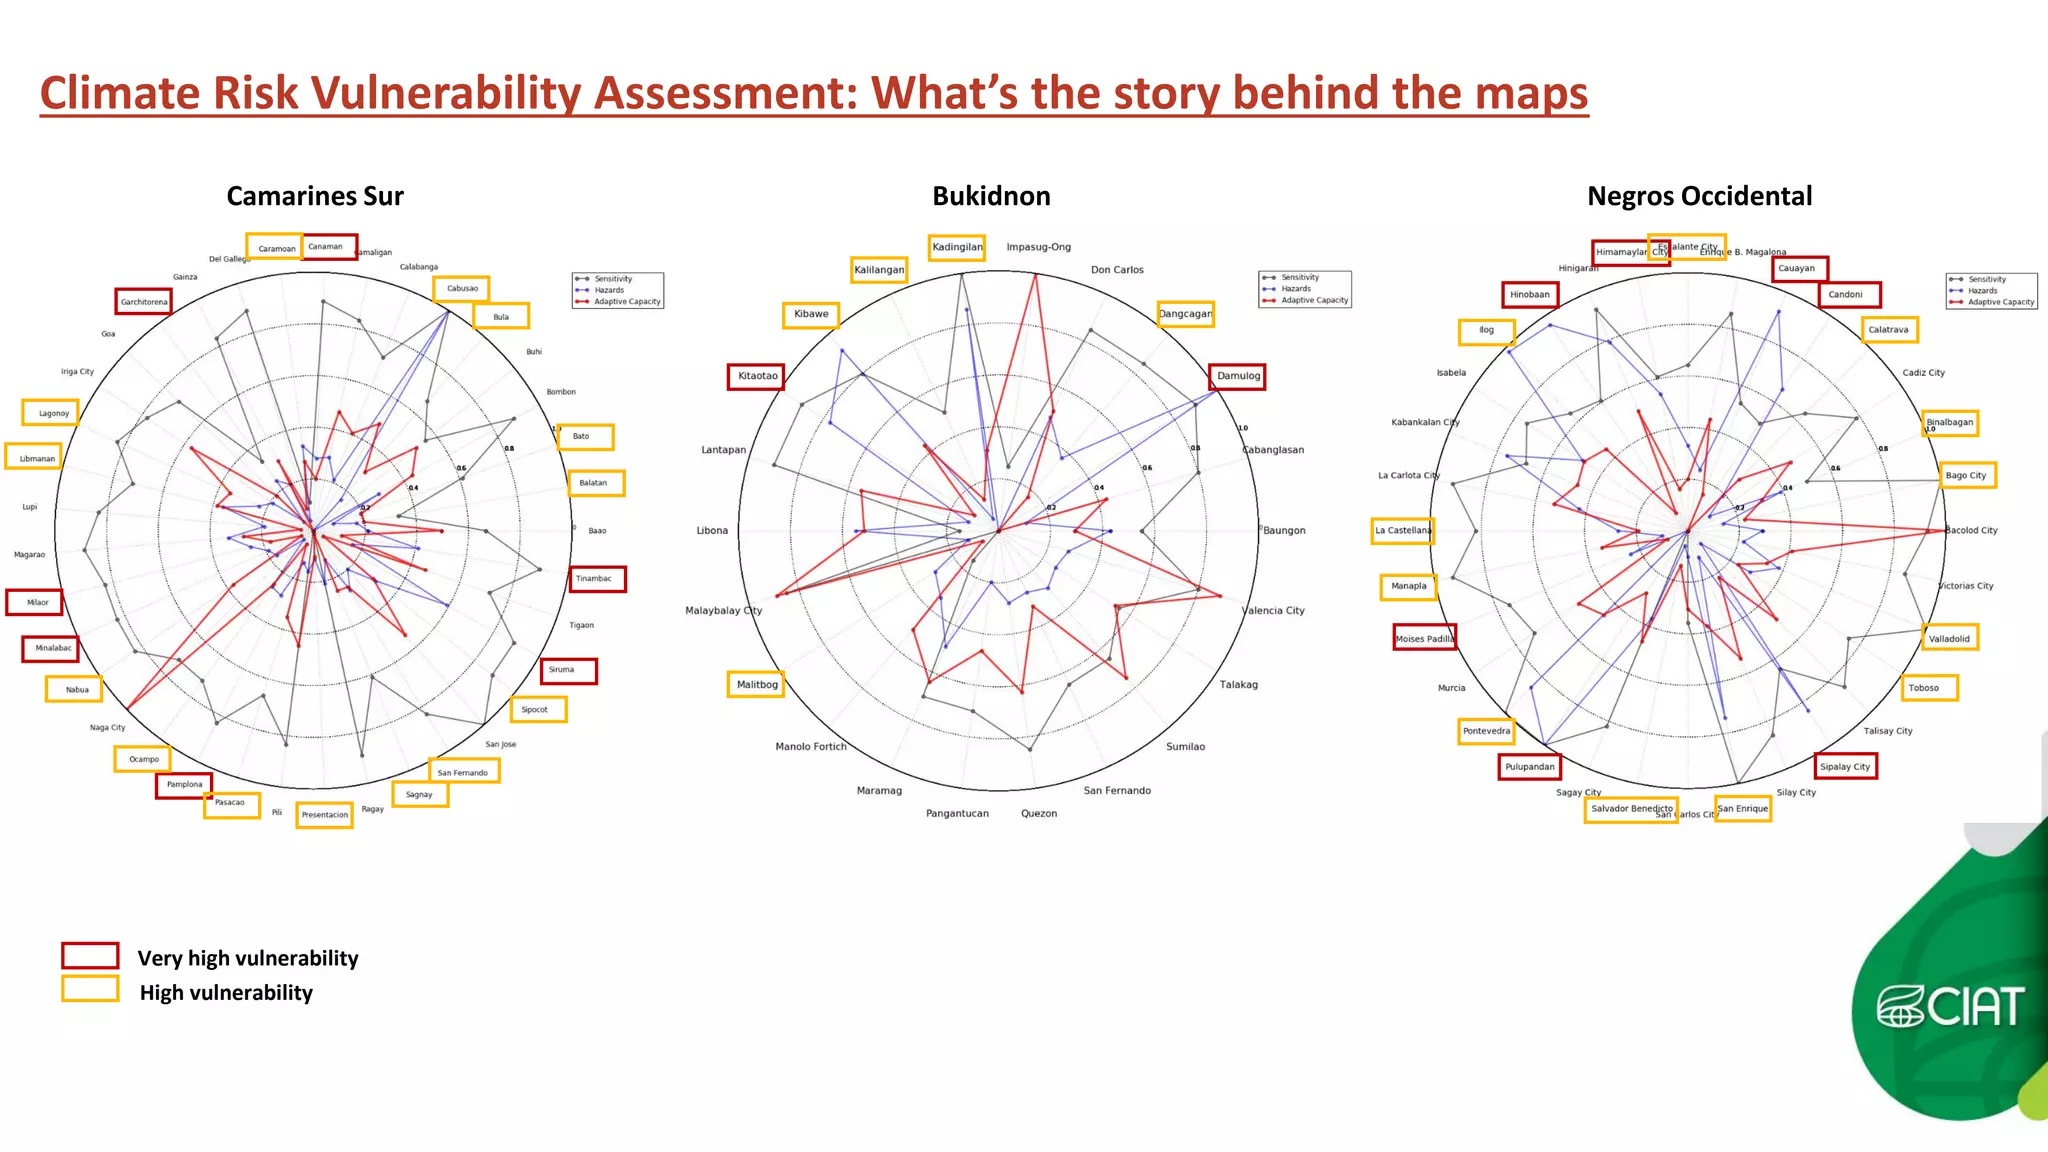
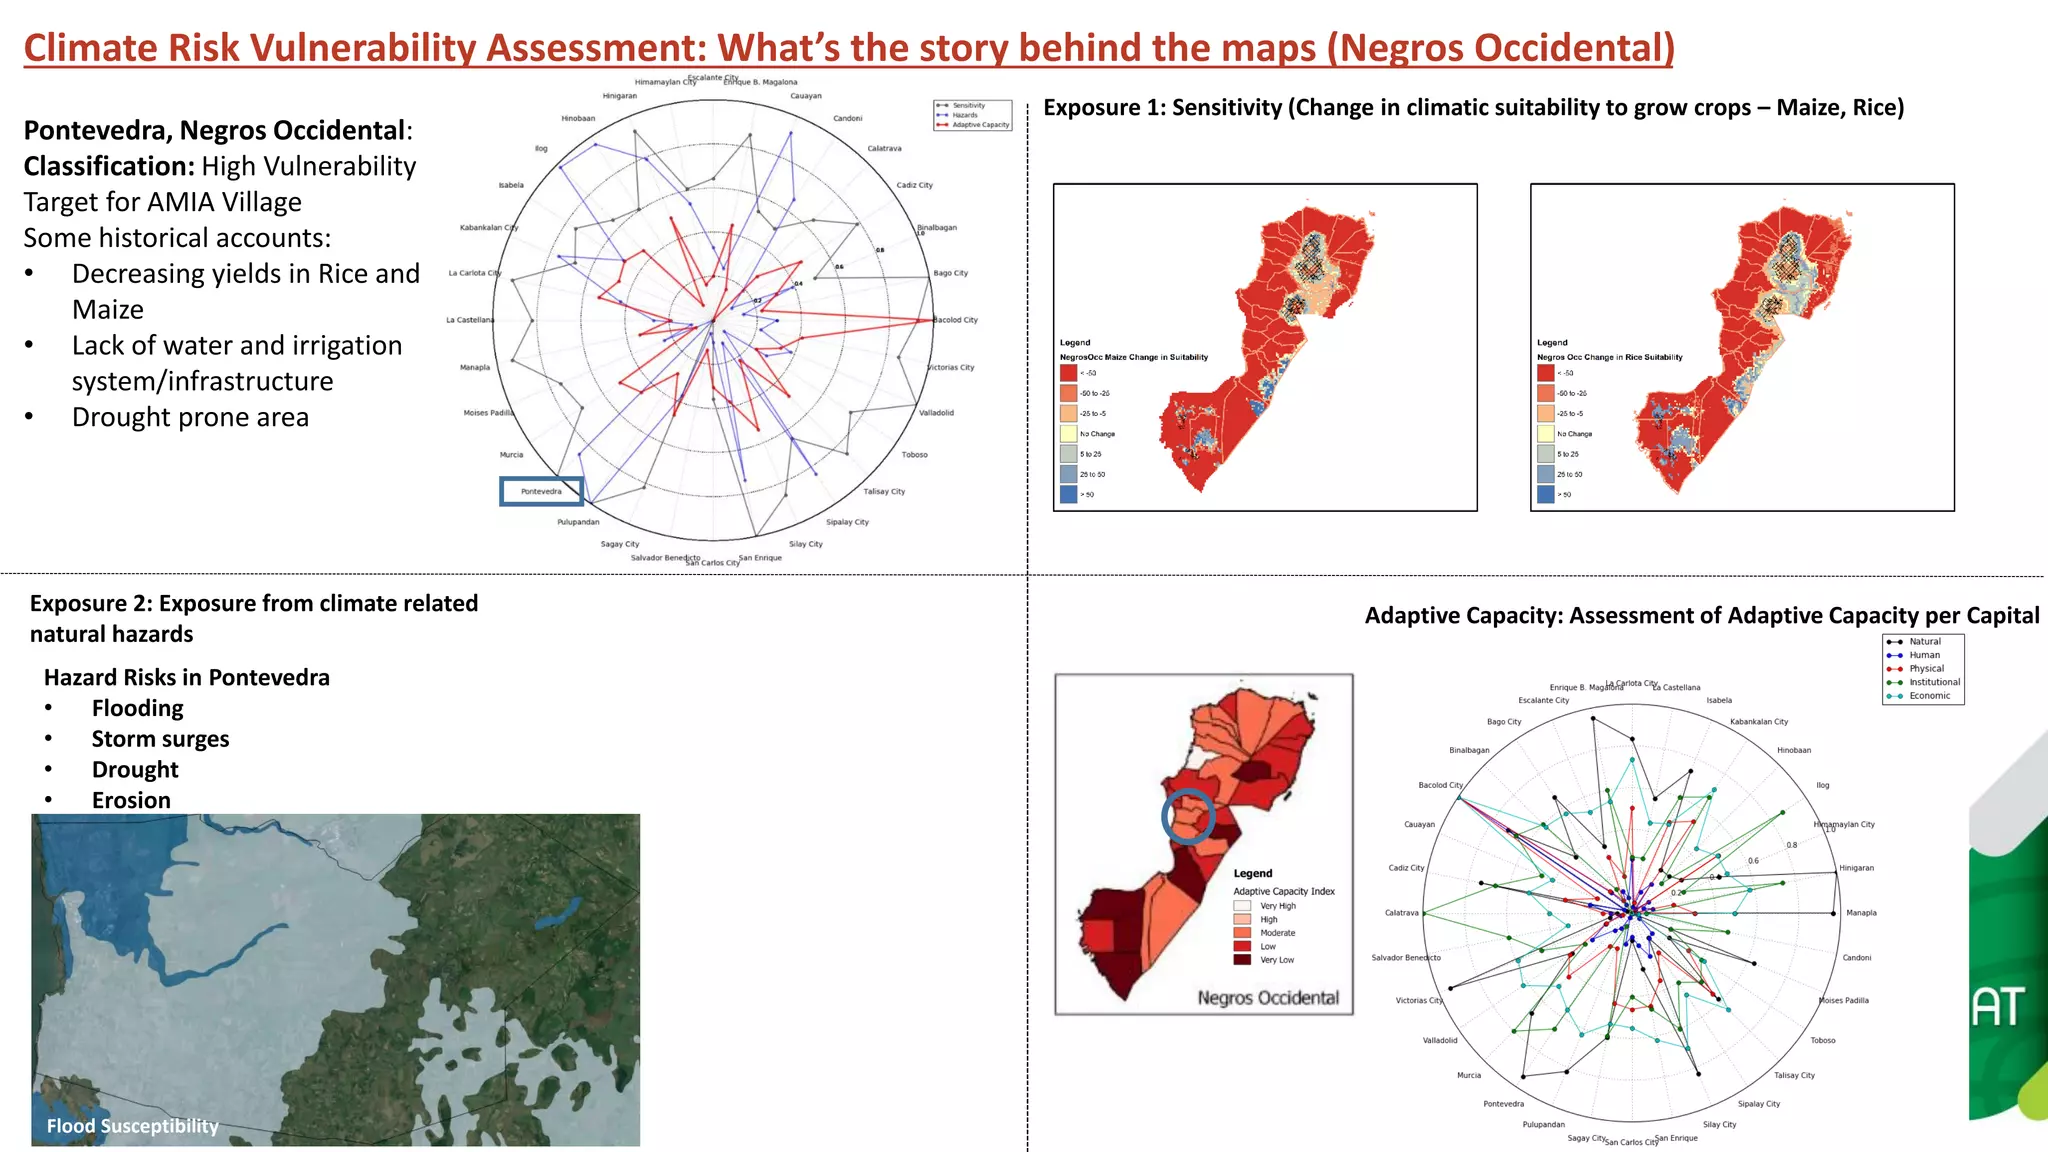


The document presents a Climate Risk Vulnerability Assessment (CRVA) framework, focusing on geospatial targeting and prioritization of areas vulnerable to climate change impacts. It outlines three key dimensions of vulnerability: exposure to climate variations, sensitivity of crops to climatic changes, and adaptive capacity of the systems involved. The assessment aims to guide decision-makers in identifying high-risk areas for intervention and fostering cross-sector collaboration to enhance agricultural resilience.


