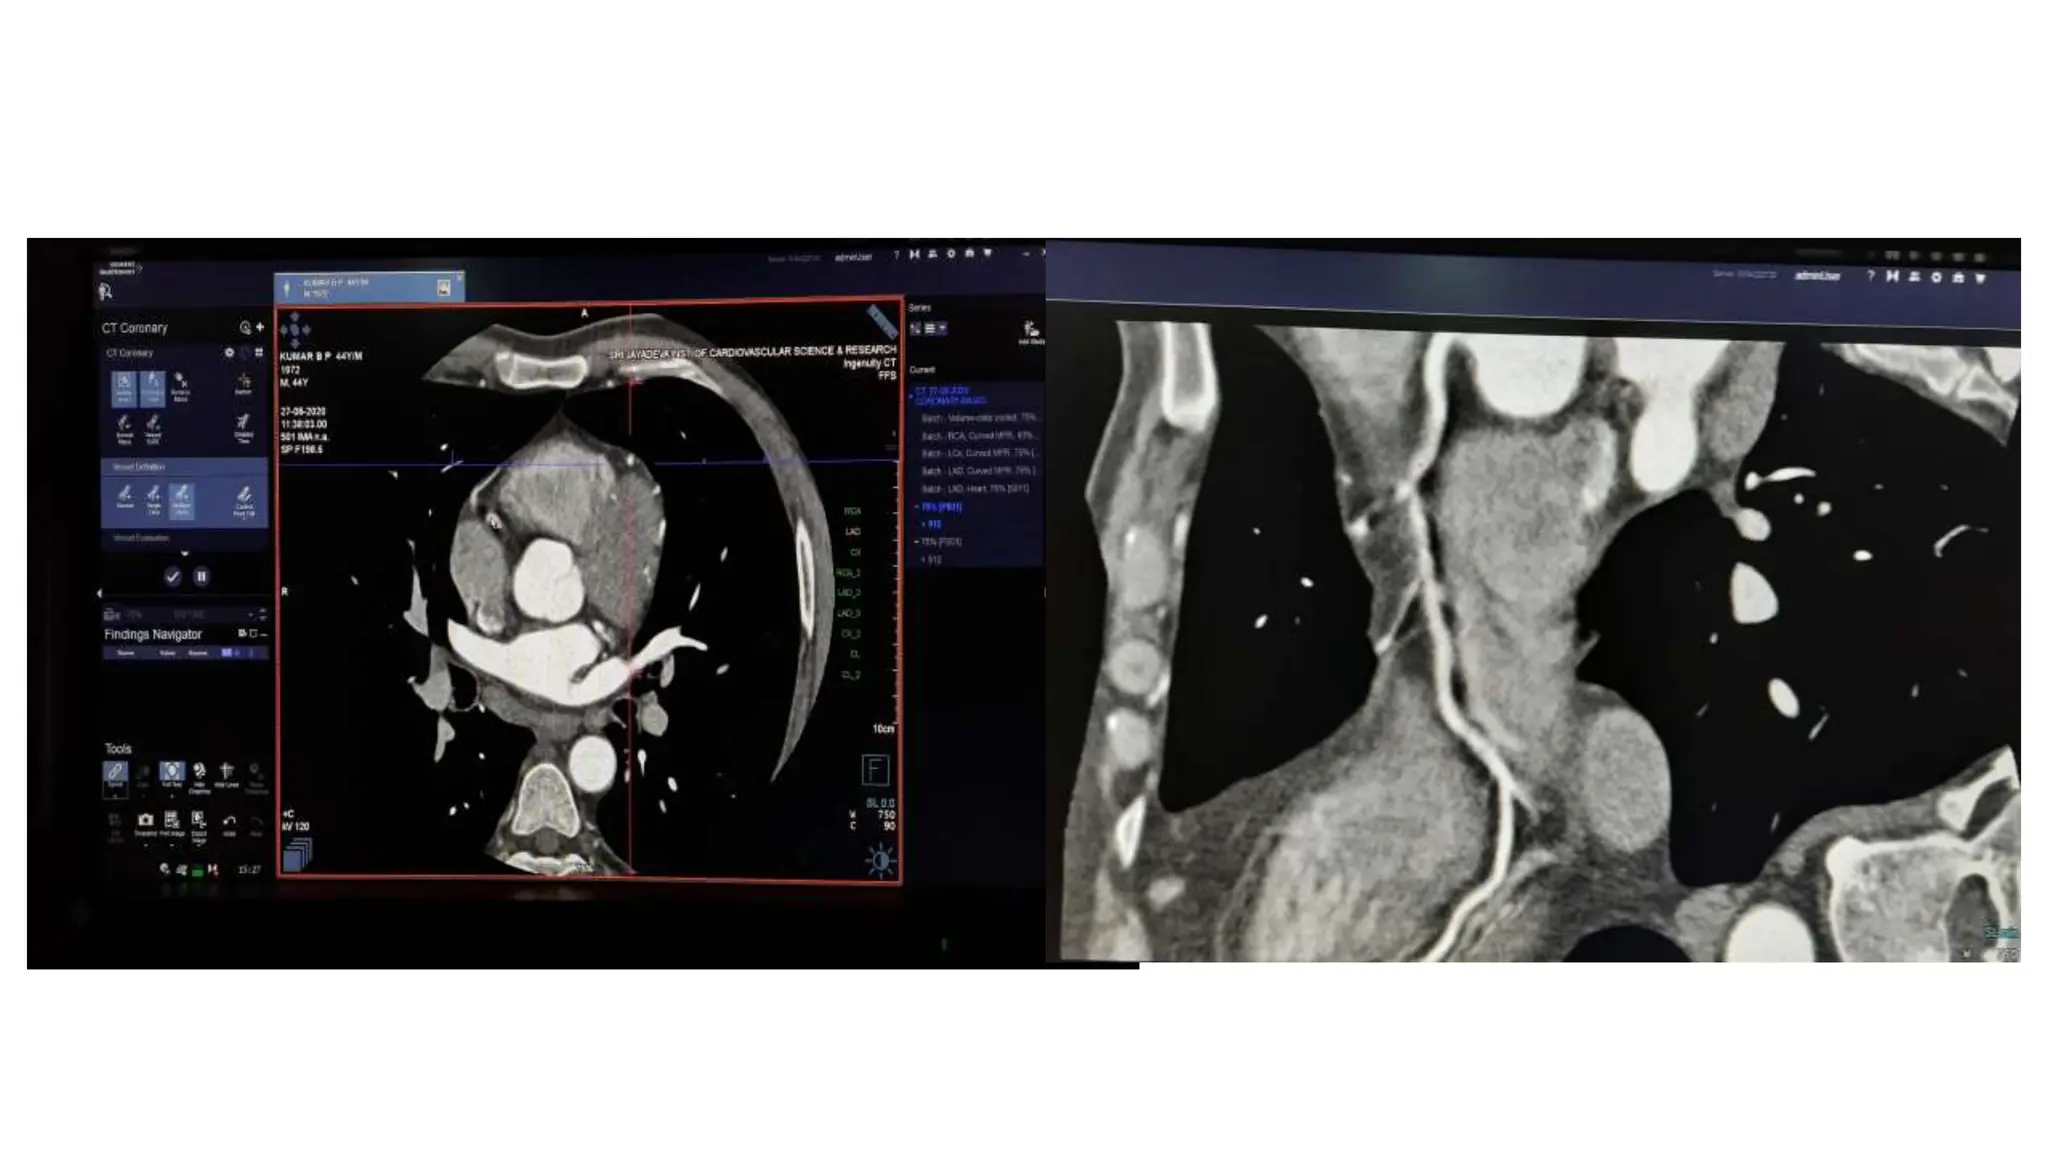
CT coronary angiography can provide detailed images of the coronary arteries. It has high temporal and spatial resolution allowing visualization of small coronary arteries. The technique uses ECG gating and retrospective reconstruction to achieve motion-free images. Various pathologies like stenosis, anomalies, plaques and bypass grafts can be evaluated. Image quality can be affected by artifacts from calcium, stents or irregular heart rates.
This document discusses the evolution and advances in coronary CT angiography (CCTA) technology and its role in the assessment of coronary artery disease (CAD). Key points include:
- CCTA has advanced from early CT scanners with 4-minute scan times to modern multi-detector scanners that can image the entire heart in a single heartbeat.
- CCTA provides information on coronary artery anatomy, plaque characteristics, and has prognostic value when assessing coronary artery calcium scoring.
- CCTA has good accuracy for detecting CAD compared to invasive coronary angiography, especially for ruling out disease, though its role in asymptomatic patients is still unclear.
- CCTA is useful for evaluating coronary anomalies, bypass grafts,
This document discusses computed tomography angiography (CTA) and its applications in cardiology. CTA uses computed tomography to visualize blood vessels throughout the body, including coronary arteries. Coronary CTA can detect plaque buildup in coronary arteries without being invasive. Current multidetector CT systems can acquire high-resolution images of the heart within 20 seconds while the patient holds their breath. Coronary CTA provides diagnostic information but also exposes patients to radiation. It is most useful for evaluating cardiac symptoms in low-to-intermediate risk patients.
Cardiac MRI provides concise summaries of medical documents in 3 sentences or less:
Cardiac MRI has a history dating back to the 1970s when the first MRI machine was developed and techniques for generating images were discovered, leading to the Nobel Prize. MRI uses magnetic fields and radio waves to generate detailed images of the heart and blood vessels without using ionizing radiation. Cardiac MRI is now used clinically to assess cardiac structure and function, detect ischemia and scar tissue, and evaluate various cardiomyopathies.
This document discusses techniques and tools for percutaneous coronary intervention (PCI) in calcified lesions. It summarizes that calcified lesions are challenging to treat with PCI due to increased risk of incomplete lesion preparation and stent failure. Imaging modalities like intravascular ultrasound (IVUS) and optical coherence tomography (OCT) can help identify calcification. Treatment options discussed include rotational atherectomy, orbital atherectomy, cutting/scoring balloons, and lithoplasty balloons. Clinical trials found that while these techniques can treat calcified lesions, they also carry higher risks of complications compared to conventional angioplasty. Careful lesion assessment and technique selection are important for optimizing outcomes in patients with calcified coronary lesions.
This document discusses Doppler ultrasound of the carotid arteries. It begins with an introduction describing how carotid artery disease can cause strokes and how ultrasound is used to diagnose stenosis to determine surgical candidates. It then describes the anatomy of the carotid arteries and outlines the normal ultrasound appearance. Key points of a carotid ultrasound exam are described including using grayscale, color Doppler, power Doppler and spectral analysis. Different types of carotid plaques are defined as well as how they appear ultrasonographically. Methods for evaluating stenosis and differentiating true from pseudo-spectral broadening are also covered.
Computerized tomographic angiography (CTA) uses CT imaging with intravenous iodinated contrast to visualize blood vessels. It can be used to assess conditions like aneurysms, atherosclerosis, and tumors. For a head and neck CTA, iodinated contrast is power injected at 4-5 ml/s, followed by a saline flush. Scanning is timed to maximize arterial contrast while minimizing venous overlay. CTA requires minimizing radiation exposure while obtaining diagnostic image quality to safely evaluate head and neck vasculature.
CT angiography (CTA) uses computed tomography (CT) and intravenous iodinated contrast to visualize blood vessels. It can be used to assess arteries, veins, and vascular structures throughout the head and neck. Performing a CTA requires optimizing multiple factors including the injection of contrast, timing of the CT scan, and image post-processing techniques. The document provides detailed guidelines on patient preparation, equipment, techniques, and safety considerations for head and neck CTA exams.
This document provides an overview of nuclear cardiology techniques used in the assessment of coronary artery disease (CAD). It discusses the history and development of nuclear medicine imaging including planar imaging and SPECT/PET. Key aspects summarized are:
1. SPECT imaging involves injection of radiotracers like thallium-201 or technetium-99m which distribute to the myocardium proportional to blood flow. Gamma photons are detected and reconstructed to provide 3D images of radiotracer distribution.
2. PET imaging uses positron-emitting radiotracers like rubidium-82 or ammonia-13 for perfusion and fluorodeoxyglucose for metabolism. It provides higher resolution functional imaging
This document provides guidelines for performing and interpreting a carotid Doppler ultrasound study. It describes optimal patient positioning and transducer selection. All carotid arteries should be thoroughly imaged using B-mode, color Doppler, power Doppler, and spectral Doppler. Limitations and techniques to avoid are outlined. Proper scanning techniques including Doppler settings, sample volume placement, and angle correction are explained. Normal carotid artery waveform patterns are demonstrated. Indications for carotid ultrasound and common carotid pathologies like plaque and stenosis are described.
Optical coherence tomography (OCT) provides high-resolution cross-sectional images of tissue structures on the micron scale in situ and in real time. It uses near-infrared light instead of sound like IVUS. OCT images are generated by measuring the echo time delay and intensity of light reflected or backscattered from internal structures using interferometry techniques. OCT can characterize atherosclerotic plaque composition and identify thin fibrous caps. Studies have shown OCT can detect plaque rupture and intracoronary thrombus with higher accuracy than IVUS or angiography.
This document discusses various cardiovascular imaging modalities:
- Stress ECG provides a cheap, fast way to detect ischemia but has low sensitivity and does not localize ischemia. Stress echocardiography can assess contractile reserve but requires expertise. Perfusion scintigraphy can quantify and localize ischemia but has intermediate sensitivity and high radiation. CT and cardiac MRI provide anatomical information but require expertise and may not be widely available. Invasive coronary angiography remains the gold standard for assessing coronary stenosis and allows additional intravascular imaging but is more expensive. Fractional flow reserve measured during angiography is the gold standard for detecting ischemia. Right heart catheterization allows direct invasive hemodynamic measurement.
This document discusses diagnostic imaging for acute ischemic stroke. It provides details on the use of non-contrast CT, MRI, CT angiography and MR angiography to evaluate patients with suspected stroke. CT is widely available but MRI, especially diffusion-weighted imaging, can detect small or recent strokes better. Ultrasound is used to screen for carotid artery stenosis and can classify severity based on blood flow velocities. Digital subtraction angiography remains the gold standard but is more invasive. The pathophysiology of cerebral infarction over time correlates to changing imaging appearances on CT and MRI.
This document discusses how multislice computed tomography (MSCT) can guide percutaneous coronary intervention (PCI). MSCT can help characterize plaque, precisely measure lesion length, and identify the optimal angiographic views for complex lesions like chronic total occlusions. Studies have found higher success rates for CTO recanalization when guided by pre-procedural MSCT. MSCT also aids in evaluating aorto-ostial, bifurcation, and diffuse coronary lesions prior to PCI. While limitations remain, MSCT guidance can improve PCI outcomes for difficult coronary cases not fully defined by invasive angiography alone.
This document provides information on carotid Doppler ultrasound studies, including:
- Anatomy of the carotid arteries and branches
- Technique for performing carotid Doppler ultrasound exams, including patient positioning, transducer use, and Doppler settings
- Analysis of waveforms in normal carotid arteries versus arteries with disease
- Causes of carotid artery disease and common sites of extracranial arterial disease
- Characterization of carotid plaques based on echogenicity, morphology, and other properties.
This document discusses coronary CT and the evaluation of coronary stents and grafts using CT imaging. It provides details on:
- The history and development of CT for evaluating coronary stents from early electron beam CT to modern multi-slice CT.
- Challenges of imaging coronary arteries and stents due to cardiac motion and small vessel size.
- Techniques used for cardiac CT imaging including ECG gating, temporal and spatial resolution requirements.
- Normal coronary artery anatomy and examples of CT images showing normal findings and a myocardial bridge.
The document discusses coronary angiography, which is used to visualize the coronary arteries and detect blockages. It remains the gold standard for diagnosing coronary artery disease. The procedure involves inserting a catheter into an artery and using contrast dye and x-rays to view the arteries. It can be used for diagnostic purposes or to guide interventional procedures like angioplasty and stenting to open blocked arteries. The goals, indications, contraindications, and basic procedure steps are outlined.
CT perfusion (CTP) provides important hemodynamic information about cerebral blood flow, blood volume, and mean transit time that complements CT angiography in the evaluation of acute stroke. CTP can help characterize acute ischemic stroke by identifying critically ischemic tissue in the stroke "core" and potentially salvageable tissue in the "penumbra", guiding treatment decisions about thrombolysis within time windows. A typical CTP exam involves an initial non-contrast CT followed by dynamic contrast-enhanced imaging over 40-60 seconds to generate perfusion maps and quantify key parameters.
Basics of Coronary Angiography Hewad Gulzai.pptxHewad Gulzai
Basics of Coronary Angiography for beginners, MD, DNB, DM students, Nurses, cathlab technicians, physicians and other healthcare members .
hope you will learn something from this ppt. 😀
Cardiovascular CT is a valuable tool for evaluating congenital heart disease in children. It provides high spatial and temporal resolution to depict complex anatomy. Key applications include assessing pulmonary blood flow in pulmonary atresia, vascular rings prior to surgery, coronary artery anomalies, and postoperative complications. Careful patient preparation and protocols are needed given pediatric concerns. CT enables simultaneous evaluation of vascular structures, airways, and cardiac function to comprehensively evaluate complex congenital heart disease.
This document discusses intravascular ultrasound (IVUS) as an imaging technique to evaluate coronary arteries. IVUS uses ultrasound waves to image the arterial walls and plaque in cross-section, providing information beyond what can be seen with angiography alone. The summary describes:
1) IVUS uses a catheter-mounted transducer to emit ultrasound waves into the artery and interpret the reflected waves to generate tomographic images of the arterial walls and plaque.
2) IVUS can characterize plaque morphology, distribution, and composition, aiding in diagnosis and treatment planning.
3) Some applications of IVUS include assessing indeterminate lesions, optimizing stent placement, and evaluating stent failures.
this presentation targets radio-diagnosis, neurology and neurosurgery junior staff, it presents simple basics of CT perfusion including principle, technique, applications, interpretation with few quiz cases.
This presentation includes stroke and infarct latest defination an pathophysiology and CT MRI imaging features and management . This presntation help alot. Thanks
Strain presentation class presentatio - copyAshish Golwara
This document discusses the evolution and clinical applications of strain imaging using echocardiography. Strain imaging allows quantitative analysis of myocardial deformation and function beyond what can be seen with conventional echocardiography. It describes how speckle tracking can measure longitudinal, radial, and circumferential strain to assess different regions of the heart. Clinical uses of strain imaging include early detection of chemotherapy-induced cardiomyopathy and assessment of valvular heart disease before changes in ejection fraction occur.
stroke FOAM Acute central nervous system injury with abrupt onsetDr Aya Ali
Acute central nervous system injury with abrupt
onset
Mechanism:
• Interruption of blood flow(Ischemic Stroke)
or
• Bleeding into or around the brain(Hemorrhagic
stroke)
This document summarizes the use of noninvasive MDCT imaging of the coronary arteries. It discusses the challenges of imaging small, rapidly moving coronary vessels. MDCT allows for successful coronary imaging with temporal resolution of 330-400ms, spatial resolution of 0.4-0.75mm, coverage of the heart in a single breath hold of 8-14 seconds. Sensitivity for detecting coronary stenosis is 80-86% for 4-16 slice MDCT and specificity is 90-97%. Potential clinical applications include decreasing invasive angiograms, improving risk assessment, detecting anomalies, and evaluating bypass grafts. Larger clinical trials are still needed to determine the impact on patient management.
These lecture slides, by Dr Sidra Arshad, offer a quick overview of the physiological basis of a normal electrocardiogram.
Learning objectives:
1. Define an electrocardiogram (ECG) and electrocardiography
2. Describe how dipoles generated by the heart produce the waveforms of the ECG
3. Describe the components of a normal electrocardiogram of a typical bipolar lead (limb II)
4. Differentiate between intervals and segments
5. Enlist some common indications for obtaining an ECG
6. Describe the flow of current around the heart during the cardiac cycle
7. Discuss the placement and polarity of the leads of electrocardiograph
8. Describe the normal electrocardiograms recorded from the limb leads and explain the physiological basis of the different records that are obtained
9. Define mean electrical vector (axis) of the heart and give the normal range
10. Define the mean QRS vector
11. Describe the axes of leads (hexagonal reference system)
12. Comprehend the vectorial analysis of the normal ECG
13. Determine the mean electrical axis of the ventricular QRS and appreciate the mean axis deviation
14. Explain the concepts of current of injury, J point, and their significance
Study Resources:
1. Chapter 11, Guyton and Hall Textbook of Medical Physiology, 14th edition
2. Chapter 9, Human Physiology - From Cells to Systems, Lauralee Sherwood, 9th edition
3. Chapter 29, Ganong’s Review of Medical Physiology, 26th edition
4. Electrocardiogram, StatPearls - https://www.ncbi.nlm.nih.gov/books/NBK549803/
5. ECG in Medical Practice by ABM Abdullah, 4th edition
6. Chapter 3, Cardiology Explained, https://www.ncbi.nlm.nih.gov/books/NBK2214/
7. ECG Basics, http://www.nataliescasebook.com/tag/e-c-g-basics
This document provides guidelines for performing and interpreting a carotid Doppler ultrasound study. It describes optimal patient positioning and transducer selection. All carotid arteries should be thoroughly imaged using B-mode, color Doppler, power Doppler, and spectral Doppler. Limitations and techniques to avoid are outlined. Proper scanning techniques including Doppler settings, sample volume placement, and angle correction are explained. Normal carotid artery waveform patterns are demonstrated. Indications for carotid ultrasound and common carotid pathologies like plaque and stenosis are described.
Optical coherence tomography (OCT) provides high-resolution cross-sectional images of tissue structures on the micron scale in situ and in real time. It uses near-infrared light instead of sound like IVUS. OCT images are generated by measuring the echo time delay and intensity of light reflected or backscattered from internal structures using interferometry techniques. OCT can characterize atherosclerotic plaque composition and identify thin fibrous caps. Studies have shown OCT can detect plaque rupture and intracoronary thrombus with higher accuracy than IVUS or angiography.
This document discusses various cardiovascular imaging modalities:
- Stress ECG provides a cheap, fast way to detect ischemia but has low sensitivity and does not localize ischemia. Stress echocardiography can assess contractile reserve but requires expertise. Perfusion scintigraphy can quantify and localize ischemia but has intermediate sensitivity and high radiation. CT and cardiac MRI provide anatomical information but require expertise and may not be widely available. Invasive coronary angiography remains the gold standard for assessing coronary stenosis and allows additional intravascular imaging but is more expensive. Fractional flow reserve measured during angiography is the gold standard for detecting ischemia. Right heart catheterization allows direct invasive hemodynamic measurement.
This document discusses diagnostic imaging for acute ischemic stroke. It provides details on the use of non-contrast CT, MRI, CT angiography and MR angiography to evaluate patients with suspected stroke. CT is widely available but MRI, especially diffusion-weighted imaging, can detect small or recent strokes better. Ultrasound is used to screen for carotid artery stenosis and can classify severity based on blood flow velocities. Digital subtraction angiography remains the gold standard but is more invasive. The pathophysiology of cerebral infarction over time correlates to changing imaging appearances on CT and MRI.
This document discusses how multislice computed tomography (MSCT) can guide percutaneous coronary intervention (PCI). MSCT can help characterize plaque, precisely measure lesion length, and identify the optimal angiographic views for complex lesions like chronic total occlusions. Studies have found higher success rates for CTO recanalization when guided by pre-procedural MSCT. MSCT also aids in evaluating aorto-ostial, bifurcation, and diffuse coronary lesions prior to PCI. While limitations remain, MSCT guidance can improve PCI outcomes for difficult coronary cases not fully defined by invasive angiography alone.
This document provides information on carotid Doppler ultrasound studies, including:
- Anatomy of the carotid arteries and branches
- Technique for performing carotid Doppler ultrasound exams, including patient positioning, transducer use, and Doppler settings
- Analysis of waveforms in normal carotid arteries versus arteries with disease
- Causes of carotid artery disease and common sites of extracranial arterial disease
- Characterization of carotid plaques based on echogenicity, morphology, and other properties.
This document discusses coronary CT and the evaluation of coronary stents and grafts using CT imaging. It provides details on:
- The history and development of CT for evaluating coronary stents from early electron beam CT to modern multi-slice CT.
- Challenges of imaging coronary arteries and stents due to cardiac motion and small vessel size.
- Techniques used for cardiac CT imaging including ECG gating, temporal and spatial resolution requirements.
- Normal coronary artery anatomy and examples of CT images showing normal findings and a myocardial bridge.
The document discusses coronary angiography, which is used to visualize the coronary arteries and detect blockages. It remains the gold standard for diagnosing coronary artery disease. The procedure involves inserting a catheter into an artery and using contrast dye and x-rays to view the arteries. It can be used for diagnostic purposes or to guide interventional procedures like angioplasty and stenting to open blocked arteries. The goals, indications, contraindications, and basic procedure steps are outlined.
CT perfusion (CTP) provides important hemodynamic information about cerebral blood flow, blood volume, and mean transit time that complements CT angiography in the evaluation of acute stroke. CTP can help characterize acute ischemic stroke by identifying critically ischemic tissue in the stroke "core" and potentially salvageable tissue in the "penumbra", guiding treatment decisions about thrombolysis within time windows. A typical CTP exam involves an initial non-contrast CT followed by dynamic contrast-enhanced imaging over 40-60 seconds to generate perfusion maps and quantify key parameters.
Basics of Coronary Angiography Hewad Gulzai.pptxHewad Gulzai
Basics of Coronary Angiography for beginners, MD, DNB, DM students, Nurses, cathlab technicians, physicians and other healthcare members .
hope you will learn something from this ppt. 😀
Cardiovascular CT is a valuable tool for evaluating congenital heart disease in children. It provides high spatial and temporal resolution to depict complex anatomy. Key applications include assessing pulmonary blood flow in pulmonary atresia, vascular rings prior to surgery, coronary artery anomalies, and postoperative complications. Careful patient preparation and protocols are needed given pediatric concerns. CT enables simultaneous evaluation of vascular structures, airways, and cardiac function to comprehensively evaluate complex congenital heart disease.
This document discusses intravascular ultrasound (IVUS) as an imaging technique to evaluate coronary arteries. IVUS uses ultrasound waves to image the arterial walls and plaque in cross-section, providing information beyond what can be seen with angiography alone. The summary describes:
1) IVUS uses a catheter-mounted transducer to emit ultrasound waves into the artery and interpret the reflected waves to generate tomographic images of the arterial walls and plaque.
2) IVUS can characterize plaque morphology, distribution, and composition, aiding in diagnosis and treatment planning.
3) Some applications of IVUS include assessing indeterminate lesions, optimizing stent placement, and evaluating stent failures.
this presentation targets radio-diagnosis, neurology and neurosurgery junior staff, it presents simple basics of CT perfusion including principle, technique, applications, interpretation with few quiz cases.
This presentation includes stroke and infarct latest defination an pathophysiology and CT MRI imaging features and management . This presntation help alot. Thanks
Strain presentation class presentatio - copyAshish Golwara
This document discusses the evolution and clinical applications of strain imaging using echocardiography. Strain imaging allows quantitative analysis of myocardial deformation and function beyond what can be seen with conventional echocardiography. It describes how speckle tracking can measure longitudinal, radial, and circumferential strain to assess different regions of the heart. Clinical uses of strain imaging include early detection of chemotherapy-induced cardiomyopathy and assessment of valvular heart disease before changes in ejection fraction occur.
stroke FOAM Acute central nervous system injury with abrupt onsetDr Aya Ali
Acute central nervous system injury with abrupt
onset
Mechanism:
• Interruption of blood flow(Ischemic Stroke)
or
• Bleeding into or around the brain(Hemorrhagic
stroke)
This document summarizes the use of noninvasive MDCT imaging of the coronary arteries. It discusses the challenges of imaging small, rapidly moving coronary vessels. MDCT allows for successful coronary imaging with temporal resolution of 330-400ms, spatial resolution of 0.4-0.75mm, coverage of the heart in a single breath hold of 8-14 seconds. Sensitivity for detecting coronary stenosis is 80-86% for 4-16 slice MDCT and specificity is 90-97%. Potential clinical applications include decreasing invasive angiograms, improving risk assessment, detecting anomalies, and evaluating bypass grafts. Larger clinical trials are still needed to determine the impact on patient management.
Similar to 18-09-2020 CT CORONARY ANGIOGRAM Dr.Sowmya.Dr.BGJ.pptx.pptx (20)
These lecture slides, by Dr Sidra Arshad, offer a quick overview of the physiological basis of a normal electrocardiogram.
Learning objectives:
1. Define an electrocardiogram (ECG) and electrocardiography
2. Describe how dipoles generated by the heart produce the waveforms of the ECG
3. Describe the components of a normal electrocardiogram of a typical bipolar lead (limb II)
4. Differentiate between intervals and segments
5. Enlist some common indications for obtaining an ECG
6. Describe the flow of current around the heart during the cardiac cycle
7. Discuss the placement and polarity of the leads of electrocardiograph
8. Describe the normal electrocardiograms recorded from the limb leads and explain the physiological basis of the different records that are obtained
9. Define mean electrical vector (axis) of the heart and give the normal range
10. Define the mean QRS vector
11. Describe the axes of leads (hexagonal reference system)
12. Comprehend the vectorial analysis of the normal ECG
13. Determine the mean electrical axis of the ventricular QRS and appreciate the mean axis deviation
14. Explain the concepts of current of injury, J point, and their significance
Study Resources:
1. Chapter 11, Guyton and Hall Textbook of Medical Physiology, 14th edition
2. Chapter 9, Human Physiology - From Cells to Systems, Lauralee Sherwood, 9th edition
3. Chapter 29, Ganong’s Review of Medical Physiology, 26th edition
4. Electrocardiogram, StatPearls - https://www.ncbi.nlm.nih.gov/books/NBK549803/
5. ECG in Medical Practice by ABM Abdullah, 4th edition
6. Chapter 3, Cardiology Explained, https://www.ncbi.nlm.nih.gov/books/NBK2214/
7. ECG Basics, http://www.nataliescasebook.com/tag/e-c-g-basics
Hiranandani Hospital in Powai, Mumbai, is a premier healthcare institution that has been serving the community with exceptional medical care since its establishment. As a part of the renowned Hiranandani Group, the hospital is committed to delivering world-class healthcare services across a wide range of specialties, including kidney transplantation. With its state-of-the-art facilities, advanced medical technology, and a team of highly skilled healthcare professionals, Hiranandani Hospital has earned a reputation as a trusted name in the healthcare industry. The hospital's patient-centric approach, coupled with its focus on innovation and excellence, ensures that patients receive the highest standard of care in a compassionate and supportive environment.
Promoting Wellbeing - Applied Social Psychology - Psychology SuperNotesPsychoTech Services
A proprietary approach developed by bringing together the best of learning theories from Psychology, design principles from the world of visualization, and pedagogical methods from over a decade of training experience, that enables you to: Learn better, faster!
Rasamanikya is a excellent preparation in the field of Rasashastra, it is used in various Kushtha Roga, Shwasa, Vicharchika, Bhagandara, Vatarakta, and Phiranga Roga. In this article Preparation& Comparative analytical profile for both Formulationon i.e Rasamanikya prepared by Kushmanda swarasa & Churnodhaka Shodita Haratala. The study aims to provide insights into the comparative efficacy and analytical aspects of these formulations for enhanced therapeutic outcomes.
Travel vaccination in Manchester offers comprehensive immunization services for individuals planning international trips. Expert healthcare providers administer vaccines tailored to your destination, ensuring you stay protected against various diseases. Conveniently located clinics and flexible appointment options make it easy to get the necessary shots before your journey. Stay healthy and travel with confidence by getting vaccinated in Manchester. Visit us: www.nxhealthcare.co.uk
Clinic ^%[+27633867063*Abortion Pills For Sale In Tembisa Central19various
Clinic ^%[+27633867063*Abortion Pills For Sale In Tembisa Central Clinic ^%[+27633867063*Abortion Pills For Sale In Tembisa CentralClinic ^%[+27633867063*Abortion Pills For Sale In Tembisa CentralClinic ^%[+27633867063*Abortion Pills For Sale In Tembisa CentralClinic ^%[+27633867063*Abortion Pills For Sale In Tembisa Central
share - Lions, tigers, AI and health misinformation, oh my!.pptxTina Purnat
• Pitfalls and pivots needed to use AI effectively in public health
• Evidence-based strategies to address health misinformation effectively
• Building trust with communities online and offline
• Equipping health professionals to address questions, concerns and health misinformation
• Assessing risk and mitigating harm from adverse health narratives in communities, health workforce and health system
Local Advanced Lung Cancer: Artificial Intelligence, Synergetics, Complex Sys...Oleg Kshivets
Overall life span (LS) was 1671.7±1721.6 days and cumulative 5YS reached 62.4%, 10 years – 50.4%, 20 years – 44.6%. 94 LCP lived more than 5 years without cancer (LS=2958.6±1723.6 days), 22 – more than 10 years (LS=5571±1841.8 days). 67 LCP died because of LC (LS=471.9±344 days). AT significantly improved 5YS (68% vs. 53.7%) (P=0.028 by log-rank test). Cox modeling displayed that 5YS of LCP significantly depended on: N0-N12, T3-4, blood cell circuit, cell ratio factors (ratio between cancer cells-CC and blood cells subpopulations), LC cell dynamics, recalcification time, heparin tolerance, prothrombin index, protein, AT, procedure type (P=0.000-0.031). Neural networks, genetic algorithm selection and bootstrap simulation revealed relationships between 5YS and N0-12 (rank=1), thrombocytes/CC (rank=2), segmented neutrophils/CC (3), eosinophils/CC (4), erythrocytes/CC (5), healthy cells/CC (6), lymphocytes/CC (7), stick neutrophils/CC (8), leucocytes/CC (9), monocytes/CC (10). Correct prediction of 5YS was 100% by neural networks computing (error=0.000; area under ROC curve=1.0).
Integrating Ayurveda into Parkinson’s Management: A Holistic ApproachAyurveda ForAll
Explore the benefits of combining Ayurveda with conventional Parkinson's treatments. Learn how a holistic approach can manage symptoms, enhance well-being, and balance body energies. Discover the steps to safely integrate Ayurvedic practices into your Parkinson’s care plan, including expert guidance on diet, herbal remedies, and lifestyle modifications.
Does Over-Masturbation Contribute to Chronic Prostatitis.pptxwalterHu5
In some case, your chronic prostatitis may be related to over-masturbation. Generally, natural medicine Diuretic and Anti-inflammatory Pill can help mee get a cure.
4. TECHNICAL ASPECTS
Challenges of coronary imaging:
• Small arteries
• Mobility of vessels & underlying heart
• Need to assess the lumen & wall
• Variable & Fast Heart rate
• Tilt & rotation of heart away from body
axes
Solutions:
• Increased Temporal resolution
• Increased Spatial resolution
• Multiplanar reconstruction
5. TEMPORAL RESOLUTION
• Implies scan time (msec) required to obtain data needed for image
reconstruction.
• Lower the temporal resolution; better the images with least motion
being captured.
• For motion free imaging TR 250 msec for heart rates up to 70
beats/min and up to 150 msec for heart rates greater than 100 bpm.
• Ideally conventional invasive coronary angiography has TR of 1-10
msec
7. HEART RATE
• Cardiac cycle consists of systole and
diastole.
• Least amount of cardiac motion
occur during diastolic phase, when
ventricles are passively filling.
• As the heart rate increases, the
period of diastole narrows down
requiring a machine with resolution
of less than 100ms
9. GANTRY ROTATION TIME
• Amount of time required to complete one full rotation (360°)
• Faster the gantry rotation, the greater the temporal resolution
• To date, fastest gantry rotation time is 280msec
11. Prospective ECG Triggering
• ECG is continuously monitored
• X rays are turned on at predetermined
portion of R-R intervals
• Always sequential
• Lower patient dose
• Used in calcium scoring
• Drawbacks:
No functional evaluation
Patients having irregular Heart rate
12. Retrospective ECG Gating
• ECG is continuously monitored & the
patient table moves through the gantry
• X-rays are on continuously
• Scan data are collected throughout the
heart cycle
• Retrospectively, data from select
points within R-R interval are selected
for image reconstruction
• High radiation dose
17. Reconstruction interval
• The reconstruction interval defines the degree of overlap between
reconstructed axial images
• Independent of x-ray beam collimation or image thickness and has no
effect on scan time or patient dose
• Improves the resolution especially in 3D & MPR images
• For cardiac images, at least 50% overlap is desirable (0.5-mm section
thickness with 0.25-mm reconstruction interval)
19. Pitch
• The ratio of table increment per
gantry rotation to the total x-ray
beam width
• If the table feed becomes greater
than the beam width, it results in a
data gap, which is detrimental for
image reconstruction.
• Pitch for cardiac imaging is 0.2 to
0.4 for higher spatial resolution
33. AV NODAL ARTERY
Axial and oblique MPR images showing the AV nodal
branch arising at the level of crux (arrow)
34. Dominance
• The coronary artery that gives rise to the PDA and posterolateral
branch is referred to as the “dominant” artery, with the RCA being
dominant in approximately 70% of cases.
• The LCA is dominant in approximately 10% of cases, supplying the
entire LV, accompanied by the PDA and posterolateral branches from
the LCx artery.
38. TECHNIQUE
Patient preparation:
• No solid food for 4 hours
• No stimulants like coffee
• Explain the procedure to reduce anxiety
• History of pacemakers and previous bypass surgery
• 18G IV access in antecubital vein
• ECG Leads- Just below right & left clavicle and left lower chest
• Beta blockers and calcium channel blockers are given to reduce the
heart rate <60
39. Parameters
Gantry rotation time - 280 msec
Pitch - 0.2 to 0.5
Collimation - 128 × 0.6 mm
Tube voltage - 120 kV
Tube current - 528mAs
(Effective mAs)
Acquisition mode - Retrospective ECG Gating
40. Contrast administration
• 80ml of non ionic contrast (350
mgI/ml) followed by 30ml of
saline (3.5-5ml/sec).
• Scanning is triggered after the
contrast reaches the ascending
aorta
• Triggering can be done in two
ways one is using a test bolus
technique and the other is using
a bolus tracking technique.
43. Axial veiw
• Initial image evaluation
• Review of Extra cardiac structures
• Limitation - Tortuous course of vessels
44. Multiplanar reconstruction
• Evaluation of cardiac chambers, Aorta and Pulmonary arteries
• Selective evaluation of a short segment if narrowing is suspected on
axial views.
Limitations
• Difficulty in visualizing coronaries in single oblique MPR; angle of the
reconstruction plane must be changed constantly to follow the vessel
• Stenosis grading impossible due to partial averaging
45. Curved MPR
• Done by Manual or Automatic method
• To identify and quantify the degree of stenosis
Disadvantages:
• Optimal contrast opacification is needed
• Correct centerline placement
46.
47. Maximum-intensity projections
Advantages
• Reduced noise
• Good resolution between vessels and adjacent tissues
• ‘’Angiographic” representation of coronary arteries, less dependent on
their course.
Limitations
• Potential distortion of coronary arteries and the sensitivity of the
technique to wall calcification, which can hinder vascular assessment.
• Overestimation of stenosis
• MIP images should be interpreted with original axial and MPR and not
be assessed alone to avoid misinterpretations.
48. Volume rendering
Advantages:
• Display tissues with intact spatial relationships
• Define complex anatomy of the heart and coronary arteries
Disadvantages:
• Operator dependent
• Stenosis can’t be evaluated
50. •Quantitative assessment of atherosclerotic burden of the patient
Indications:
• Atypical chest pain
• Asymptomatic patients with other cardiovascular risk factors
• Done routinely during coronary CT angiography
• Prospective sequential scan
• Agatston scoring commonly used
CORONARY CALCIUM SCORING
51. AGATSTON SCORE
• A constant attenuation threshold minimum of 130 HU is used to
distinguish noncalcified from calcified coronary artery lesions.
• Weighted density score given to the highest attenuation value
(HU) X Area of the calcification speck (400 X 8sqmm=32).
• Summed up for all lesions – final score
HU Per Lesion Score
130-199 1
200-299 2
300-399 3
>400 4
52. Grading of coronary artery disease (based on total calcium score)
• No evidence of CAD: 0 calcium score
• Minimal: 1-10
• Mild: 11-100
• Moderate: 101-400
• Severe: >400
56. Plaque attenuation and pattern
• <30 HU is widely used cut-off to differentiate between lipid-rich and
fibrous plaques.
• Types of plaque
Non calcified/ Lipid-rich plaques 42 HU (+/- 22)
Partially calcified/ Intermediate plaques 70 HU (+/- 21)
Calcified plaques (>130 HU on non-enhanced CT).
• Intra plaque calcification destabilizes the plaques and causes plaque
rupture.
• Microcalcifications- PET imaging using 18F- sodium fluoride
57. Vulnerable plaques
STABLE PLAQUES UNSTABLE/VULNERABLE
PLAQUES
• Large
calcifications
• Fibrotic tissue
and
• Smaller lipid
pools.
• Spotty calcifications
• Large-lipid pool (necrotic
core), which is covered by a
thin fibrous cap [thin-cap
fibroatheroma (TCFA)].
58. Positive remodelling
• Growth of plaque outwards without
significant luminal stenosis.
• No flow limitation caused as the lipid
starts accumulating in the plaques.
• More frequent in ACS patients
compared to stable angina.
59. Spotty calcifications
• Defined as calcifications < 3 mm.
Small (< 1 mm), associated with high-
risk plaques
Intermediate (1-3 mm) and
Large (> 3 mm) calcifications.
60. Napkin-ring sign
• NRS plaques are characterized by a central low attenuation area
(<130HU), which is apparently in touch with the lumen, encompassed
by a higher attenuation ring-like peripheral area
• NRS plaques had greater area of lipid-rich necrotic core which is a key
feature of rupture prone TCFA’s
• Qualitative high-risk plaque feature on CTA and is strongly associated
with major adverse cardiovascular events.
• On histology
Low-attenuation central area- large necrotic core,
Ring-like high attenuation outer area- fibrous plaque tissue.
61.
62.
63. Stenosis assessment
Degree of coronary stenosis:
• Normal
• Minimal <25% stenosis
• Mild 25-49%
• Moderate 50-69%
• Severe/High grade stenosis >70-99%
• Complete occlusion 100%
50% stenosis of LMCA is considered very significant
70. ALCAPA
• Anomalous origin of the LCA from
pulmonary artery.
• Results in the left ventricular
myocardium being perfused by
relatively desaturated blood under
low pressure, leading to myocardial
ischemia.
• 0.25-0.5% of all CHD
• Symptoms of CHF within the first 1-
2 months of life.
71. • Evaluation of CABGs in both the early and late postoperative settings
• Provides valuable information for the planning of repeat bypass
surgeries
• Sometimes difficult - metal clip artifacts
• Sensitivity-100% specificity-99% for detecting bypass graft occlusion
Coronary Artery Bypass Grafts
81. • Dose is highly dependent on the protocol used
• ECG Modulation – Tube current is reduced during
systole and 10-40% reduction in dose.
RADIATION RISKS
82. CONCLUSION
• Coronary CTA is a noninvasive diagnostic modality to visualize
the coronary arteries and to detect significant coronary stenosis
• Best modality to rule out disease, bypass graft and arterial
anomalies evaluation
• Has a high sensitivity and negative predictive value for coronary
stenosis detection
• Higher temporal resolution and reduced dose are necessary for
wider applications in future
83. 1. Webb: Pulmonary and cardiovascular imaging
2. Coronary artery disease in young Indians. JIACM 2001.Vol. 2, No. 3
3. Physics of cardiac imaging with MDCT Radiographics 2007; 27:1495–1509
4. Predictive value of EBCT. Circulation 1996 ,93(11)1951-1953
5. Plaque imaging with CT—a comprehensive review on coronary CT
angiography based risk assessment; cardiovascular diagnosis and therapy, Vol
7, no 5
6. The Napkin-Ring Sign: CT Signature of High-Risk Coronary Plaques
Pál MaurovichHorvat, Udo Hoffmann, Marc Vorpahl, Masataka Nakano, Renu
Virmani, Hatem Alkadhi, J Am Coll Cardiol Img. 2010 Apr, 3 (4) 440-444.
REFERENCES
Editor's Notes
Coronary artery disease represents a major cause of morbidity and mortality in the world.
In India, compared to the western population there is 2-4 fold higher prevalence of CAD & mortality.
By the end 21st century, India would account for more than half of the total heart patients in the world (WHO) .
Gold standard to evaluate and treat CAD is conventional coronary angiography.
In1982, specifically for cardiac imaging, able to acquire an image in 100 msec, suited for cardiac imaging at that time.
Electrons accelerated in a vacuum funnel and are precisely focused towards and swept across a 210º tungsten ring anode placed under the patient. A cone beam of X-ray photons is emitted which go through the patient and are captured by two 240º detector rows above the patient. Slice collimation is 3 mm, so 40 slices needed to cover the entire heart (12 cm),for a total imaging time of 30 sec.
One breath-hold. ECG-based triggering used for motion-free imaging during diastole. Significant motion artifacts still remain.
the spectrum of applications limited, and its physical setup cumbersome. Mostly used for noninvasive evaluation of coronary artery calcium but other applications including assessment of coronary artery stenosis have been reported in limited cases. Expensive and widely not available
Cardiac imaging with multiple-row detector computed tomography (CT) has become possible due to rapid advances in CT technologies.
the demand for high temporal resolution implies decreased scan time required to obtain data needed for image reconstruction and is usually expressed in milliseconds.
The coronary arteries generally fills in with blood during the diastolic phase, when the heart is relaxed and this is the right time to take images of the coronaries using cardiac scanner. As you know to image any fast moving structure we should use the fastest mode of gantry rotation and should use the multi-sector reconstruction.
ECG represents the contraction and relaxation of heart, called as systole and diastole respectively. In cardiac scanners we couple the ECG waveform with that of image acquisition and reconstruction, known as ECG-gated cardiac scanning. The ECG shows a very distinct electrical peak called as R-wave the immediate time gap after this peak is the systole followed by diastole. Thus, for a patient having 60 beats per minute the interval between one R-R wave is 1 second or 1000 ms.
However, with increasing gantry rotation speed, there is also an increase in the stresses on the gantry structure, since rapid movement of heavy mechanical components inside the CT gantry results in higher G forces, making it harder to achieve a further reduction in gantry rotation time.
since the currently available gantry rotation time is not in the desired range for obtaining reasonable temporal resolution, various methods have been developed to compensate, such as different types of scan acquisitions or image reconstructions to further improve temporal resolution.
the patient’s ECG is continuously monitored but the x-rays are turned on at predetermined R-R intervals to acquire sufficient scan data for image reconstruction. The table is then moved to the next location for further data acquisition. These types of scans are always sequential and not helical and result in a lower patient dose because the x-rays are on for a limited period. Calcium scoring scans are typically performed in this scan mode.
In partial scan reconstruction, sufficient data from prescribed time range within the R-R interval of one cardiac cycle are selected for image reconstruction. Both prospective triggering and retrospective gating acquisitions
In Multiple segment reconstruction sufficient data segments of the same phase from multiple cardiac cycles are selected for image reconstruction. Possible only with a retrospective gating technique and a regular heart rhythm
Data required for a partial scan reconstruction are selected from various sequential heart cycles
The minimum amount of data required to reconstruct a CT image is at least 180° plus the fan angle of data in any axial plane. This determines the scan time to acquire projection data needed for partial scan reconstruction and also limits the temporal resolution that can be achieved from an acquisition.
If the gantry rotation time is 500 msec, the time required to obtain the minimum scan data is slightly greater than half of the gantry rotation time. This means that, for a gantry rotation of 500 msec, the scan time for acquiring data for partial scan reconstruction is around 260 to 280 msec. This value represents the limit of temporal resolution that can be achieved through partial scan reconstruction.
The multiple-segment reconstruction method selects small portions of projection data from various heart cycles, so that when all the projections are combined, they constitute sufficient data to perform partial scan reconstructions. For example, if one chooses to select half of the data set required for partial scan reconstruction from one heart cycle and the rest from another heart cycle, this results in temporal resolution that is about one-fourth of the gantry rotation time. This is done by using projection data from two separate segments of the heartbeat cycle for image reconstruction. Further improvement in temporal resolution can be achieved by cleverly selecting projection data from three or four different heart cycles, resulting in temporal resolution as low as
80 msec.
Effect of temporal resolution on reconstructed images from the same patient.
(a) Partial scan reconstruction with temporal resolution of approximately 250 msec.
(b) Multiple-segment reconstruction (two segments) yields a temporal resolution of approximately 105 msec. The stair-step artifacts are less visible and the structures in the sagittal plane have a smooth edge compared with the appearance of partial scan reconstruction.
axial spatial resolution has been very high from the beginning and is dependent on the scan field of view (SFOV) and image reconstruction matrix. On the other hand, the longitudinal
or z-axis resolution mainly depends on the image thickness. The z-axis spatial resolution (image thickness) ranges from 1 to 10 mm in conventional (nonhelical) and in helical single-row
detector CT. With multiple-row detector CT, the z-axis detector size is further reduced to submillimeter size
Overall, spatial resolution in the axial or x-y plane has always been quite high and is on the order of 10–20 line pairs per centimeter. The z axis spatial resolution is influenced by the detector
size, reconstruction thickness, and other factors such as pitch and is around 7–15 line pairs/cm
Pitch values less than 1 imply overlapping of the x-ray beam and higher patient dose; pitch values greater than 1 imply a gapped x-ray beam and reduced patient dose (18). Cardiac imaging demands low pitch values because higher pitch values result in data gaps (Fig 10), which are detrimental to image reconstruction. Also, low pitch values help minimize motion artifacts, and certain reconstruction algorithms work best at certain pitch values, which are lower than 0.5 in cardiac imaging
The aortic valve consists of three semilunar cusps, the right and the left, from which arise the right and left coronary arteries, and the posterior or non-coronary cusp. The cusps are pouch-shaped and flexible. When blood moves out of the left heart during systolic contraction, the pliable valve cusps are forced outwards towards the wall of the aorta, allowing for free flow of blood. Upon diastole, however, the elastic walls of the aorta, no longer pushed outward by the force of ventricular contraction, will recoil. This sends a backflow of blood towards the valve cusps, producing valve closure. Blood then fills the aortic sinuses (Sinuses of Valsalva) from which the coronary arteries arise and is projected down the right and left main branches.
Axial MPR image (superoinferior view) demonstrates the aortic valve and its cusps in relation to the LA. These cusps are the right coronary cusp (white *), the left coronary cusp (black *), and the noncoronary cusp (box).
The LAD artery courses anterolaterally in the epicardial fat of the anterior interventricular groove and supplies the majority of the LV
Axial MPR image displays the origin of the coronary arteries from the aorta. The LCA (black arrow) bifurcates into the left anterior descending (LAD) artery (white arrowhead) and the left circumflex (LCx) artery (black arrowhead). White arrow indicates the right coronary artery (RCA). (b) VR image shows the LCA (black arrow) arising from the aorta and bifurcating into the proximal LCx artery (arrowhead) and the proximal LAD artery (white arrow).
Oblique axial (a)and vertical long-axis (b)MPR images show the normal LAD artery (arrows) coursing in the epicardial fat of the interventricular groove toward
the LV apex.
Oblique axial MPR (a) and VR (b) images show the septal branches (black arrowheads) and diagonal branches (white arrowheads) of the LAD artery. The septal branches quickly reach and penetrate the myocardium, whereas the diagonal branches course laterally to the LV free wall.
Figure 4. Oblique axial MPR (a) and VR (b) images show the LCx artery (black arrow) and obtuse marginal branches (white arrows).
The LCx artery is the other major branch of the LCA. It courses in the left AV groove, giving rise to obtuse marginal branches, sometimes referred to as lateral branches. It variably gives rise to posterolateral and posterior descending artery (PDA) branches supplying the diaphragmatic portion of
the LV
3D VR images showing the septal and diagonal branches of LAD
3D VR image showing left circumflex and obtuse marginal branch in green
Show variation in the number and size of the circumflex and its obtuse marginal branches
Axial section at the mid ventricular level showing the distribution of all the main branches
In approximately 15% of patients, a third branch, the ramus intermedius (RI) branch, arises at the division of the LCA, resulting in a trifurcation. When present, the RI branch courses laterally toward the LV free wall. Its course is similar to that of a diagonal branch of the LAD artery.
(a) Oblique axial MPR image shows the RI branch (arrow) arising between the LAD artery (black arrowhead) and the LCx artery (white arrowhead), resulting
in a trifurcation of the LCA. (b) VR image shows the RI branch (arrow) arising from the trifurcation. Black arrowhead indicates the LAD artery, white arrowhead indicates the LCx artery.
The RCA normally arises from the right coronary sinus (CS) and courses in the right AV groove toward the crux of the heart (the point on the posterior surface of the heart where the AV groove transects the line of the interventricular septum and interatrial septum, forming a cross).
In approximately 50%–60% of patients, the first branch of the RCA is a conus artery. The conus artery can also arise directly from the aorta (30%–35% of patients). The conus artery supplies the RV outflow tract and forms the circle of Vieussens, an anastomosis with the LAD arterial circulation. In approximately 58% of patients, the SAN artery arises from the RCA; in the remaining patients (42%), it arises from the LCx artery. Multiple ventricular branches arise from the RCA, the largest of which is called the acute marginal branch.
MPR images (a, c) and VR image (b) show the RCA (black arrow in a) and its branches. In this case, the conus artery (arrowhead in a) arises from the aorta. White arrow in a and arrow in b indicate the acute marginal branch, arrowhead in c indicates the sinoatrial nodal branch.
In 80% of patients, the right coronary artery supplies the atrioventricular (AV) node via an AV nodal artery. This
branch arises near the origin of the posterior descending artery (PDA) at an area known as the crux of the heart,
where the two ventricles and two atria meet.
This is a coronary segmentation diagram of the Society of Cardiovascular Computed Tomography is used to indicate where the stenoses are located
Coronary sinus is the wide vein which courses in the posterior part of coronary sulcus from the left side to the right side accompanying the circumflex artery. It opens into the right atrium. It receives the great cardiac vein at its left, and the middle and small cardiac veins at its end on the right side.
Tributaries
• The great cardiac vein is located in the anterior interventricular sulcus, alongside the anterior interventricular (descending) artery. It courses upwards from the apex and drains into the coronary sinus.
• The middle cardiac vein also begins at the apex but it courses upwards in the posterior interventricular sulcus, alongside the posterior interventricular (descending) artery.
The main coronary arteries habitually follow an epicardial route. On occasion the epicardial arteries penetrate into the myocardium for part of their route and finally occupy their habitual epicardial position, popularly known as myocardial bridging or tunneled coronary artery. Bridging is charecterized by systolic compression of the tunneled segment which may remain clinically silent in most cases. In some cases it may present with symptoms of myocardial ischemia. Several mechanisms are postulated for the occurrence of ischemia including vasospasm, systolic kinking of the artery, exercise induced high heart rate, shortened diastolic perfusion time. The likelihood of ischemia increases with the depth of the tunneled segment.
Oral Metoprolol–
If baseline > 60 bpm give metoprolol 50 mg orally.
– If baseline > 65 bpm give metoprolol 50-100 mg orally.
– If baseline > 70 bpm give metoprolol 100-150 mg orally.
– If baseline > 80 bpm give metoprolol 100-200 mg orally.
Images showing bolus triggering of contrast
BETA-BLOCKER USE FOR CCTA Purpose: To decrease patient’s heart rate and reduce r-r interval variability for improved image quality of coronary
artery CTA
Contraindications
• Congestive heart failure (CHF)
• Significant asthma or bronchospasm who have used an inhaler within the past 2 weeks
• Severe aortic stenosis
• Known hypersensitivity to metoprolol
• Systolic blood pressure less than 100 mm Hg
• Heart rate less than 60 bpm
Triple Rule-out
The unique and simple noninvasive tool for managing these patients with a single 10-12s scan, rules out these
3 potentially life threatening conditions.
There are three important causes for acute chest pain:
• Aortic dissection
• Pulmonary embolism
• Acute coronary artery blocks.
a window width of 800 –900 and a level of 350 –400 is an acceptable starting point to display MDCT-CA images,
Orthogonal standard MPR are of limited value in MDCT-CA due to the complex anatomy of the heart and coronary arteries, but on the contrary,
oblique MPR images are most useful to follow the tortuous course of the vessels, especially if interactively performed during the assessment on a workstation.
Representation of the vasculature by the selection of the highest attenuation voxels along directions projected through the acquired volume, rendered as a 2D image
Based on classification of voxels according to their density correlated to their representation in terms of colour and transparency
For example, if a calcified speck has a maximum attenuation value of 400 HU and occupies 8 sq mm area, then its calcium score will be 32.
Coronary calcium scoring correlates with extent of atherosclerosis but underestimates the total coronary plaque burden.
Intravascular US is the gold standard technique which is invasive and expensive
ROI is used to define plaque attenuation and pattern
Mean CT attenuation is measured and further categorized as low/ high attenuating plaque.
Low-attenuation plaque (HU=14) with severe (70-99%) stenosis in the LAD.
The advances in cardiac CT imaging now enable the noninvasive visualization of the coronary lumen and atherosclerotic plaques. Moreover, CT studies investigating patients with ACS described high-risk plaque features characteristic to culprit lesions, such as low plaque attenuation (<30 Hounsfield units [HU]), positive remodeling, and spotty calcification
Lipid plaques more vulnerable than calcified plaques
Vulnerable plaques are those which have large lipid core, spotty Ca, napkin ring lesions & positive remodeling.
On histology plaques with positive remodeling show a higher lipid content and abundance of macrophages.Patients with positive remodeled plaques can present with an acute coronary syndrome without any prior cardiac history.
An example of positive remodeling of a non-calcified plaque in the mid RCA. There is outward growth of the plaque with minimal stenosis of the lumen.
Spotty calcification in the LAD and D1
Overall, although the napkin-ring sign indicates increased vulnerability and subsequent adverse cardiovascular events, it is not specific to TCFA.
HISTOPATHOLOGY HAS DEMONSTRATED THAT RUPTURE OF CORONARY ATHEROSCLEROTIC PLAQUES WITH subsequent intraluminal formation of thrombi is the most frequent cause of acute myocardial infarction (1).
Furthermore, it has been shown that plaque ruptures resemble plaques that are histologically classified as thin cap fibroatheroma (TCFA). TCFAs have distinct histological characteristics, including a large necrotic core with an overlying thin intact fibrous cap, macrophage infiltration, and often increased number of intraplaque vasa vasorum (2). These lesions have been designated as vulnerable plaques indicating the increased probability of rupture
The lesion is characterized by a necrotic core (star), which is consistent with the low attenuation core of the plaque and a significant amount of fibrous plaque tissue, which is consistent with the high attenuation rim on the CT images (red dashed line). The arrowheads indicate the vasa vasorum.
Both axial and MPR images permit the visualization of the coronary arteries in multiple orientations. However, original axial images remain the cornerstone of the evaluation, as virtually all pathologies can be recognized.
Anomalous origin
High takeoff, Multiple ostia, Single coronary artery, Anomalous origin from pulmonary artery, Origin of coronary artery or branch from opposite or noncoronary sinus and an anomalous course(retroaortic, interarterial, prepulmonic, septal)
Anomalous course
Myocardial bridging, Duplication of arteries
Anomalous termination
Coronary artery fistula, Coronary arcade, Extracardiac termination
The illustration in the left upper corner is the most common and clinically significant anomaly.There is an anomalous origin of the LCA from the right sinus of Valsalva and the LCA courses between the aorta and pulmonary artery.This interarterial course can lead to compression of the LCA (yellow arrows) resulting in myocardial ischemia and sudden death.
The other anomalies in the figure on the left are not hemodynamically significant.
cardiac pulsation
Banding artifacts due to increased heart rate
incomplete breath holding. These types of artifacts are not observed on axial images
Banding artifacts due to an increased heart rate from 51 to 69 beats per minute. Coronal (a) reformatted images of the heart obtained from CT data show banding artifacts (arrowheads).
Artifacts due to incomplete breath holding. (a) Axial images show no motion artifacts. (b, c) Coronal (b) and sagittal (c) reformatted images show banding artifacts.