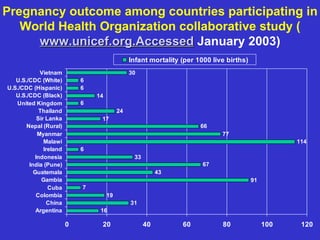
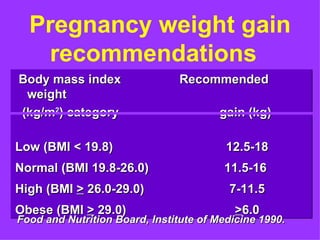
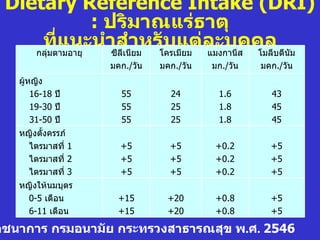
Pregnancy weight gain
recommendations
Body mass index Recommended
weight
(kg/m2) category gain (kg)
Low (BMI < 19.8) 12.5-18
Normal (BMI 19.8-26.0) 11.5-16
High (BMI > 26.0-29.0) 7-11.5
Obese (BMI > 29.0) >6.0
Food and Nutrition Board, Institute of Medicine 1990.
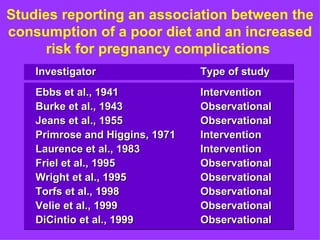
Studies reporting anassociation between the
consumption of a poor diet and an increased
risk for pregnancy complications
Investigator Type of study
Ebbs et al., 1941 Intervention
Burke et al., 1943 Observational
Jeans et al., 1955 Observational
Primrose and Higgins, 1971 Intervention
Laurence et al., 1983 Intervention
Friel et al., 1995 Observational
Wright et al., 1995 Observational
Torfs et al., 1998 Observational
Velie et al., 1999 Observational
DiCintio et al., 1999 Observational
13.
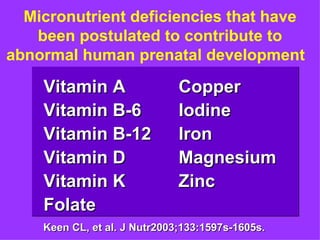
Micronutrient deficiencies thathave
been postulated to contribute to
abnormal human prenatal development
Vitamin A Copper
Vitamin B-6 Iodine
Vitamin B-12 Iron
Vitamin D Magnesium
Vitamin K Zinc
Folate
Keen CL, et al. J Nutr2003;133:1597s-1605s.
Prepregnant overweight andobesity
negatively affect breastfeeding
• Decreased prolactin response to
suckling in the first week postpartum
may contribute to early lactation
failure.
Rasmussen KM, et al. Pediatrics 2004.
25.
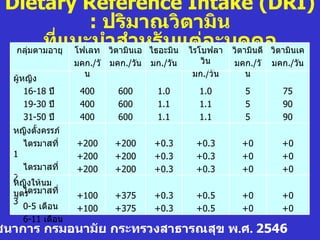
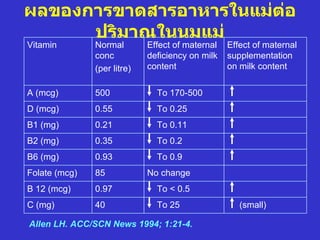
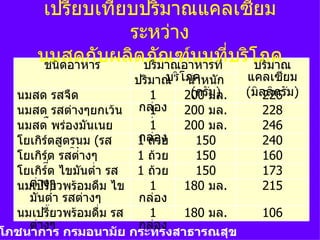
ผลของการขาดสารอาหารในแม่ต่อ
ปริมาณในนมแม่
Vitamin Normal Effect of maternal Effect of maternal
conc deficiency on milk supplementation
(per litre) content on milk content
A (mcg) 500 To 170-500
D (mcg) 0.55 To 0.25
B1 (mg) 0.21 To 0.11
B2 (mg) 0.35 To 0.2
B6 (mg) 0.93 To 0.9
Folate (mcg) 85 No change
B 12 (mcg) 0.97 To < 0.5
C (mg) 40 To 25 (small)
Allen LH. ACC/SCN News 1994; 1:21-4.
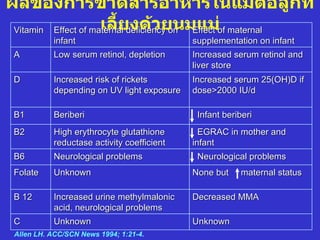
26.
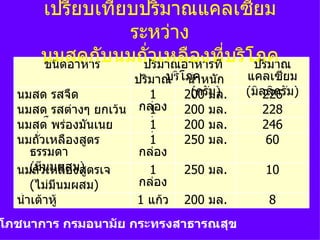
ผลของการขาดสารอาหารในแม่ต่อลูกที่
เลียงด้วยนมแม่of maternal
ำ
Vitamin Effect of maternal deficiency on Effect
infant supplementation on infant
A Low serum retinol, depletion Increased serum retinol and
liver store
D Increased risk of rickets Increased serum 25(OH)D if
depending on UV light exposure dose>2000 IU/d
B1 Beriberi Infant beriberi
B2 High erythrocyte glutathione EGRAC in mother and
reductase activity coefficient infant
B6 Neurological problems Neurological problems
Folate Unknown None but maternal status
B 12 Increased urine methylmalonic Decreased MMA
acid, neurological problems
C Unknown Unknown
Allen LH. ACC/SCN News 1994; 1:21-4.
27.
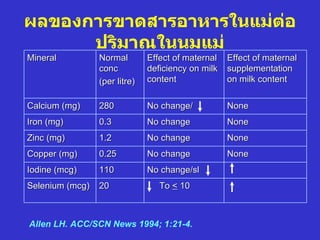
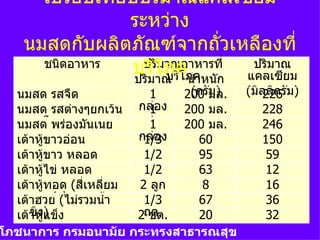
ผลของการขาดสารอาหารในแม่ต่อ
ปริมาณในนมแม่
Mineral Normal Effect of maternal Effect of maternal
conc deficiency on milk supplementation
(per litre) content on milk content
Calcium (mg) 280 No change/ None
Iron (mg) 0.3 No change None
Zinc (mg) 1.2 No change None
Copper (mg) 0.25 No change None
Iodine (mcg) 110 No change/sl
Selenium (mcg) 20 To < 10
Allen LH. ACC/SCN News 1994; 1:21-4.
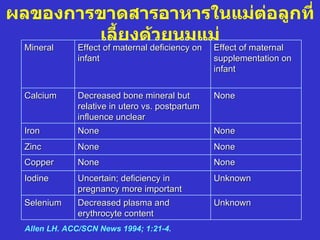
28.
ผลของการขาดสารอาหารในแม่ต่อลูกที่
เลียงด้วยนมแม่
ำ
Mineral Effect of maternal deficiency on Effect of maternal
infant supplementation on
infant
Calcium Decreased bone mineral but None
relative in utero vs. postpartum
influence unclear
Iron None None
Zinc None None
Copper None None
Iodine Uncertain; deficiency in Unknown
pregnancy more important
Selenium Decreased plasma and Unknown
erythrocyte content
Allen LH. ACC/SCN News 1994; 1:21-4.
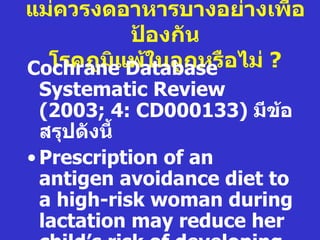
แม่ควรงดอาหารบางอย่างเพื่อ
ป้องกัน
โรคภูมแDatabase อไม่ ?
Cochraneิ พ้ในลูกหรื
Systematic Review
(2003; 4: CD000133) มีข้อ
สรุปดังนีำ
• Prescription of an
antigen avoidance diet to
a high-risk woman during
pregnancy is UNLIKELY
48.
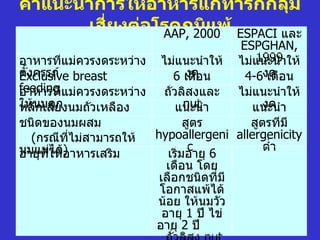
แม่ควรงดอาหารบางอย่างเพื่อ
ป้องกัน
โรคภูมแDatabase อไม่ ?
Cochraneิ พ้ในลูกหรื
Systematic Review
(2003; 4: CD000133) มีข้อ
สรุปดังนีำ
• Prescription of an
antigen avoidance diet to
a high-risk woman during
lactation may reduce her
DHA ( Docosahexaenoicacid)
• Important component of structural
lipid of brain and retina
• DHA supplementation of breast-
feeding mothers increases DHA in
breast milk and infant plasma
phospholipid.
Jensen CL, et al. AJCN 2000; 71:292S.
51.
FIGURE 1. Relationsbetween maternal plasma phospholipid and milk contents of
selected n-3 and n-6 fatty acids in mole percentage of total fatty acids at 8 wk
postpartum. , group 1 [algal docosahexaenoic acid (DHA)]; , group 2 (high-DHA eggs); ,
group 3 (low-eicosapentaenoic-acid fish oil); •, group 4 (control).
Jensen CL, et al. AJCN 2000; 71:292S.
52.
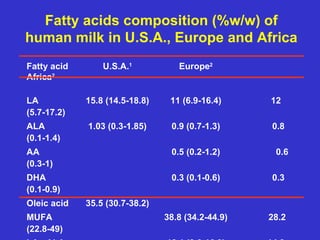
Fatty acids composition(%w/w) of
human milk in U.S.A., Europe and Africa
Fatty acid U.S.A.1 Europe2
Africa2
LA 15.8 (14.5-18.8) 11 (6.9-16.4) 12
(5.7-17.2)
ALA 1.03 (0.3-1.85) 0.9 (0.7-1.3) 0.8
(0.1-1.4)
AA 0.5 (0.2-1.2) 0.6
(0.3-1)
DHA 0.3 (0.1-0.6) 0.3
(0.1-0.9)
Oleic acid 35.5 (30.7-38.2)
MUFA 38.8 (34.2-44.9) 28.2
(22.8-49)
53.
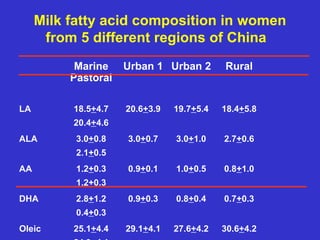
Milk fatty acidcomposition in women
from 5 different regions of China
Marine Urban 1 Urban 2 Rural
Pastoral
LA 18.5+4.7 20.6+3.9 19.7+5.4 18.4+5.8
20.4+4.6
ALA 3.0+0.8 3.0+0.7 3.0+1.0 2.7+0.6
2.1+0.5
AA 1.2+0.3 0.9+0.1 1.0+0.5 0.8+1.0
1.2+0.3
DHA 2.8+1.2 0.9+0.3 0.8+0.4 0.7+0.3
0.4+0.3
Oleic 25.1+4.4 29.1+4.1 27.6+4.2 30.6+4.2


![FIGURE 1. Relations between maternal plasma phospholipid and milk contents of
selected n-3 and n-6 fatty acids in mole percentage of total fatty acids at 8 wk
postpartum. , group 1 [algal docosahexaenoic acid (DHA)]; , group 2 (high-DHA eggs); ,
group 3 (low-eicosapentaenoic-acid fish oil); •, group 4 (control).
Jensen CL, et al. AJCN 2000; 71:292S.](https://image.slidesharecdn.com/16maternalnutrition-ppt-120427033622-phpapp01/85/16-maternal-nutrition-ppt-51-320.jpg)


![โภชนาการ[3[1]](https://cdn.slidesharecdn.com/ss_thumbnails/31-140704225642-phpapp02-thumbnail.jpg?width=640&height=640&fit=bounds)


