Download to read offline
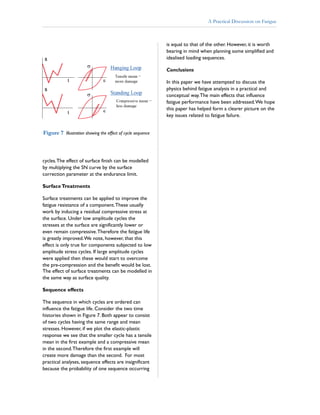

- Between 80-90% of structural failures occur due to fatigue, which is the weakening of a material caused by repeatedly applied stresses that are lower than the ultimate tensile strength. - Fatigue cracks initiate and grow in two stages - stage I cracks grow at 45 degrees to the load direction, while stage II cracks grow perpendicular to the load direction after traversing grain boundaries. - The key factors that affect fatigue crack growth rates are stress or strain range, mean stress, surface finish/quality, surface treatments, and loading sequence - with stress or strain range being the most influential factor. Higher stress or strain ranges cause faster crack growth.


