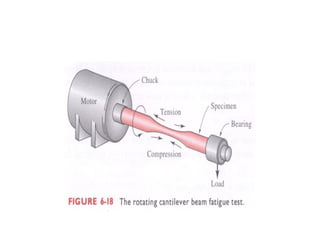
Fatigue Testing
History Regarding Fatigue
• Fatigue as a specific failure mechanism
recognized since the early part of the nineteenth
century.
• The development of rail travel that resulted in a
major increase of interest in this type of fracture.
• The premature failure of wagon axles led to
investigating fatigue failure under rotating
loading.
• This led to the design of the first standardized
rotating fatigue test.
Wohler rotating fatigue test
Fatigue Testing
• Failure under cyclic or repeated stress.
• The value of stress is lower than the static
stress required to cause fracture.
• It occurs in metals and non metals a like.
• Generally characterized by local crack
propagation.
• The component often showing no sign of
failure before the final fracture.
• Most fatigue failure occurs in relatively
common components such as gear teeth,
crankshaft, axel and so on.
• Catastrophic failures causing extensive
lives.
• In practice ninety percent of all services
failures are due to fatigue.
• Most of failures are due to poor design.
• Data obtained under constant load are
normally plotted on S-N curve.
• S is the amplitude of alternating stress.
• N is the No. of cycles to failure.
• Two types of S-N curve
• Fatigue limit and endurance limit.
• Better to draw S-N-P graph.
Variables affecting fatigue life
• Amplitude of the stress cycle:
• Surface condition:
• Effect of T: High fatigue strength at low T
• Frequency of stress cycle: little effect on
fatigue life. lowering frequency reduced
fatigue life.
• Environment:
• Failure can occur at a fluctuating load well
below the yield point of the metal and
below the allowable static design stress.
The number of cycles at which failure
occurs may vary from a couple of
hundreds to millions. There will be little or
no deformation at failure and the fracture
has a characteristic surface, as shown in
Fig.2.
• Why Do a Fatigue Test?
• In many applications, materials are subjected to vibrating
or oscillating forces.
• The behavior of materials under such load conditions
differs from the behavior under a static load.
• Because the material is subjected to repeated load
cycles (fatigue)
• in actual use, designers are faced with predicting fatigue
life, which is defined as the total number of cycles to
failure under specified loading conditions.
• Fatigue testing gives much better data to predict the in-
service life of materials.
• It should be mentioned that, in service, few structures
experience purely static loads and that most will be
subjected to some fluctuations in applied stresses
• Therefore be regarded as being fatigue loaded.
Motorway gantries, for example, are buffeted by the
slipstream from large lorries and offshore oilrigs by wave
action.
• Process pressure vessels will experience pressure
fluctuations and may also be thermally cycled.
• If these loads are not accounted for in the design, fatigue
failure may occur in as few as a couple of tens of cycles
or several million and the result may be catastrophic
when it does.
• It may be thought that the use of a higher strength
material will be of benefit in increasing fatigue life.
• The rate of crack propagation, however, is determined
by Young's Modulus - a measure of the elastic behaviour
of the metal - and not simply by tensile strength.
• Alloying or heat treatment to increase the strength of a
metal has very little effect on Young's Modulus and
therefore very little effect on crack propagation rates.
• Since the bulk of a welded component's life is spent in
propagating a crack, strength has little or no influence on
the fatigue life of a welded item.
• There is thus no benefit to be gained by using high
strength alloys if the design is fatigue limited.
• The figure shows several types of loading that could initiate a
fatigue crack.
• The upper left figure shows sinusoidal loading going from a tensile
stress to a compressive stress.
• For this type of stress cycle the maximum and minimum stresses
are equal.
• Tensile stress is considered positive, and compressive stress is
negative.
• The figure in the upper right shows sinusoidal loading with the
minimum and maximum stresses both in the tensile realm.
• Cyclic compression loading can also cause fatigue. The lower figure
shows variable-amplitude loading, which might be experienced by a
bridge or airplane wing or any other component that experiences
changing loading patterns.
• In variable-amplitude loading, only those cycles exceeding some
peak threshold will contribute to fatigue cracking.
• There are two general types of fatigue
tests conducted. One test focuses on the
nominal stress required to cause a fatigue
failure in some number of cycles. This test
results in data presented as a plot of
stress (S) against the number of cycles to
failure (N), which is known as an S-N
curve. A log scale is almost always used
for N.
• The data is obtained by cycling smooth or notched specimens until
failure.
• The usual procedure is to test the first specimen at a high peak
stress where failure is expected in a fairly short number of cycles.
• The test stress is decreased for each succeeding specimen until
one or two specimens do not fail in the specified numbers of cycles,
• which is usually at least 107
cycles. The highest stress at which a
runout (non-failure) occurs is taken as the fatigue threshold.
• Not all materials have a fatigue threshold (most nonferrous metallic
alloys do not) and for these materials the test is usually terminated
after about 108 or 5x10⁸ cycles.
• Since the amplitude of the cyclic loading has a
major effect on the fatigue performance, the S-N
relationship is determined for one specific
loading amplitude. The amplitude is express as
the R ratio value, which is the minimum peak
stress divided by the maximum peak stress.
(R=σmin/σmax). It is most common to test at an
R ratio of 0.1 but families of curves, with each
curve at a different R ratio, are often developed.

Fatigue testing and fatigue characteristics

  • 1.
  • 2.
    History Regarding Fatigue •Fatigue as a specific failure mechanism recognized since the early part of the nineteenth century. • The development of rail travel that resulted in a major increase of interest in this type of fracture. • The premature failure of wagon axles led to investigating fatigue failure under rotating loading. • This led to the design of the first standardized rotating fatigue test.
  • 3.
  • 5.
    Fatigue Testing • Failureunder cyclic or repeated stress. • The value of stress is lower than the static stress required to cause fracture. • It occurs in metals and non metals a like. • Generally characterized by local crack propagation. • The component often showing no sign of failure before the final fracture.
  • 6.
    • Most fatiguefailure occurs in relatively common components such as gear teeth, crankshaft, axel and so on. • Catastrophic failures causing extensive lives. • In practice ninety percent of all services failures are due to fatigue. • Most of failures are due to poor design.
  • 8.
    • Data obtainedunder constant load are normally plotted on S-N curve. • S is the amplitude of alternating stress. • N is the No. of cycles to failure. • Two types of S-N curve • Fatigue limit and endurance limit. • Better to draw S-N-P graph.
  • 12.
    Variables affecting fatiguelife • Amplitude of the stress cycle: • Surface condition: • Effect of T: High fatigue strength at low T • Frequency of stress cycle: little effect on fatigue life. lowering frequency reduced fatigue life. • Environment:
  • 13.
    • Failure canoccur at a fluctuating load well below the yield point of the metal and below the allowable static design stress. The number of cycles at which failure occurs may vary from a couple of hundreds to millions. There will be little or no deformation at failure and the fracture has a characteristic surface, as shown in Fig.2.
  • 14.
    • Why Doa Fatigue Test? • In many applications, materials are subjected to vibrating or oscillating forces. • The behavior of materials under such load conditions differs from the behavior under a static load. • Because the material is subjected to repeated load cycles (fatigue) • in actual use, designers are faced with predicting fatigue life, which is defined as the total number of cycles to failure under specified loading conditions. • Fatigue testing gives much better data to predict the in- service life of materials.
  • 15.
    • It shouldbe mentioned that, in service, few structures experience purely static loads and that most will be subjected to some fluctuations in applied stresses • Therefore be regarded as being fatigue loaded. Motorway gantries, for example, are buffeted by the slipstream from large lorries and offshore oilrigs by wave action. • Process pressure vessels will experience pressure fluctuations and may also be thermally cycled. • If these loads are not accounted for in the design, fatigue failure may occur in as few as a couple of tens of cycles or several million and the result may be catastrophic when it does.
  • 17.
    • It maybe thought that the use of a higher strength material will be of benefit in increasing fatigue life. • The rate of crack propagation, however, is determined by Young's Modulus - a measure of the elastic behaviour of the metal - and not simply by tensile strength. • Alloying or heat treatment to increase the strength of a metal has very little effect on Young's Modulus and therefore very little effect on crack propagation rates. • Since the bulk of a welded component's life is spent in propagating a crack, strength has little or no influence on the fatigue life of a welded item. • There is thus no benefit to be gained by using high strength alloys if the design is fatigue limited.
  • 18.
    • The figureshows several types of loading that could initiate a fatigue crack. • The upper left figure shows sinusoidal loading going from a tensile stress to a compressive stress. • For this type of stress cycle the maximum and minimum stresses are equal. • Tensile stress is considered positive, and compressive stress is negative. • The figure in the upper right shows sinusoidal loading with the minimum and maximum stresses both in the tensile realm. • Cyclic compression loading can also cause fatigue. The lower figure shows variable-amplitude loading, which might be experienced by a bridge or airplane wing or any other component that experiences changing loading patterns. • In variable-amplitude loading, only those cycles exceeding some peak threshold will contribute to fatigue cracking.
  • 19.
    • There aretwo general types of fatigue tests conducted. One test focuses on the nominal stress required to cause a fatigue failure in some number of cycles. This test results in data presented as a plot of stress (S) against the number of cycles to failure (N), which is known as an S-N curve. A log scale is almost always used for N.
  • 20.
    • The datais obtained by cycling smooth or notched specimens until failure. • The usual procedure is to test the first specimen at a high peak stress where failure is expected in a fairly short number of cycles. • The test stress is decreased for each succeeding specimen until one or two specimens do not fail in the specified numbers of cycles, • which is usually at least 107 cycles. The highest stress at which a runout (non-failure) occurs is taken as the fatigue threshold. • Not all materials have a fatigue threshold (most nonferrous metallic alloys do not) and for these materials the test is usually terminated after about 108 or 5x10⁸ cycles.
  • 21.
    • Since theamplitude of the cyclic loading has a major effect on the fatigue performance, the S-N relationship is determined for one specific loading amplitude. The amplitude is express as the R ratio value, which is the minimum peak stress divided by the maximum peak stress. (R=σmin/σmax). It is most common to test at an R ratio of 0.1 but families of curves, with each curve at a different R ratio, are often developed.